
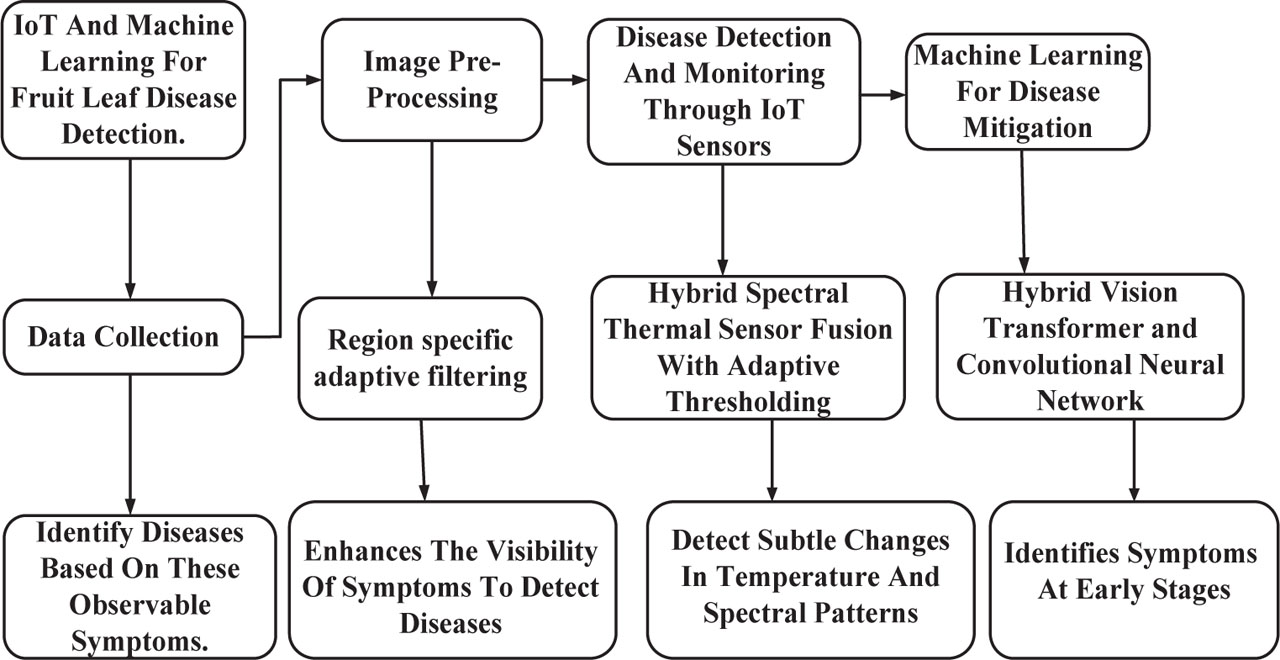
Figure 1:
Block diagram of the proposed work.
Table 1:
Data collection for plant disease prediction using IoT sensors
| Sensor type | Measurement type | Numerical value (range/example) |
|---|---|---|
| Hyperspectral sensors | Color variations (RGB values) | Red: 0–255, Green: 0–255, Blue: 0–255 |
| Moisture levels | 0%–100% (e.g., 25% indicates moderate moisture) | |
| Plant stress levels | 0–100 (e.g., 45 indicates moderate stress) | |
| Electrochemical sensors | pH levels | 4–9 (e.g., 6.2 for healthy, 4.5 for stressed plants) |
| Chemical composition (e.g., Chlorophyll) | 0–100 µg/g (e.g., 35 µg/g indicates healthy leaves) | |
| Environmental sensors | Ambient temperature (°C) | 10–40 (e.g., 25°C for typical growing conditions) |
| Humidity (%) | 30–80 (e.g., 50% for ideal conditions) | |
| Soil moisture (%) | 0–100 (e.g., 30% for well-watered soil) | |
| Symptoms observed (leaf) | Leaf discoloration (RGB value) | Red: 160, Green: 120, Blue: 100 (e.g., early anthracnose) |
| Wilting (percentage of leaf area affected) | 0%–100% (e.g., 40% for early-stage wilting) | |
| Lesions (size in mm2) | 0–100 mm2 (e.g., 25 mm2 for moderate lesion size) | |
| Chlorosis (leaf color change from green) | RGB values, e.g., Red: 150, Green: 180, Blue: 120 for chlorosis |
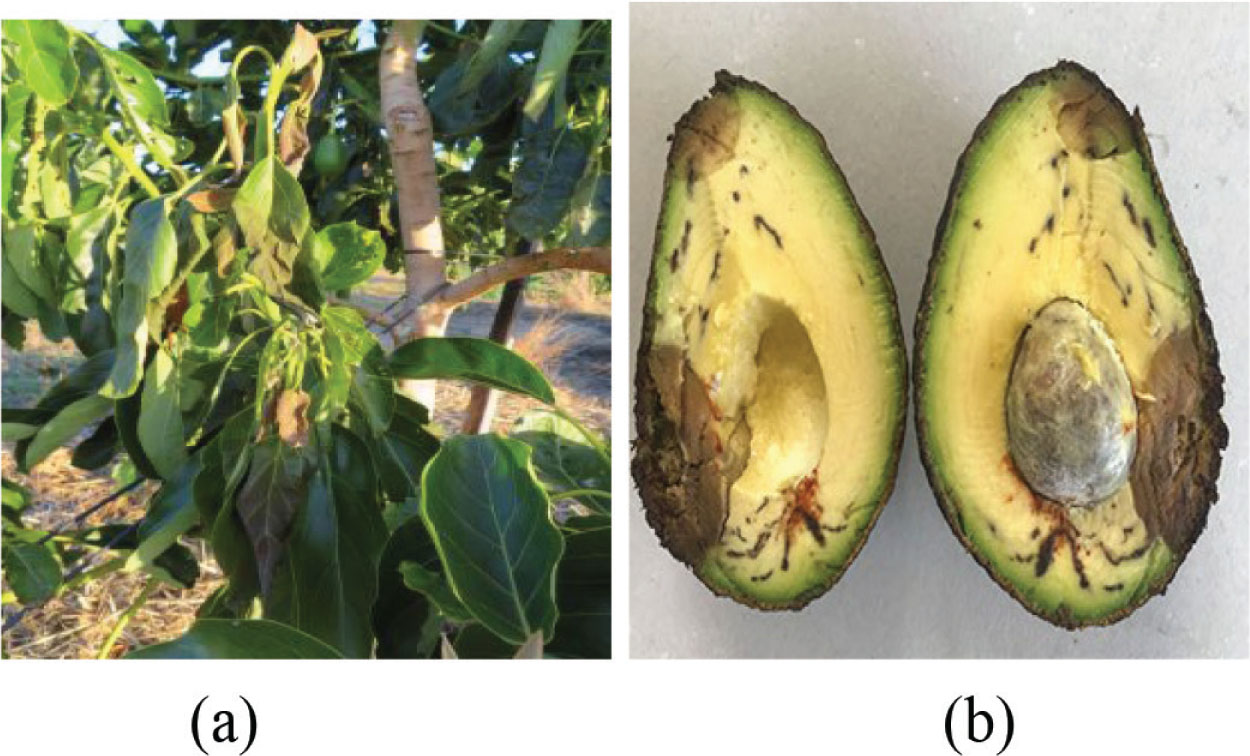
Figure 2:
Avocado fruit leaf disease. (A) Avocado plant showing symptoms of Verticillium wilt, including leaf wilting and chlorosis; (B) Avocado fruit infected with anthracnose showing dark necrotic lesions and tissue decay.
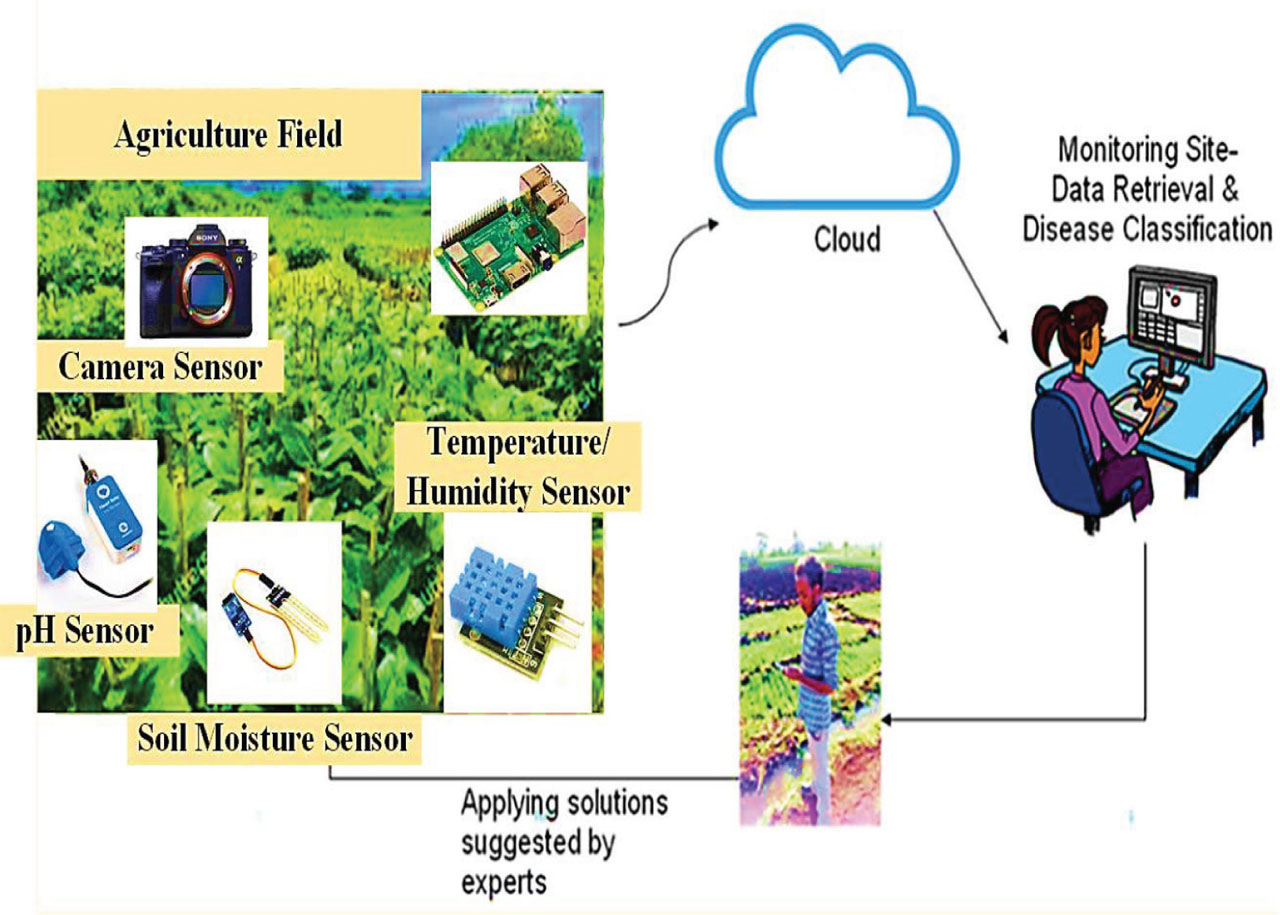
Figure 3:
IoT-enabled smart agriculture for disease detection and crop management. IoT, Internet-of-Things.
Table 2:
HSTSF-AT
| Algorithm 1: HSTSF-AT |
|---|
| Collect Data: Sensors are used to acquire spectral and thermal data. |
| Preprocess Data: To clear up the datasets and clear out noise. |
| Normalize Data: Normalize spectral and thermal on a standard scale to compare data. |
| Fuse Data: Index and interpolation are statistical techniques to combine datasets. |
| Assign Weights: If it is not too sensitive to plant conditions, you give less and moderate weights when the data is perfect. |
| Set Thresholding: Basic statistics can tell you where the curve is centered and how broad it may be. |
| Set Dynamic Thresholds: The peaks can be found by looking past noise, using modestly filtered data derivative. |
| Detect Disease: Review the fused signal against the go-to. |
| Knowledge Representation: For security module implementation, it should be created as you venture into something new (for example, this one). |
| Generate Alerts: If the data exceeds thresholds, note the disease in a letter. |
| Take Action: Provide timely notice to help farmers better control disease. |
Table 3:
Spectral–thermal fusion weight optimization results
| Spectral weight (w1) | Thermal weight (w2) | Validation accuracy (%) |
|---|---|---|
| 0.3 | 0.7 | 88.2 |
| 0.5 | 0.5 | 91.4 |
| 0.6 | 0.4 | 92.1 |
Table 4:
HVT-CNN architecture and training hyperparameter configuration
| Parameter | Value |
|---|---|
| CNN layers | 5 |
| Transformer layers | 4 |
| Patch size | 16 × 16 |
| Embedding dimension | 256 |
| Optimizer | Adam |
| Learning rate | 0.0001 |
| Batch size | 32 |
| Epochs | 50 |
| Loss function | Cross-entropy |
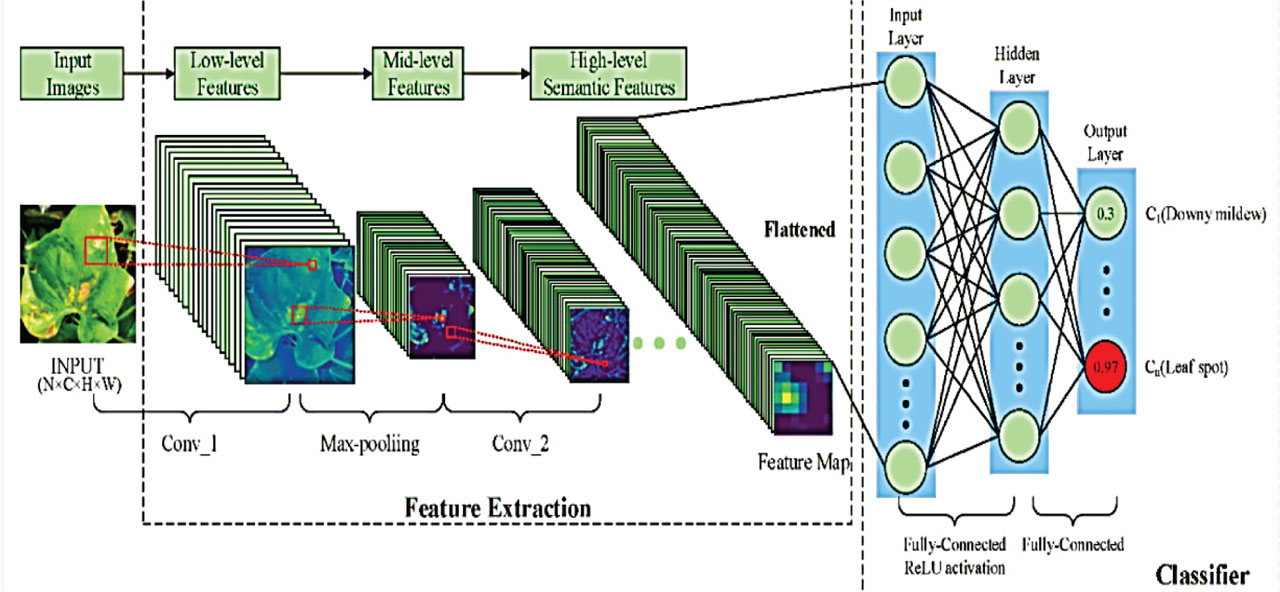
Figure 4:
CNN leaf disease classification. CNN, convolutional neural networks.
Table 5:
IoT sensor deployment configuration
| Sensor | Type | Sampling interval | Calibration method |
|---|---|---|---|
| Hyperspectral | Reflectance | 10 min | White reference |
| Thermal | Infrared | 10 min | Blackbody |
| Soil moisture | Probe | 10 min | Soil standard |
| pH | Electrochemical | Hourly | Buffer solution |
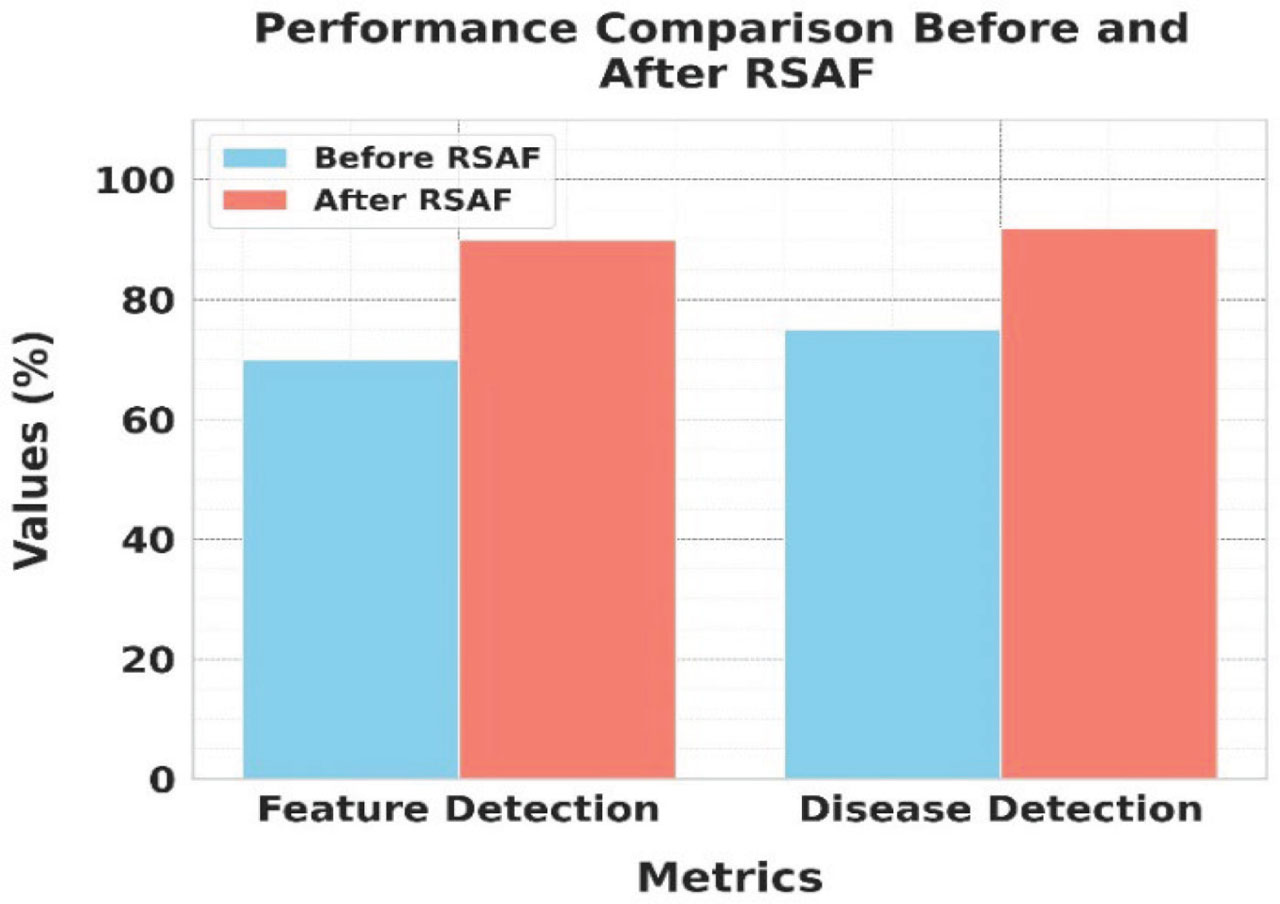
Figure 5:
Impact of RSAF on disease detection accuracy. RSAF, region-specific adaptive filters.
Table 6:
Comparative performance of preprocessing methods for avocado leaf disease classification
| Method | Accuracy (%) | F1-score |
|---|---|---|
| Histogram equalization | 84.3 | 0.83 |
| CLAHE | 86.9 | 0.86 |
| Bilateral filter | 87.5 | 0.87 |
| RSAF (proposed) | 92.0 | 0.91 |
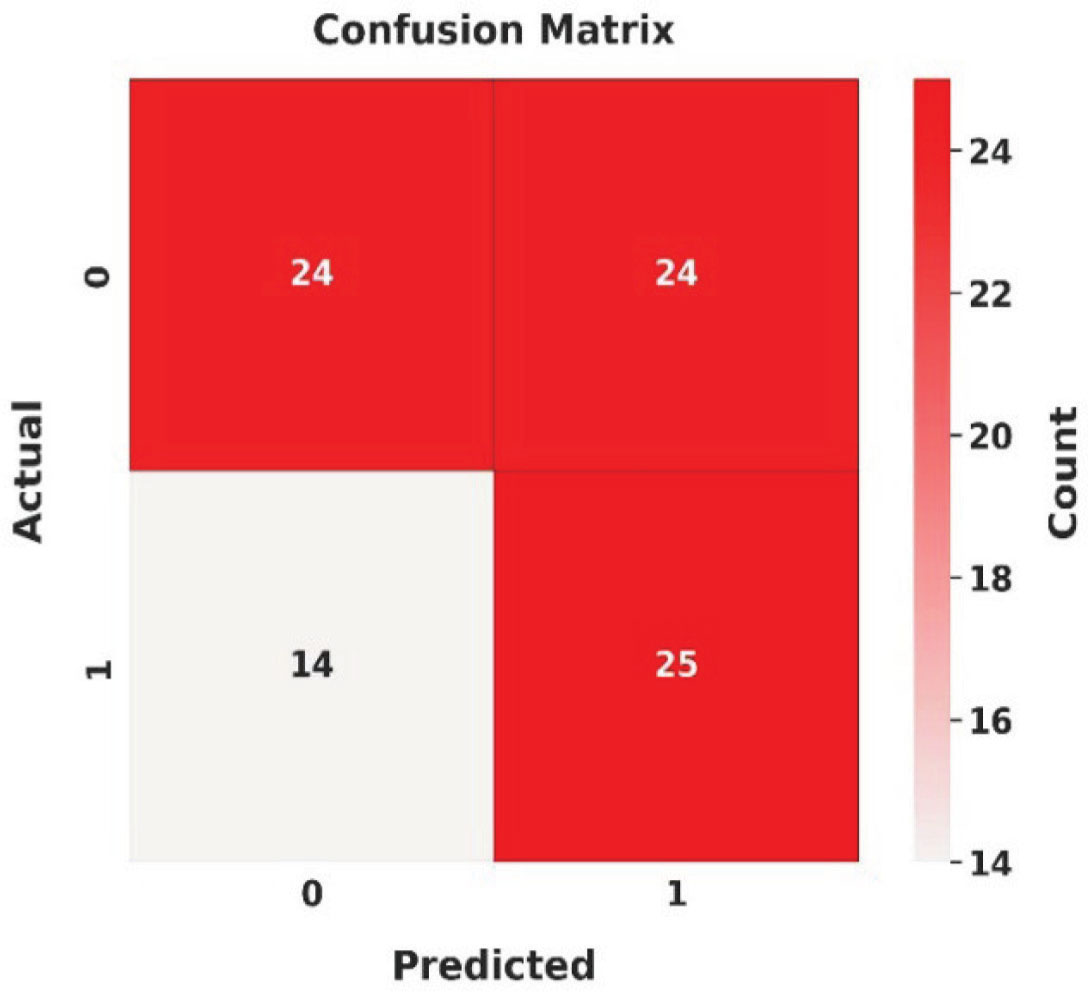
Figure 6:
Confusion matrix for actual and predicted disease detection.
Table 7:
Per-class performance metrics of the proposed HVT-CNN model
| Class | Precision | Recall | F1-score |
|---|---|---|---|
| Healthy | 0.94 | 0.95 | 0.95 |
| Anthracnose | 0.91 | 0.90 | 0.90 |
| Verticillium | 0.92 | 0.91 | 0.91 |
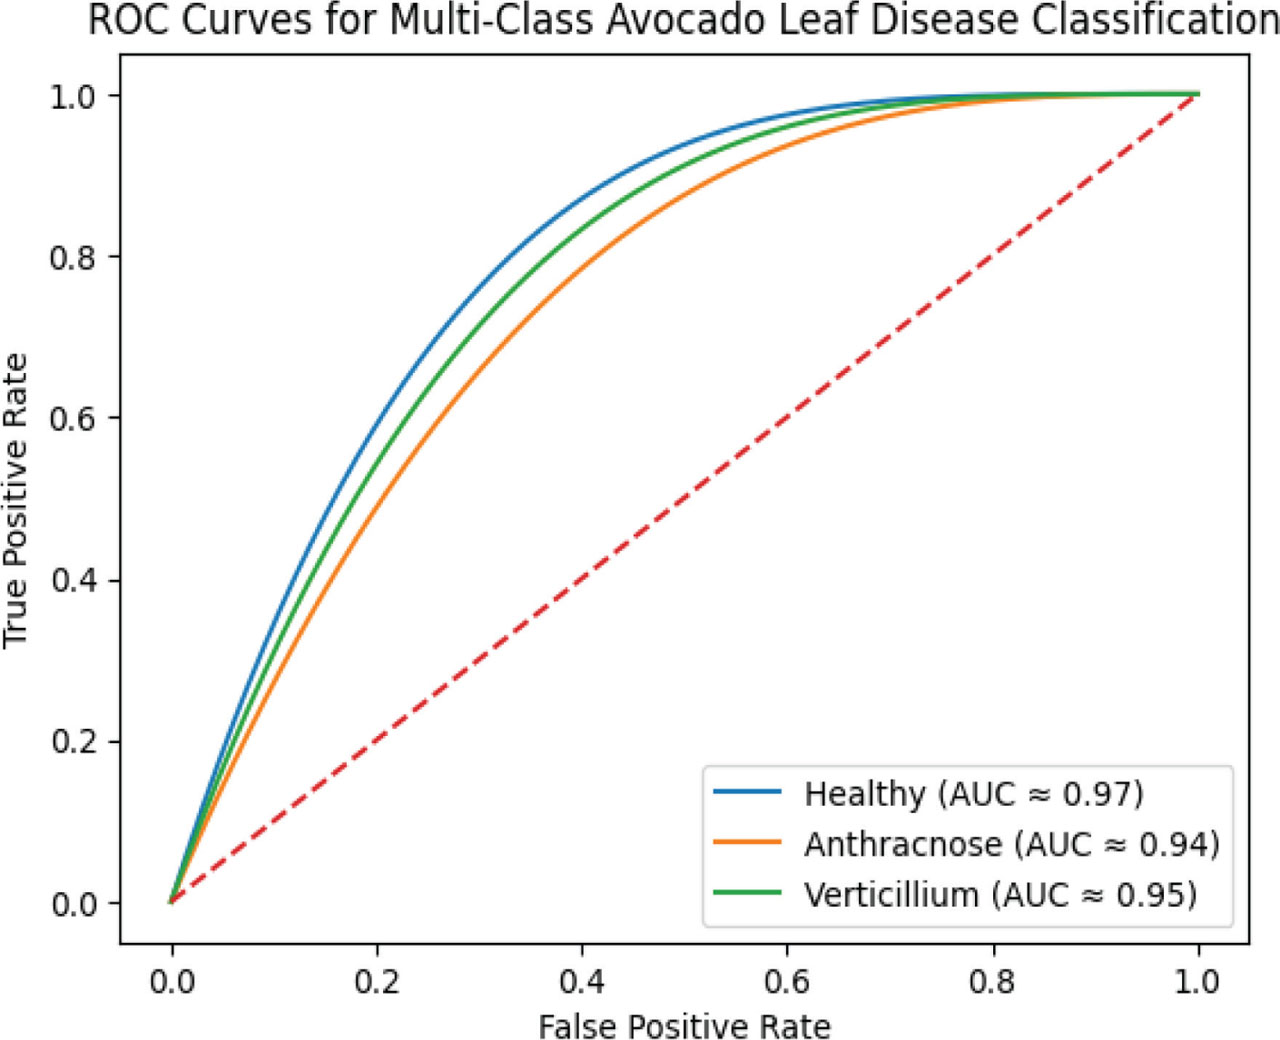
Figure 7:
ROC curves for multi-class avocado leaf disease classification. AUC, area under the curve; ROC, Receiver Operating Characteristic.
Table 8:
Environmental factors and observed values for crop growth
| Environmental factor | Threshold value | Observed value |
|---|---|---|
| Ambient temperature (°C) | 20–30 | 25 |
| Humidity (%) | 50–70 | 65 |
| Soil moisture (%) | 30–50 | 45 |
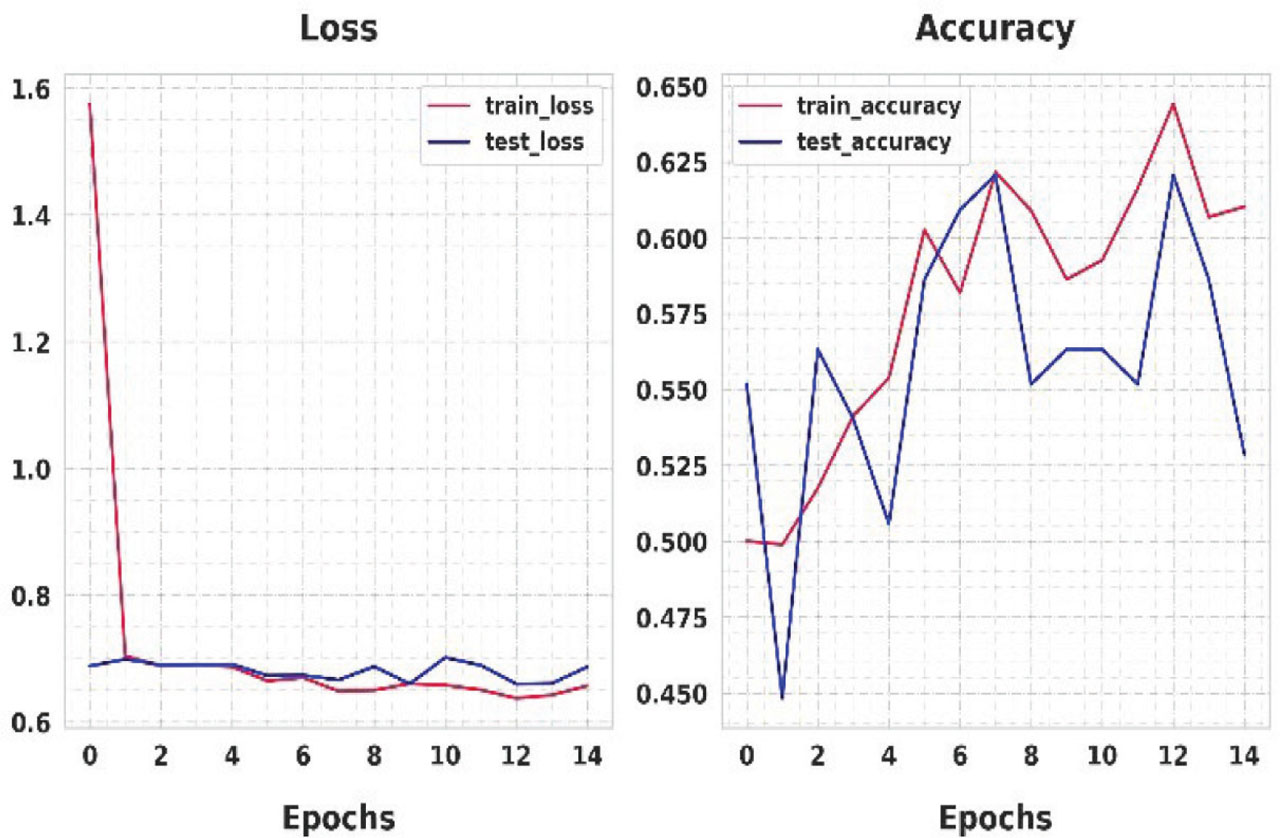
Figure 8:
Training and validation performance metrics.
Table 9:
HSTSF-AT for crop monitoring
| Day | Crop type | Temp (°C) | Spectral change (%) | Threshold temp (°C) | Threshold spectral change (%) |
|---|---|---|---|---|---|
| 1 | Avocado | 23.2 | 3.5 | 25 | 5.0 |
| 5 | 26.1 | 6.5 | 26 | 6.0 | |
| 10 | 30.0 | 12.1 | 29 | 8.5 | |
| 15 | 32.2 | 15.4 | 30 | 9.5 |
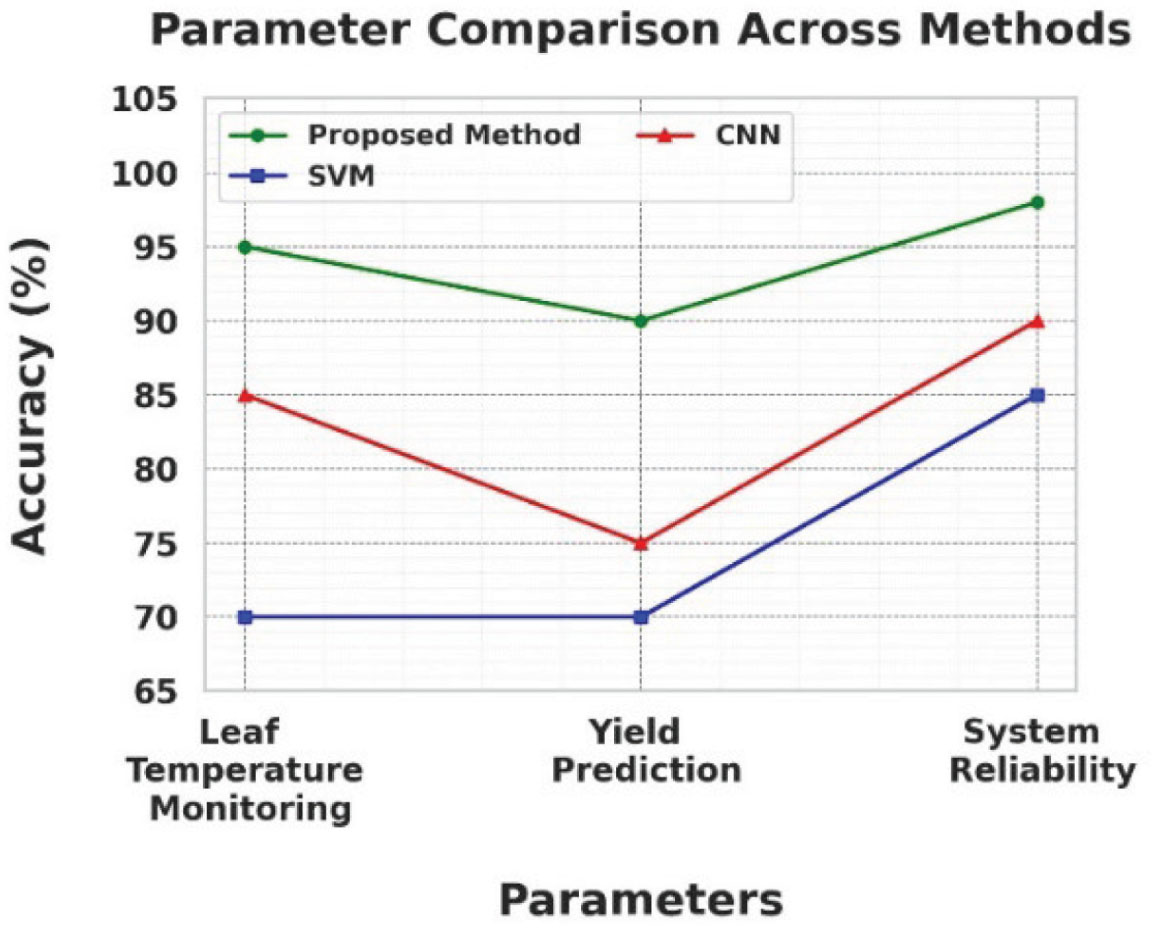
Figure 9:
Comparison of proposed method with SVM and CNN. CNN, convolutional neural networks; SVM, support vector machine.