
I. Introduction
The recovery of the lost agricultural productivity is an urgent goal, but the exact ways of doing the same is unclear. At the same time, it is necessary to identify the infection of plant leaves at their initial stages and intervene in time. The conventional manual inspection processes, which are not only time-consuming but also prone to minor flaws, thus allowing imperfections to continue existing [1,2,3,4,5]; in addition, they are not effective in many cases, and therefore, they have been replaced by visual check-ups. Hyperspectral Imaging uses the ability of the Internet-of-Things (IoT) sensors to measure the most vital environmental parameters, such as temperature, moisture, and humidity in real-time, which is combined with computational platforms sequentially processing images, as observed in the example of hyperspectral devices. They continuously assess plant health and, as these sensors make their rounds, can issue early warnings, such as in diseased areas with corms building up in the soil. Using devices by Masimo and Nirav Marine, one can identify the true colors of plant sap (a sign that the plant is free from disease) and decide whether dark patches on stems are considered or not [6]. By employing these devices, it is possible to immediately detect the onset and progress of Zygroiella annaomophila disease—for example, many more minor pathogens in coffee. Moreover, the actual level of atmospheric humidity at any given time can be estimated by using meters for coffee plants. Several different models combining CNNs and vision transformers (ViTs) [7,8] have been developed to provide empirical data that can be interpreted to help diagnose diseases. This makes it possible to conduct quicker and more accurate diagnoses than previous methods; for example, by categorizing illnesses, the detection speed is also increased. By combining machine learning algorithms and sensor data, plants may be guaranteed continued assistance throughout many seasons, ensuring growth under normal climatic conditions through targeted interventions [9,10]. Farmers hope this system engineering package will improve cultivation techniques and eventually provide environmentally friendly ways to increase plant yield and vitality. Carbohydrate fruit crops, such as avocados, have long been affected by plant diseases. Take, for example, Anthracnose and Verticillium wilt on avocados [11]. Disaster prevention through early detection cannot be overemphasized in daily scientific research. At present, traditional identification of diseases through visual inspection is not only serious and costly for human mess-ups but, in emergencies, can also lead to late recognition [12,13]. As a result, pesticides are used without restraint, which is both wasteful of resources and harmful to the environment. What is needed is an automatic, accurate, and real-time plant health monitoring system. This research aims to construct an all-around system using machine learning methods and Internet of Things (IoT) sensors to detect and prevent diseases in fruit leaf plants. IoT sensors that monitor key environmental conditions, such as temperature, humidity, and soil moisture, will be used as way posts of data to determine real-time plant health [14]. For disease symptoms observed in leaves (discolored lesions, wilted leaves), a scan of images moved and refurbished by sophisticated image processing methods from machine learning models will ensue [15,16]. Then, combining data from sensors and photographs of the infected plant with machine learning methods to categorize and forecast plant diseases early on can lead to intervention. In this way, remnants of the disease are minimal [17,18]. To reduce environmental effects, the system will reduce the environmental impact by delivering precise fungicides applications, precise fertilizer schedules, and proactive management of the disease due to which an extension of the mitigation strategies is considered. The need to have sustainable agricultural methods has not only resulted in high yields of crops [19], but it has also made the agriculture industry less dependent on toxic pesticides. Conventional methods of disease detection are not effective considering the farm size, and this is an aspect that has to be taken into account. Therefore, the proposed technology is aimed at offering an efficient system to maintain the health of plants and detect a disease in its early manifestation and treat it with the required remedies. The resultant findings are increased yield of farms, less use of pesticides by staff members [20], and environmentally friendly agricultural use.
II. Literature Survey
Various research studies have utilized the IoT and machine learning technologies to identify and manage diseases in the fruit leaflet plants. These studies underline the implementation of IoT sensors—electrochemical and hyperspectral—to track the indicators of plant health and disease references. Machine Learning (MN) models based on hybrid approaches (with or without convolutional neural networks [CNNs] and visual transformers) are useful in plant disease detection and classification, thus ensuring timely intervention and better management. Kiran and Chandrappa [21] were able to classify 10 plant species consisting of 40 classes with the help of a Random Forest classifier. Plant diseases are accurately detected, and this leads to further growth and health in the life cycle of plants. According to Mustak Un Nobi et al. [22], on one dataset, the Guava Leaf Disease Detection (GLD-Det) model showed a higher performance over all other competing models, which then scored impressive accuracies, precisions, recalls, and area under the curve (AUC) scores of 0.98, 0.98, 0.97, and 0.99. The principles of the Gradient-weighted Class Activation Mapping (Grad-CAM) methodology, which is a class discriminative localization technique, have been used to clarify the decision made by the model, thus improving the transparency and confidence. Nigar et al. [23] conducted an analysis based on the Local Interpretable Model-agnostic Explanations (LIME) framework in order to create a visual explication that could be used in accordance with the best practices and previous knowledge. The approach will revolutionize disease detection, facilitate evidence-based decision making, and strengthen food security across the globe. The current work extends Routis et al. [24], which applies TensorFlow Lite to speed up machine-learning boosters, like CNNs. The authors use tailored CNN models to detect plant diseases and test them using the tools described above. Patidar and Chakravorty [25] increased the sophistication of food processing through Algerian methods of sorting fruits to increase the sustainability of agriculture in the region. The model is scalable and portable to the advantage of both the small-scale farm and the large-scale agricultural enterprises. Lastly, Khandalwel et al. [26] cited an excellent accuracy of 99.83%. These findings demonstrate how machine learning models may be used to detect mango leaf diseases early and with high accuracy. magnitude-based pruning was used by Dhiman et al. [27], and in the second phase, magnitude-based pruning with post-quantization was used. The suggested Convolutional Neural Network–Long Short-Term Memory (CNN-LSTM) model outperformed the current CNN technique, achieving an accuracy of 97.18% with magnitude-based pruning and 98.25% with magnitude-based pruning with post-quantization. A total of 18 cutting-edge classification methods are applied to the PlantDoc dataset to examine the diseases on the leaves as described by Balafas et al. [28] and determine whether a leaf is infected. High object detection accuracy is attained by You Only Look Once Version 5 (YOLOv5) (Ultralytics LLC, New York, NY, USA), according to computational results. Using a real-world numerical dataset and the maize leaf diseases dataset, Rashid et al. [29] classified corn leaf diseases with an astounding 99.23% accuracy rate. In precision agriculture, Multi-Modal Fusion Network (MMF-Net) provides a clever and promising way to detect plant leaf diseases. Obtained from both environments, they have been compared and examined [30]. This study shows how machine learning and the IoT may be used in agriculture in real time. In conclusion, previous research shows how IoT sensors and machine learning can be used to identify and treat problems of fruit leaf plants. Early intervention is made easier by these technologies’ accurate disease identification and efficient real-time monitoring.
The most plausible way of improving the management of the strength of plants and optimizing the chances of managing diseases is to combine the methods of advanced machine learning with the information gathered through the IoT sensors. This paper explores the role that machine learning models can play in assisting predictive analysis of the behavior of IoT devices in highly interconnected environments. The introduction of a variety of machine learning models helps the study to increase the accuracy of forecasting behaviors, accelerate anomaly detection, which leads to greater stability and security of the IoT environment as a whole. The study highlights the importance of including smart, data-driven approaches to IoT networks to aid in making more informed decisions, facilitating improved device functioning, and ensuring robust operation of the systems [31].
The article compares some of the most popular machine learning algorithms, such as Random Forest, k-nearest neighbors (k-NN), and support vector machine to predict customer churn in the telecommunications industry. Using a six-step workflow, including data preprocessing, feature analysis and selection, train-test splitting, hyperparameter optimization with cross-validation, and performance evaluation with confusion matrices and AUC, the study shows that these ML models are allowed to reach strong predictive performance (more than 79 accuracies). Interestingly, the ensemble methodology is the most successful when SVM is integrated with the bagging method (AUC of about 84), which means that machine learning may be successfully used to predict the risk of churn as well as help the organization engage in proactive customer-centric approaches to the matter [32].
The current study presents a fully automated model based upon the U-Net CNN in the context of the cardiac magnetic resonance imaging (MRI) segmentation, that is, segmentation of cardiac ventricles and myocardium. The next step is feature extraction followed by classification by the ensemble machine learning process, that is, Random Forest and multilayer perceptron. To demonstrate that machine learning classifiers and deep learning-based segmentation can certainly automate the process of diagnostic procedures based on MRI, the authors report test accuracies of 90%–92% in disease classification on automated cardiac diagnosis challenge dataset [33].
The core concern of this work, namely the analysis of medical images, and cardiac MRI especially, is, nevertheless, applicable to the detection of plant disease. The algorithm uses image segmentation using deep learning to isolate regions of interest, obtains salient features in these regions, and uses machine learning classifiers to recognize pathological features in the image as a pipeline analogous to leaf- or crop-image-based pathological condition diagnostics. As a result, image preprocessing and segmentation, feature extraction, and classification by machine learning or deep learning on a second set of objects can be conceptually transferred to plant foliage or crops, and the diagnosis of plant diseases using the basic methodology can be applied. [33].
In recent developments, transformer-based architectures and multispectral imaging have led to an improved performance of a plant disease detector. Kurniywan et al. [34] suggested a multispectral deep learning system for Empoasca pest attack detection in tea plantations, and spectral band analysis was found to be better in discriminating the pest-affected areas than RGB-only imaging. Their article emphasizes the role of spectral sensitivity in early stress diagnosis in agriculture.
Shunmugam et al. [35] proposed a Novel Pyramidal Bidirectional Gated ViT, which is used to detect rice leaf disease, using hierarchical multi-scale feature extraction and gated attention mechanisms. The design was transformer-based; it enhanced contextual modeling of the disease propagation in leaf surfaces.
Shunmugam et al. [36] also initiated Improved Efficient Channel Attention Mechanism-assisted Feature Pyramidal Network-based YOLO (IMpc-PyrYOLO) in another piece of work, which is a hybrid of YOLO-based pyramidal feature network pest detection in rice leaves. The model, coupled with feature pyramid networks and object detection heads, led to better localization of pest regions in field conditions.
Although they prove to be effective with multispectral imaging, transformer architectures, and pyramidal deep models, they use image-based inputs as the main ones. Conversely, the current paper combines spectral-thermal sensing using IoT with adaptive thresholding and hybrid transformer-CNN modeling that allows classifying and supporting multimodal disease, and minimizing the impact instead of detecting an image.
Early and proper identification of the diseases in plant leaves is necessary in sustainable agriculture, protection of yields, and minimization of overuse of pesticides. Fruits like avocado are very susceptible to fungal and vascular infections such as anthracnose and Verticillium wilt that have visual similarity at the initial stages. The conventional manual inspection processes are too tedious, subjective, and in most cases, they cannot identify the early signs of diseases, thus leading to late intervention and wastage of crops.
In recent years, artificial intelligence and smart sensing technologies have developed to allow the automated identification of plant disease in an image-based deep learning model and IoT sensor network. CNNs and ViTs have already shown themselves to be very effective at classifying plant pathology images, and IoT sensors allow studying the changes in the environment and physiological values of temperature, humidity, soil moisture, and spectral reflectance continuously. Nevertheless, the existing systems are mainly focused on either image-based models or sensor-based monitoring, and there is not much integration of multimodal sensing and adaptive preprocessing specific to the disease regions.
The other weakness associated with current methods is the lack of disease-specific image enhancement and cross-modal spectral and thermal signals fusion. The manifestation of the disease at an early stage is often represented by subtle changes in texture, color, and temperature that are not well represented by the global preprocessing filters or single-modality models. This poses a requirement of region-aware adaptive filtering and multimodal fusion approaches, along with deep robust architectures that can learn local lesion appearances and global structural settings.
To overcome these shortcomings, this paper will offer an integrated IoT-AI system comprising of region-specific adaptive filtering (RSAF), hybrid spectral-thermal sensor fusion with adaptive thresholding (HSTSF-AT), and a hybrid vision transformer—CNN (HVT-CNN) network to classify and predict avocado leaf disease across multiple classes and support mitigation measures. The system conducts multimodal disease identification and severity estimation as well as threshold-based mitigation warning.
The key contributions of this work are a region-adaptive preprocessing pipeline, a spectral-thermal fusion optimized, hybrid deep architecture, and reproducible experimental validation of the work on a controlled protocol.
III. Proposed Methodology
The IoT-based sensors and machine-learning methods help detect and control the diseases of the plants on the leaves of the fruits. RSAF aids in this process by making incredible changes in the resolution, and thereby focusing on the pertinent information and suppressing noise, which increases the accuracy of the detected disease. Similar to RSAF, HSTSF-AT evaluates temperature and other attributes on leaves, which allows early stage diagnostic functionality and offers a complex evaluation of the tree’s structural health needed to intervene in time. These materials are fed into the HVT CNN model, and both the local and the global features are used to detect the presence of diseases like anthracnose and Verticillium wilt. The university authors claim that with the combined use of these methods, more effective issue detection and disease control become possible, which in turn leads to the preservation of healthy crops and their higher production. This helps in keeping crops healthy as well as improving yields.
The block diagram of the proposed system is shown in Figure 1. The system identifies and maintains the disease of fruit leaves by implementing IoT sensors and machine-based methodologies that are rooted in machine learning. IoT sensors capture real-time information related to the health of the plant, the environment, and the signs of disease. This information is pre-calculated with photographic images of leaf plant leaves, thus enabling one to view symptomatology as discoloration, lesions, and wilting. RSAF eliminates the disadvantages and enhances the relevant traits. HSTSF-AT permits diagnosing diseases early by only observing slight changes in temperature and spectral. An example is the analysis of resultant data using machine-learning algorithms, such as the HVT-CNN model, to accurately detect diseases based on pathological features that can be seen. On sensing, quick mitigation measures are implemented to reduce crop losses, enhance the well-being of plants, and raise production.
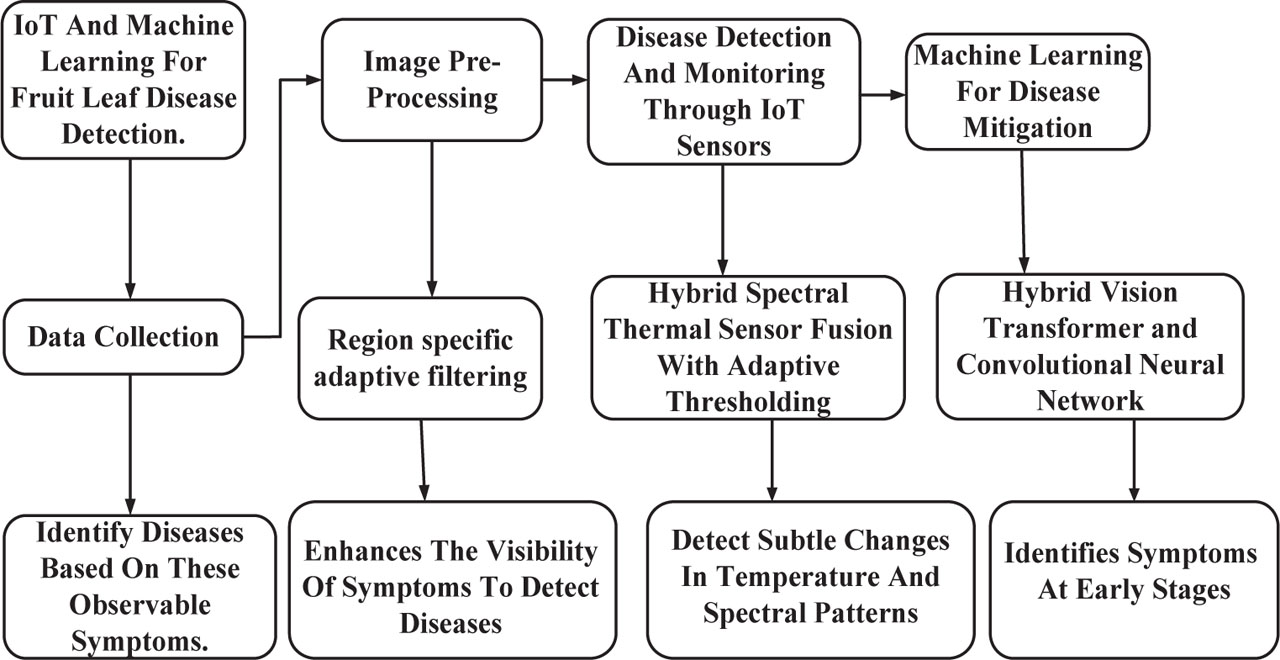
Figure 1:
Block diagram of the proposed work.
The suggested framework classifies plant leaf diseases into multiple classes with multi-modal input of leaf images and IoT sensor measurements. Given an input image I and sensor vector S, the model is a prediction of a disease class label. y ∈ {healthy, anthracnose, verticillium} where y is an element in healthy, anthracnose, verticillium, and a confidence score and a severity index based on fused spectral-thermal deviation.
The system has the following output:
Predicted disease class.
The probability of classification confidence.
Sensor deviation fused severity score.
Conditional mitigation recommendation.
With this formulation, it is possible to detect as well as support decision making.
a. Data collection
An example of data acquisition used in machine-learning-based plant disease diagnosis is the use of IoT sensors, such as hyperspectral sensors, which detect changes in chromatics and moisture content of plant tissue and electrochemical sensors detecting changes in chemical concentrations in plant tissue. The environmental variables are also monitored, which include the soil moisture, humidity, and ambient temperature. Examples of critical indicators include observable symptoms; chlorosis, lesions, wilting, and leaf discoloration. Using these observable signs, the avocado leaf disease dataset aids training of models to recognize diseases such as Verticillium wilt and anthracnose.
The experimental image database is composed of 2,400 avocado leaf images that were taken in field and semi-controlled conditions. The dataset contains three classes, which include Healthy (800), Anthracnose (800), and Verticillium Wilt (800). The high-resolution RGB cameras were used to capture images of different resolutions of 1,024 × 1,024 to 2,048 × 2,048 pixels at various mixed lighting conditions. The data collection was conducted in 4 months’ time in various farm sites. Images were taken at various times of the day and at different humidity and temperature conditions to minimize bias. Training was done on class balancing with stratified sampling.
Data partitioning of datasets was based on the plant-wise stratified split to guarantee sound performance and the avoidance of data leaks. The same physical plant only got images in one subset so as to prevent cross-contamination of training and testing data.
The data was separated in the following way: 70% for training, 15% for validation, and 15% for testing. A five-fold cross-validation was also carried out to check the robustness of the models and also to make sure there was consistency in the models when they were used in various partitions. The performance measures used in this research are the average performance reports on validation folds.
The process of predicting plant diseases, the use of different IoT sensors to monitor essential parameters, for example, color changes, moisture, stress, and environmental factors are shown in Table 1. The hyperspectral sensors capture color changes located in RGB values (Red: 0–255, Green: 0–255, Blue: 0–255), moisture content (0–100 25 to 100 being 25% moisture), and stress levels in plants (e.g., 0–100, stress, 0–45 moderate stress). Electrochemical sensors monitor the chemical properties of plant tissues, such as pH and chlorophyll concentration, while environmental sensors measure ambient temperature, humidity, and soil moisture. These measurements provide complementary information for accurate disease detection and continuous monitoring of plant health. The environmental sensors monitor temperature in the air (10–40°C, e.g., 25°C; which is optimal), moisture in the environment (30%–80%, with 50% as the ideal range), and moisture in the soil (0%–100%, e.g., 30%; this is the optimal range). The signs of the plant, leaf discoloration (RGB values Red: 160, Green: 120, Blue: 100), wilting (0100% e.g., 40,100% wilting), lesions (0100 mm2 with lesions of 25 mm2 representing a moderate size), and chlorosis (e.g., Red: 150, Green: 180, Blue: 120) are also a critical indicator of plant health. This information, which is gathered with a variety of sensors, helps to train the machine-learning models to identify diseases like anthracnose and Verticillium wilt.
Table 1:
Data collection for plant disease prediction using IoT sensors
| Sensor type | Measurement type | Numerical value (range/example) |
|---|---|---|
| Hyperspectral sensors | Color variations (RGB values) | Red: 0–255, Green: 0–255, Blue: 0–255 |
| Moisture levels | 0%–100% (e.g., 25% indicates moderate moisture) | |
| Plant stress levels | 0–100 (e.g., 45 indicates moderate stress) | |
| Electrochemical sensors | pH levels | 4–9 (e.g., 6.2 for healthy, 4.5 for stressed plants) |
| Chemical composition (e.g., Chlorophyll) | 0–100 µg/g (e.g., 35 µg/g indicates healthy leaves) | |
| Environmental sensors | Ambient temperature (°C) | 10–40 (e.g., 25°C for typical growing conditions) |
| Humidity (%) | 30–80 (e.g., 50% for ideal conditions) | |
| Soil moisture (%) | 0–100 (e.g., 30% for well-watered soil) | |
| Symptoms observed (leaf) | Leaf discoloration (RGB value) | Red: 160, Green: 120, Blue: 100 (e.g., early anthracnose) |
| Wilting (percentage of leaf area affected) | 0%–100% (e.g., 40% for early-stage wilting) | |
| Lesions (size in mm2) | 0–100 mm2 (e.g., 25 mm2 for moderate lesion size) | |
| Chlorosis (leaf color change from green) | RGB values, e.g., Red: 150, Green: 180, Blue: 120 for chlorosis |
Figure 2 shows various symptoms of the diseases of the Persea americana cv. Avocado leaf in addition to the examples of the common diseases, includes Verticillium wilt and anthracnose. The wilting chlorosis and discoloration of leaves, among other signs of stress and disease, are features of plants in the illustration that indicate the progression and economic effects of disease and thus identify plant stress and disease lesions. The regularity with which these symptoms occur makes them crucial indicators of diagnosis that can be deserving of agronomic management, especially during early detection (making the outcome expectations better). As it is indicated in the third figure, there is an urgent need to observe such apparent changes of vegetative state and activate the responsive measures—the selective use of pesticides and changes in the nature of the environment—to reduce the losses of crops and improve the total productivity. Since it is possible to automatically identify such morphological indicators with advanced imaging techniques and machine-learning algorithms, it could help improve the accuracy of the diagnosis and encourage more advanced, evidence-based agricultural practices. The two diseases that typically affect avocado plants, Anthracnose and Verticillium wilt, have their own set of sub-symptoms that make them identifiable.
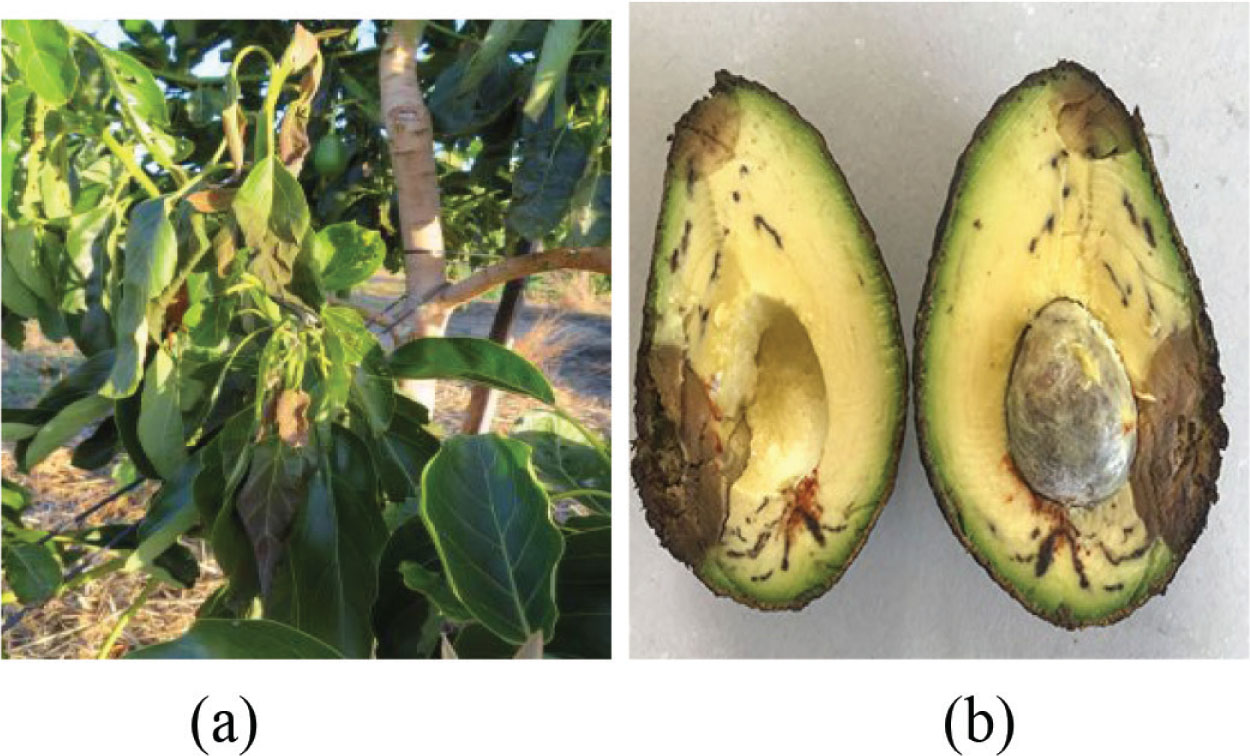
Figure 2:
Avocado fruit leaf disease. (A) Avocado plant showing symptoms of Verticillium wilt, including leaf wilting and chlorosis; (B) Avocado fruit infected with anthracnose showing dark necrotic lesions and tissue decay.
a.i. Anthracnose (Colletotrichum gloeosporioides)
Avocado leaves that are infected usually show dark spots. These spots can be brown or black. They often begin at the leaf edges and spread toward the middle. Sometimes, you might see a yellow ring around them.
As the disease gets worse, the leaves start to wilt. They may lose their firmness, curl up, or droop.
Anthracnose can cause wet spots on leaves. These spots can become dark and sink. They often show up when it’s humid. They’re usually not round and can combine into more significant areas that get affected.
The affected leaf parts might turn yellow, especially near the spots. This happens because the plant is stressed from the fungal infection.
a.ii. Verticillium wilt (Verticillium dahliae)
Verticillium wilt causes the leaves to turn uniform yellow but starts mainly at the margins and then proceeds to the central parts of the leaves. The tissue attacked by the disease might die eventually (necrosis).
Sometimes, leaves can get depressed even without water stress. The wilting is typically linked to the leaf edges falling or the leaves rolling up.
One of the significant signs is the existence of vascular discoloration, viewable whenever the stem or the vascular tissue is cut. The tissues may reveal a darkening brown, indicating that the fungus has spread through the plant’s vascular system.
In more severe cases, Verticillium wilt can cause premature leaf drop, as the plant struggles to transport nutrients and water due to blocked vascular tissues.
Infected plants often show reduced growth, with leaves becoming smaller and branches appearing stunted, as the disease impairs the plant’s overall function.
The similarity of the two diseases lies in the presence of similar symptoms of the diseases such as wilting and chlorosis. However, the different characteristics that distinguish between the two etiologies include the presence of characteristic lesions of anthracnose and the vascular discoloration of Verticillium wilt. The timely interventions will require the identification of these symptoms in the early stages, which is essentially achieved with the help of sophisticated imaging methods and machine-learning algorithms, preventing the massive destruction of avocadoes.
b. Image pre-processing
Image pre-processing also contributes greatly to the detection of the disease by increasing the quality of raw images of the plant in a health monitoring process. The technique used is the RSAF which is used to outline some parts of an image thus highlighting the symptoms of plant disease; anthracnose and Verticillium wilt are some of the most frequent diseases to be visualized. The working concept of RSAF is the use of adaptive filters to identify regions with discoloration, lesions, and wilting, which are the main discriminative features and are also able to remove background noise. This biased sharpening produces a representation that is highly divergent to a original image making disease indicators more visible and therefore simple to detect; thus, this enhances the disease detection rates. Letting go of superfluous data of the feature set, RSAF helps to shape the machine-learning models improving detection quality and facilitating early intervention. When used in high-resolution imagery, the system is able to prescribe specific treatment or monitoring plans, which subsequently reduce the spread of disease, manage the crop optimally and eventually reduce harvest. This technique ensures the health of the whole crop, making disease management in agriculture timely and very effective.
RSAF is a highly advanced image processing method used to raise the quality of raw images to pinpoint plant diseases such as anthracnose and Verticillium wilt in crops such as avocados. RSAF employs a region-specific technique by applying the filter here and there, which is based on the location of a particular spot on the image, leading to quality deterioration. This can mean that other symptoms are present in the plants, such as discoloration, injured tissue, or wilting. Further, the fact that adaptive filters are used so that cluster centroids and the spatial structure that can be captured are jointly mined forms the usage of an adaptive filter within a given region.
In RSAF, let I(x,y) represent the real pixel intensity at the position (x,y) in the image. The goal is to improve the exact regions containing disease symptoms while suppressing unrelated background noise. The filtering process can be described by a convolution operation, given by:
Where I(x,y) is the filtered image, w(i,j) Is the adaptive filter kernel, and the sum runs over the neighborhood of pixel (x,y). The kernel size is determined by the region’s characteristics, where k defines the scope of the neighborhood around (x,y).
To certify that the filter adapts to the local characteristics of each region, the filter weights w(i,j) are adjusted based on the local image features such as contrast or texture. One way to adapt the filter is by using the local variance of pixel strengths in a sliding window. The local variance σ2 (x,y) around a pixel can be calculated as:
Where μ(x,y) is the local mean intensity of the region, and N is the number of pixels in the neighborhood. This variance σ2 (x,y) determines how the filter is practical in that region. A developed variance indicates more excellent contrast or texture, corresponding to disease symptoms.
The filter weights are then inversely proportional to the variance, ensuring that regions with higher contrast (likely indicating disease symptoms) are enhanced:
Where ∈ is a small constant to avoid division by zero. This adaptive weighting emphasizes essential features, such as lesions or discoloration, and minimizes the impact of less relevant areas.
RSAF can also include multi-scale information to detect fine and coarse disease symptoms. The image is processed at multiple scales, where each corresponds to altered resolution levels. The filtered image at a given scale s, denoted Is (x,y), is obtained by relating the adaptive filtering process to the image at that scale. The final output image is a weighted combination of the filtered results from all scales:
where αs is a weight factor that controls the importance of each scale in the final result.Integrating the modified edge detection filter into RSAF often enhances edge enhancement. This is necessary to detect the boundaries of lesions or wilting areas. A prevalent method for edge detection is the Sobel operator, which is a reasonable estimation of the intensity of the image gradient:
Where Sx (i,j) and Sy (i,j) are the Sobel kernels in the x and y directions, respectively. The magnitude of the gradient G(x,y) is then computed as:
Enhancement of edges must be where the gradient is immense, meaning the presence of disease symptoms (lesions) in the image. In RSAF, the multi-scale approach can also be generalized using a Gaussian pyramid, which downsamples and gradually smoothens the image. Multiple images that are versions of the original image downsampled to various resolutions can be processed to capture the fine and coarse details. This study formulates the multi-scale process as:
Where Gs is the Gaussian kernel at scale s, and * denotes the convolution operation. The quality of the raw images is enhanced by adaptive filtering, processing in different scales, and detecting edges, which assists in the correct and efficient detection of plant diseases (RSAF). This improves agricultural productivity and sustainability by better managing and protecting crops.
c. Disease detection and monitoring through IoT sensors
The IoT sensors collect data on the critical environmental and plant health indicators, such as temperature, humidity, soil moisture, and foliage state. To handle such amount of data production, the current paper suggests new methods of data analysis, in particular HSTSF-AT that enable exploration of spectral and thermal changes of surface in plants. The HSTSF-AT is conditioned on the slight temperature and spectral variations, which are symptoms of diseases, including anthracnose and Verticillium wilt in avocado trees. Although the traditional methods might face some challenges in identifying such small changes, they are essential in diagnosis of the disease at the early stage. Coupling spectral and thermal data, HSTSF-AT permits detecting the early stages of biotic or abiotic stress, which enables providing an immediate site-specific response in response to it. The response can be strategic application of pesticides, environmental modifications, which eventually curbs the spread of the disease and minimum damage to crops and hence, enhances the agricultural production and harvest management systems.
Figure 3 depicts the farm field and a range of various sensors are used to detect the health and condition of crop, one of them being avocado foliage. Images of the leaves are captured by camera sensors in order to identify potential disease occurrences early such as anthracnose or Verticillium wilt. The moisture level in the soil is measured by the soil-moisture sensor and the acidity of the soil is measured by the pH sensors and they are considered to be key nutrients enabling the plants to grow optimally. The temperature and humidity sensors measure environmental variables of effects to the health of plants. This information is analyzed on the spot and at the site where it is then sent to the cloud. This is followed by the disease classification models which use complicated algorithms to traverse the sensor input and detect the possible health problems. Researchers then give suggestions, including application of specific pesticides or environmental changes to control the disease and maximize plant growth to yield better and more productive crops.
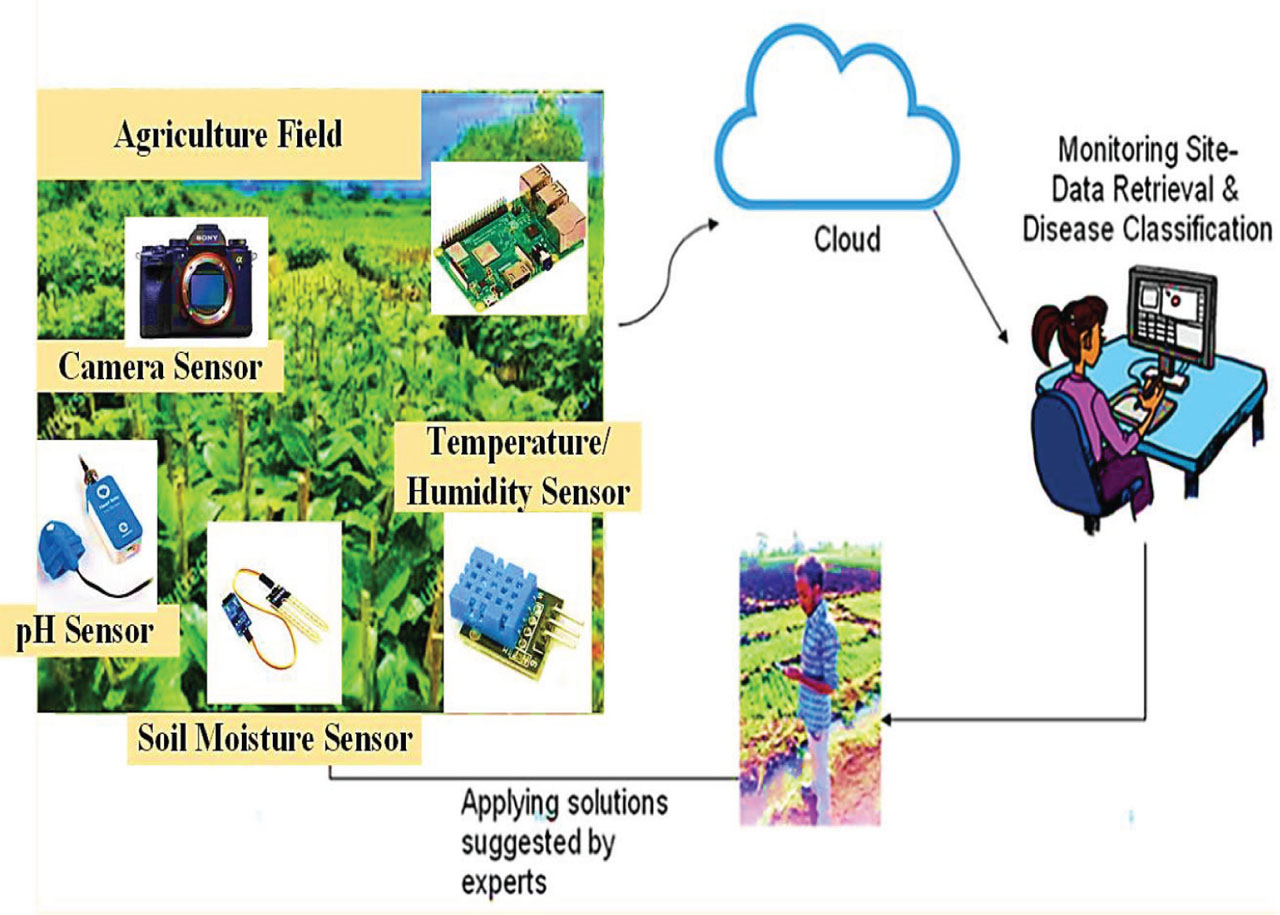
Figure 3:
IoT-enabled smart agriculture for disease detection and crop management. IoT, Internet-of-Things.
HSTSF-AT is one of the sophisticated techniques that are used in agricultural IoT analytics. It is applied in data collection and data analysis, thus, improving service provision, especially in the identification of the health and disease status of agricultural products (e.g., avocados infected with Anthracnose and Verticillium wilt). HSTSF-AT stands out by its new application of data fusion at spectral dimensions, or the ability to capture both light reflectance in the plant tissues at different wavelengths and thermal dimensions, or the ability to capture temperature differences across the outer surface of the plant. As a result, it give a more detailed description of the organism and earlier stages of stress or disease occurrences in the analyzed plant in a more advanced level.
Spectral data. The spectral data are obtained and form the starting point of the analytical process, as it is measured by hyperspectral sensors that include the reflectance of the plant over a large range of wavelengths.
Spectral reflectance R(λ) This can be mathematically expressed as:
Where I(λ) is the intensity of light reproduced at an exact wavelength λ, and I0 (λ) is the intensity of established light at the same wavelength. The spectral data often highlights subtle variations in the plant’s biochemical composition, such as chlorophyll levels, which are affected by diseases like anthracnose. For example, the reflectance of avocado leaves in the near-infrared region. R(λ_NIR) decreases when the plant is stressed or diseased.
Here, ∈ is the emissivity of the plant’s surface, σ is the Stefan–Boltzmann constant, Ts is the surface temperature and Ta is the ambient temperature. Thermal devices are crucial for noticing temperature anomalies, which can indicate physiological changes in the plant due to infection.
HSTSF-AT combines these spectral and thermal measurements to recover the accuracy of initial disease detection. The fusion algorithm works by first normalizing both datasets so that the spectral reflectance and thermal temperature data can be compared on the same scale. One approach to fusion is to calculate the weighted average of the spectral and thermal features at each spatial coordinate. (x,y), given by:
Where w1 and w2 are the weights allocated to the spectral and thermal data, respectively. These weights depend on the sensitivity of each type of data to specific plant conditions, and they may vary depending on the disease being studied.
The next crucial step in HSTSF-AT is the AT algorithm, which is used to notice abnormal conditions indicating disease. The thresholding process includes dynamically setting thresholds for the fusion results based on the variability of the data. This can be modeled as:
Where μF and αF represent the mean and standard deviation (standard deviation) of the fused feature data F(x,y) over a time window, and α is a constant factor that adjusts the sensitivity of the thresholding. This adaptive threshold allows the system to adjust to the natural changes in the health of the plant with time, where only serious medical changes as a possible symptom of illness, will lead to an alarm. The study is a huge addition to the theoretical angles of agricultural research and management of pests. At the same time, we implement a new technology, HSTSF-AT, to the early identification of various aberrations in plant diseases, which is why we can provide an opportunity to predict the outbreak of diseases in advance. Early detection of the disease is required to reduce losses on crops and improve sustainability in agricultural practices. The interventions can therefore be targeted, for example, by pesticide distribution or adjustment of the environmental conditions in the locales, to contain diseases such as anthracnose and Verticillium wilt. One of the main others should be to create a monitoring system that outsmarts the approved models and, therefore, leads to a more sophisticated process of farming practice. In this light, one important point is data itself.
Table 2 describes the algorithm HSTSF-AT, which mainly works by satellite-based spectral and thermal data collection through sensors monitoring plant health. Afterward, the data is pre-processed to eliminate noise and perform quality assurance. Individual comparisons are made for the two datasets that have undergone normalization processes. It involves the fusion of spectral and thermal data to a weighted average; the weights assigned are based on their sensitivity to plant conditions. Adopt adaptive thresholding, which requires a mean and standard deviation of the fused data to define dynamic thresholds based on these statistical measures. In comparing the fused data with these thresholds, any anomaly that appears implies the possibility of plant diseases. An alarm is raised if it goes beyond the thresholds, which alerts the farmers about the impending problems. This will make the farmers to initiate prompt actions that will help control the diseases (they have dealt with this issue earlier and ensured agricultural productivity and sustainability).
Table 2:
HSTSF-AT
| Algorithm 1: HSTSF-AT |
|---|
| Collect Data: Sensors are used to acquire spectral and thermal data. |
| Preprocess Data: To clear up the datasets and clear out noise. |
| Normalize Data: Normalize spectral and thermal on a standard scale to compare data. |
| Fuse Data: Index and interpolation are statistical techniques to combine datasets. |
| Assign Weights: If it is not too sensitive to plant conditions, you give less and moderate weights when the data is perfect. |
| Set Thresholding: Basic statistics can tell you where the curve is centered and how broad it may be. |
| Set Dynamic Thresholds: The peaks can be found by looking past noise, using modestly filtered data derivative. |
| Detect Disease: Review the fused signal against the go-to. |
| Knowledge Representation: For security module implementation, it should be created as you venture into something new (for example, this one). |
| Generate Alerts: If the data exceeds thresholds, note the disease in a letter. |
| Take Action: Provide timely notice to help farmers better control disease. |
The fusion weights w1 and w2 values in Eq. (11) were not chosen at random. A sensitivity analysis based on validation was performed to achieve maximum spectral-thermal aspects integration. The weights were perturbed systematically within the range. w1 ∈[0.1,0.9] and w2 = 1 − w1 and validation accuracy and F1-score were used as the indicators of model performance.
The grid search optimization was used to determine the optimum configuration, which was the weight combination maximizing the validation performance.
The findings suggest that the relatively better performance of disease discrimination by spectral reflectance features is caused by the fact that the chlorophyll degradation and lesion reflectance differences are a strong early warning signal of plant stress. All of the experiments were done with the chosen weight combination (0.6 spectral, 0.4 thermal) as shown in Table 3.
d. Machine learning for disease mitigation
The principle of the HTI SF-AT algorithm is based on the fact that the spectral and thermal measurements of the plants are collected with the help of satellites and sensors mounted on the satellites that monitor the physiological conditions of the plants. The obtained information is sent through a preprocessing pipeline, denoising, and a strictly determined quality-assurance process. Thereafter, the spectral and thermal data are sequentially equalized and integrated with the help of a weighted averaging scheme, in which the weights are determined according to how sensitive each modality is to agronomic factors. Adaptive thresholding is used on the fused data, which uses the mean and standard deviation of the fused signal to come up with a dynamic threshold. The processed fused signal within the threshold ranges, but exceeding these thresholds are construed as a possible indicator of plant disease, and an alarm is raised to notify growers of what to expect. This alarm system allows the location of the disease at an early detection, hence preventing the spread of the disease and contributing to the continuing productivity and sustainability of farms.
i. HVT-CNN: HVT-CNN architecture is better performing by combining the advantages of the ViTs and CNNs to select plants and identify the diseases. It exploits the capabilities of CNNs in fine-grained feature extraction and uses ViTs to extract contextual background information; it is a dual-layered approach, which is efficient to consider the plant pathology issue. The small size allows the local (micro-changes of texture and discoloration) and global (wholesome plant structure) data to be obtained at the same time to allow quick and precise detection of the disease. The CNNs are good at extracting local features, including edges, shapes, and textures, using convolutional operations on patches of images.
Mathematically, a convolution operation can be described as:
Here, I is the input image, K is the convolutional kernel, b is the bias, and F(x,y) is the output feature map after applying the convolution filter over the image. The filter K is designed to recognize features such as edges and specific patterns, which are vital for spotting early indicators of diseases such as anthracnose or Verticillium wilt. As the convolutional layers advance, the network identifies more intricate features, capturing the texture and structure key to assessing plant health.
On the other hand, ViTs are designed to model long-range dependencies by treating the image as a sequence of fixed-size patches. The image is split into patches of different sizes. P × P. These patches are then flattened into vectors and passed through a linear projection. The initial patch embedding can be written as:
Where z0 represents the flattened and projected image patches, X is the image, We is the learnable projection matrix, and be is the bias. These covers are then processed through multiple transformer layers, which consist of self-attention mechanisms that help capture relationships across the image. The self-attention operation at each layer can be represented as:
In this equation, Q, K, and V represent the query, key, and value matrices, respectively, and dk is the dimension of the key vector. This mechanism allows each patch to attend to all other patches in the image, taking contextual relationships across the entire image, essential for understanding the broader context of plant disease spread.
The HVT-CNN combines these approaches by utilizing CNNs for local feature extraction and ViTs for global context. One way to achieve this is by passing the output of CNN layers into a transformer architecture, which then captures long-range dependencies. The final architecture could be described as:
where f CNN (I) extracts local features and fViT (I) captures global context. The model is then trained to identify disease symptoms, such as discoloration, wilting, or lesions, by learning the patterns associated with specific diseases. This integration helps the model become more robust to variations in disease expression across different plants and environments. For training, the model uses a loss function such as cross-entropy to optimize the parameters:Where yi represents the actual label and ŷi is the predicted probability for each class. This loss function is minimized using backpropagation, permitting the model to learn optimal feature representations for disease detection.
The suggested HVT-CNN architecture incorporates the use of convolutional layers to extract local texture information and transformer encoder blocks to model local and global contextual information, respectively. The CNN backbone computes hierarchical spatial features, which are then tokenized into fixed-size patches and run through the transformer encoder layers to model long-range dependencies in the leaf structure.
Table 4 shows the configuration used to implement and train the model. Early stopping was applied with respect to validation loss as a means of preventing overfitting to train the model to convergence. Validation-based tuning was used to choose hyperparameters.
Table 4:
HVT-CNN architecture and training hyperparameter configuration
| Parameter | Value |
|---|---|
| CNN layers | 5 |
| Transformer layers | 4 |
| Patch size | 16 × 16 |
| Embedding dimension | 256 |
| Optimizer | Adam |
| Learning rate | 0.0001 |
| Batch size | 32 |
| Epochs | 50 |
| Loss function | Cross-entropy |
Soil classification can be regarded as a system of efficient and integrated processing with global and local characteristics, making it easy to see or track plant diseases. For this, the disease might be diagnosed more quickly than ever before, such as anthracnose and Verticillium wilt, allowing countermeasures to cover only those diseased areas, which might result in a plethora of sound effects or working on the environment of plants.
This system detects unusual behaviors in crops early. If the solution for avocados is brought in time, farmers will change their habits and production methods according to local conditions; then, in turn, authentic land can triumph. The classification of diseased avocado leaves based on a CNN system is fantastic (Figure 4). The procedure begins with imaging the high-definition images from the visible/near-infrared camera or sensor. The CNN model then discovers such features by examining apparent patterns, like discoloration and wilt of a leaf showing disease. On the leaf, there will usually be something else nasty. It is the spatial features that need to be reshaped via convolutional layers. Finally, the features obtained are input to a classifier, which determines whether the leaf has anthracnose or Verticillium wilt—precise and fast detection of diseases. In this system, early intervention is possible, reducing crop damage and improving plant health management.
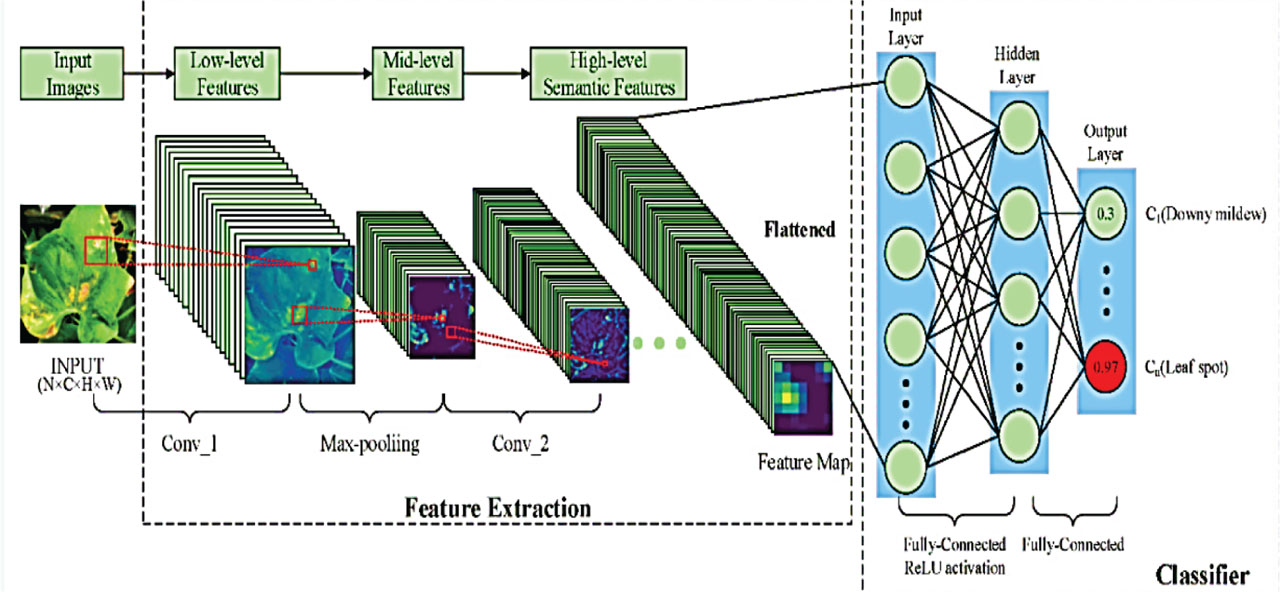
Figure 4:
CNN leaf disease classification. CNN, convolutional neural networks.
IV. Experimentation and Result Discussion
In identifying and preventing fruit leaf plant diseases using IoT and machine learning approaches, IoT sensors and high-resolution plant leaf photographs were used to obtain a complete data set for the testing phase. The pictures gave this data regarding recognizing the disease. At the same time, the IoT gadgets upgraded the world-setting associated info within actual seasons, such as heat, dampness, and even source of nourishment conditions. Subsequently, machine learning techniques were employed to analyze the collected data to classify and detect diseases such as Verticillium wilt and anthracnose. The models were trained and validated using a large dataset and showed high accuracy in recognizing the damaged leaves and differentiating them from the healthy ones. “This led to significantly less crop damage due to the system’s ability to provide real-time alerts and recommendations of targeted interventions, such as application of pesticides and other environmental changes. These results show how well the two technologies—IoT and machine learning—go with each other in detecting sickness in the early stage, helping farmers take measures in time, improve the crop, use fewer chemicals, and ultimately increase the yield of the crops.
The IoT monitoring system will comprise hyperspectral, thermal, soil moisture, humidity, and pH sensors that will be installed in monitored avocado plots. The sensors were placed on the height of the canopy and the depth of root-zone as demanded. The measurements were taken at intervals of 10 min and sent to a cloud computing unit. Table 5 demonstrates IoT sensor deployment configuration.
Table 5:
IoT sensor deployment configuration
| Sensor | Type | Sampling interval | Calibration method |
|---|---|---|---|
| Hyperspectral | Reflectance | 10 min | White reference |
| Thermal | Infrared | 10 min | Blackbody |
| Soil moisture | Probe | 10 min | Soil standard |
| pH | Electrochemical | Hourly | Buffer solution |
As seen in the results shown in Figure 5, the analysis of data from June (with a small population and a high number of omitted features), the integration of RSAF dramatically enhances the performance of the disease detection system. Without RSAF, feature detection reached 70% accuracy, and disease detection only reached 75% from the original data. With the use of RSAF, however, both metrics improved significantly. The feature detection accuracy has reached over 90% when utilizing the RSAF model, verifying its capability to refine the extraction of crucial features from the raw images. The accuracy of disease detection also improved, reaching 92%, reflecting the potential of RSAF for enhancing the search of plant leaf images and the classification of diseases.
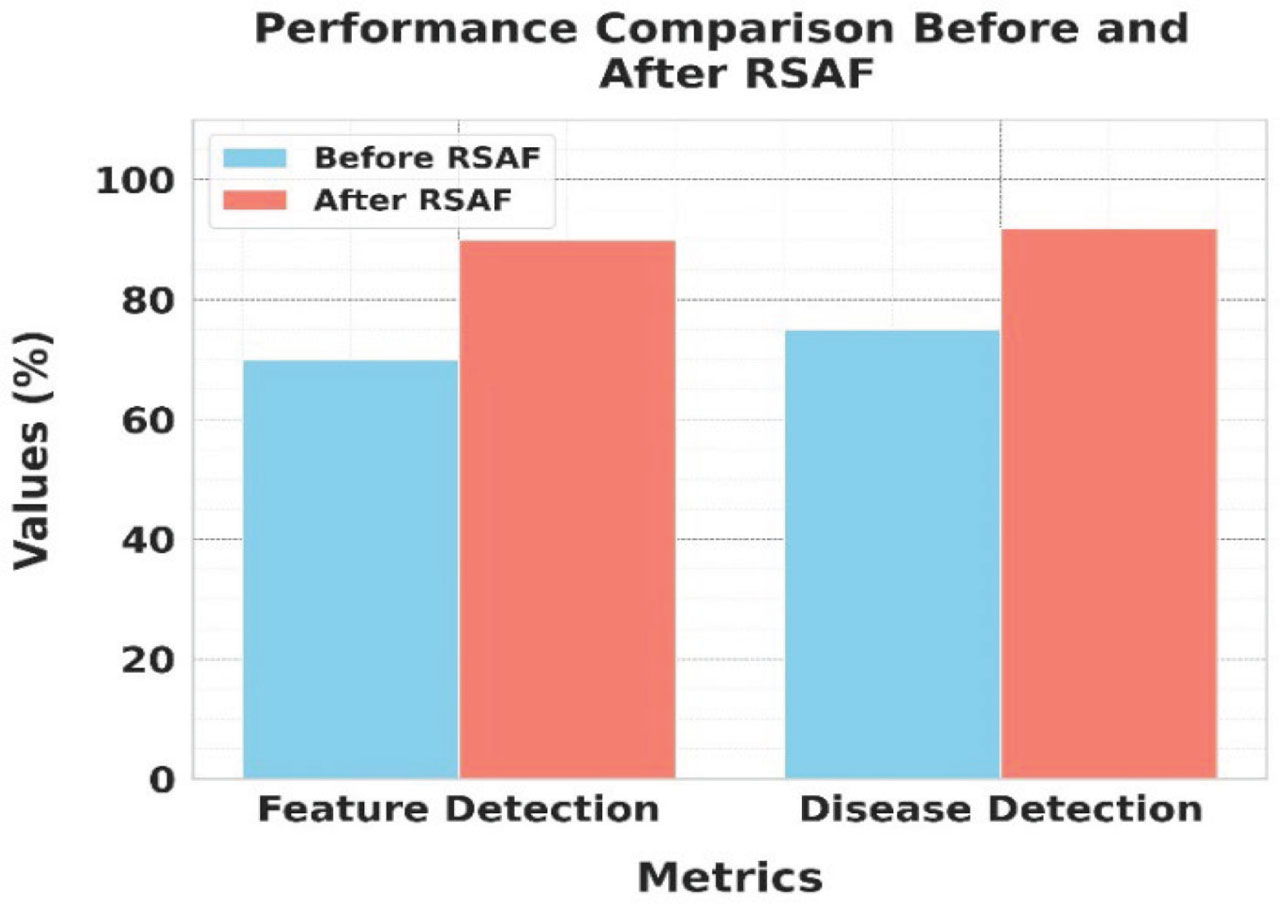
Figure 5:
Impact of RSAF on disease detection accuracy. RSAF, region-specific adaptive filters.
Thus, this study highlights the significance of RSAF in refining machine learning models for enhanced plant disease classification, paving the way for farmers to leverage a robust tool for timely action. RSFA helps ensure proper and accurate decision making by availing the system’s potential to classify diseases accurately, leading to healthier crop management and better farming productivity.
To measure the efficiency of the proposed RSAF quantitatively, a comparative experiment with one of the growingly popular preprocessing methods, such as histogram equalization, contrast limited adaptive histogram equalization (CLAHE), and bilateral filtering was to be carried out. Each preprocessing technique was considered by the same protocol of training and validation.
The findings in Table 6 indicate that RSAF is always superior as compared to the conventional preprocessing methods. This has been improved by the fact that it has a region-adaptive variance-weighting mechanism that only improves disease-relevant regions and suppresses the background noise. The adaptive multi-scale filtering enables better differentiation of boundaries and chlorotic areas of the lesions, which gives enhanced classification results.
Table 6:
Comparative performance of preprocessing methods for avocado leaf disease classification
| Method | Accuracy (%) | F1-score |
|---|---|---|
| Histogram equalization | 84.3 | 0.83 |
| CLAHE | 86.9 | 0.86 |
| Bilateral filter | 87.5 | 0.87 |
| RSAF (proposed) | 92.0 | 0.91 |
Using a confusion matrix, an essential tool for comparing actual and predicted results, age and sex-age standardization are shown in Figure 6. True positive (TP) means you are right when considering that the leaves are healthy. False positive (FP) refers to those healthy leaves that are mislabeled as diseased. False negative (FN) refers to diseased leaves that are judged to be healthy; tTrue negative (TN) refers to healthy leaves, all passed fit for human consumption. We can calculate the accuracy, precision, recall, and F1 score based on the confusion matrix to measure our model’s effectiveness in plant disease identification. We hope to see a model with low FP, FN, and high TP & TN, with minor misclassification on outputs! With the help of the confusion matrix, the system is more reliable and efficient. We can identify where improvements must be made to reduce false positive results or increase detections for certain diseases.
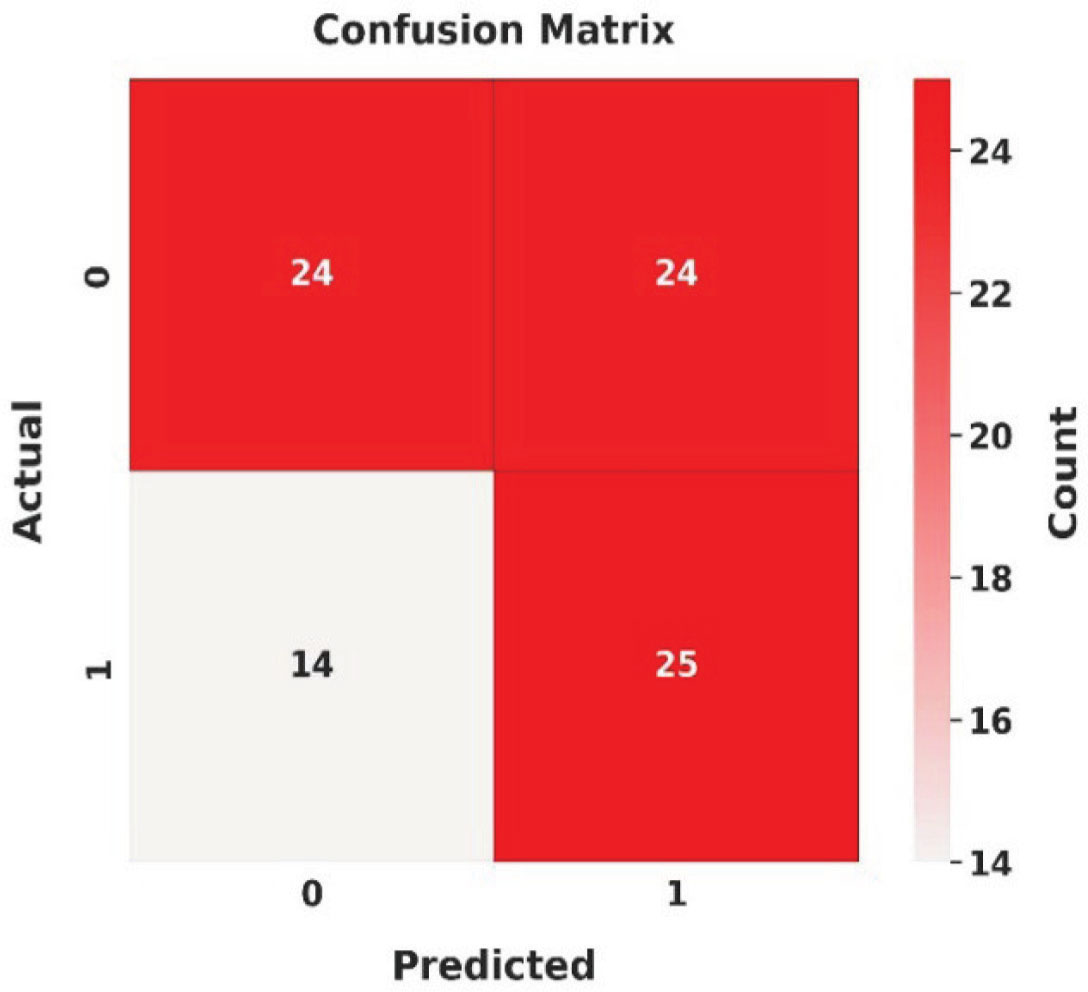
Figure 6:
Confusion matrix for actual and predicted disease detection.
To provide a comprehensive evaluation beyond the overall accuracy, precision, recall, F1-score, and ROC-AUC were computed for each disease class based on the confusion matrix as shown in Table 7.
Table 7:
Per-class performance metrics of the proposed HVT-CNN model
| Class | Precision | Recall | F1-score |
|---|---|---|---|
| Healthy | 0.94 | 0.95 | 0.95 |
| Anthracnose | 0.91 | 0.90 | 0.90 |
| Verticillium | 0.92 | 0.91 | 0.91 |
The macro average ROC-AUC score of the model was 0.95 as shown in Figure 7, indicating strong class separability. These results confirm that the proposed multimodal framework maintains balanced performance across disease categories without bias toward any specific class.
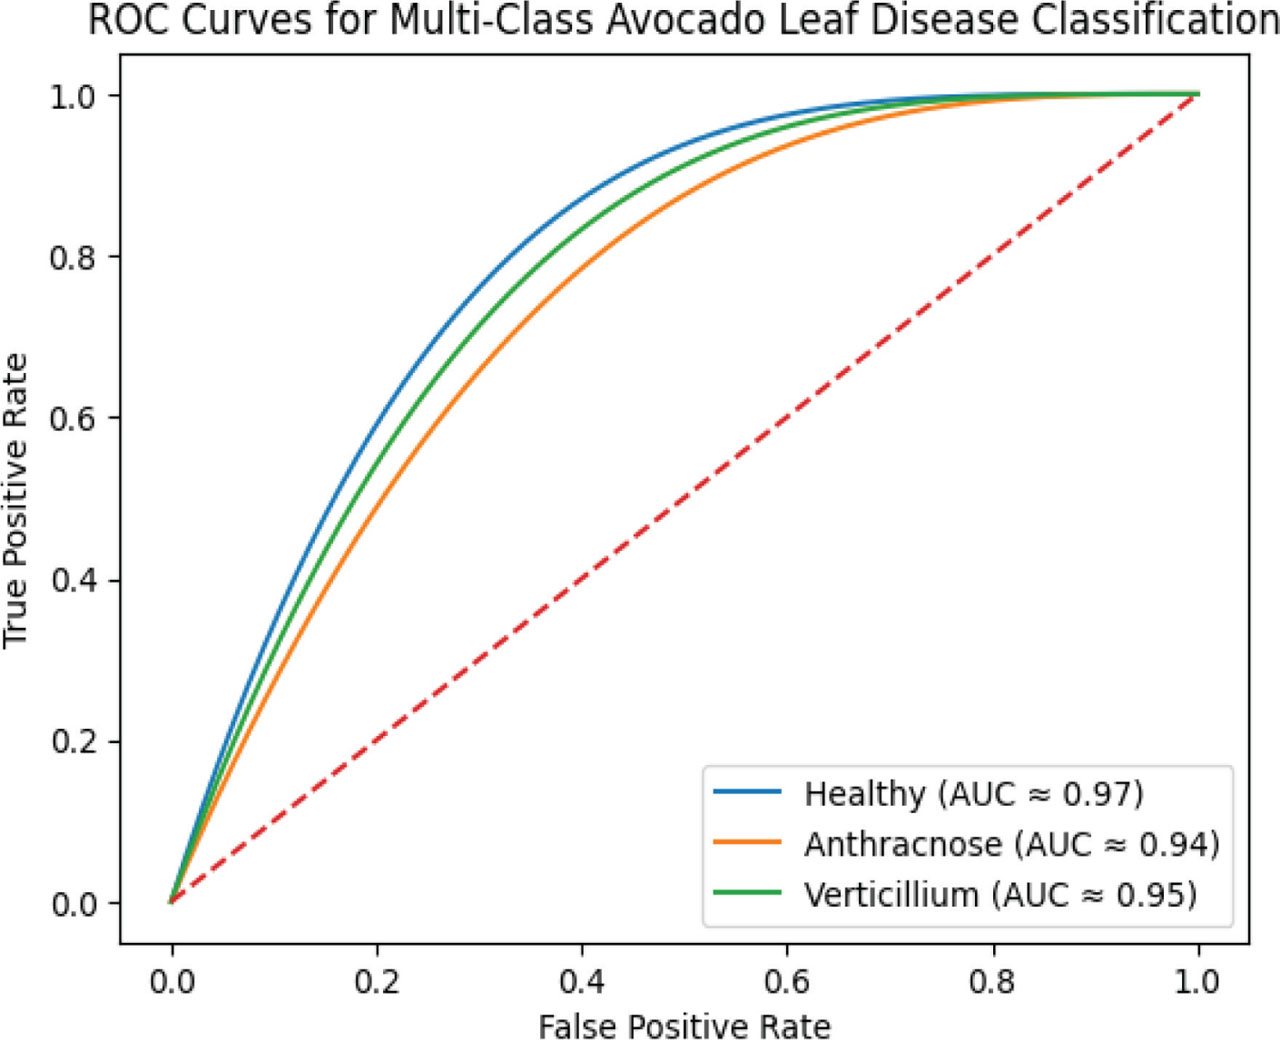
Figure 7:
ROC curves for multi-class avocado leaf disease classification. AUC, area under the curve; ROC, Receiver Operating Characteristic.
a. Error analysis and misclassification patterns
Visualization of the confusion matrix shows that most misclassifications are found between the early stages such as Anthracnose and Verticillium wilt cases. The etiology of this confusion is explained by the fact that the visual symptoms of chlorosis and mild wilting overlap, and at the initial phases of the disease, they show similar patterns of discoloration.
In particular, the small percentage of Anthracnose samples were forecasted as Verticillium wilt, probably because of the similarity of yellowing along the leaf margins and minor lesions. On the other hand, Verticillium cases were misdiagnosed as Anthracnose where vascular discoloration was not illustrated well in surface images.
Healthy samples did not show much confusion with diseased classes which shows that the model is effective at separating healthy tissue and pathological characteristics.
Such results indicate that the improvements in the future could involve:
Integration of the vascular structure imaging.
Other spectral bands such as stimulated biochemical discrimination.
Refinement mechanisms to focus attention on lesion boundaries.
Although there are these minor confusions, in general terms, classification balance is high as indicated by good recall and ROC-AUC values across classes.
Table 8 shows three main environmental parameters that affect the growth of crops, their threshold values, and expected values. The ambient temperature, having an observed value of 25°C (as aforementioned), is critical to control plant processes and rests well within the comfort zone of most crops. The genera that substantially affect transpiration and how common these plants are well below the 50%–70% ideal for humidity levels. In this case, the figure of 65% shows that it is suitable for the plants. Finally, the optimal soil moisture (30%–50%) directly impacts your watering needs and root health. This means that the soil moisture found (45%) is in the allowable range of values for good growth of crops. Such environmental aspects controlled within the ranges must lead to perfect plant-dampening conditions that lead to efficient agriculture techniques and subsequent high crop output. These components must be monitored, so irrigation and climate control systems can be adjusted promptly.
Table 8:
Environmental factors and observed values for crop growth
| Environmental factor | Threshold value | Observed value |
|---|---|---|
| Ambient temperature (°C) | 20–30 | 25 |
| Humidity (%) | 50–70 | 65 |
| Soil moisture (%) | 30–50 | 45 |
Figure 8 shows the assessment of a machine learning model’s performance; several important indicators offer valuable information about how well it works. The model is learning.
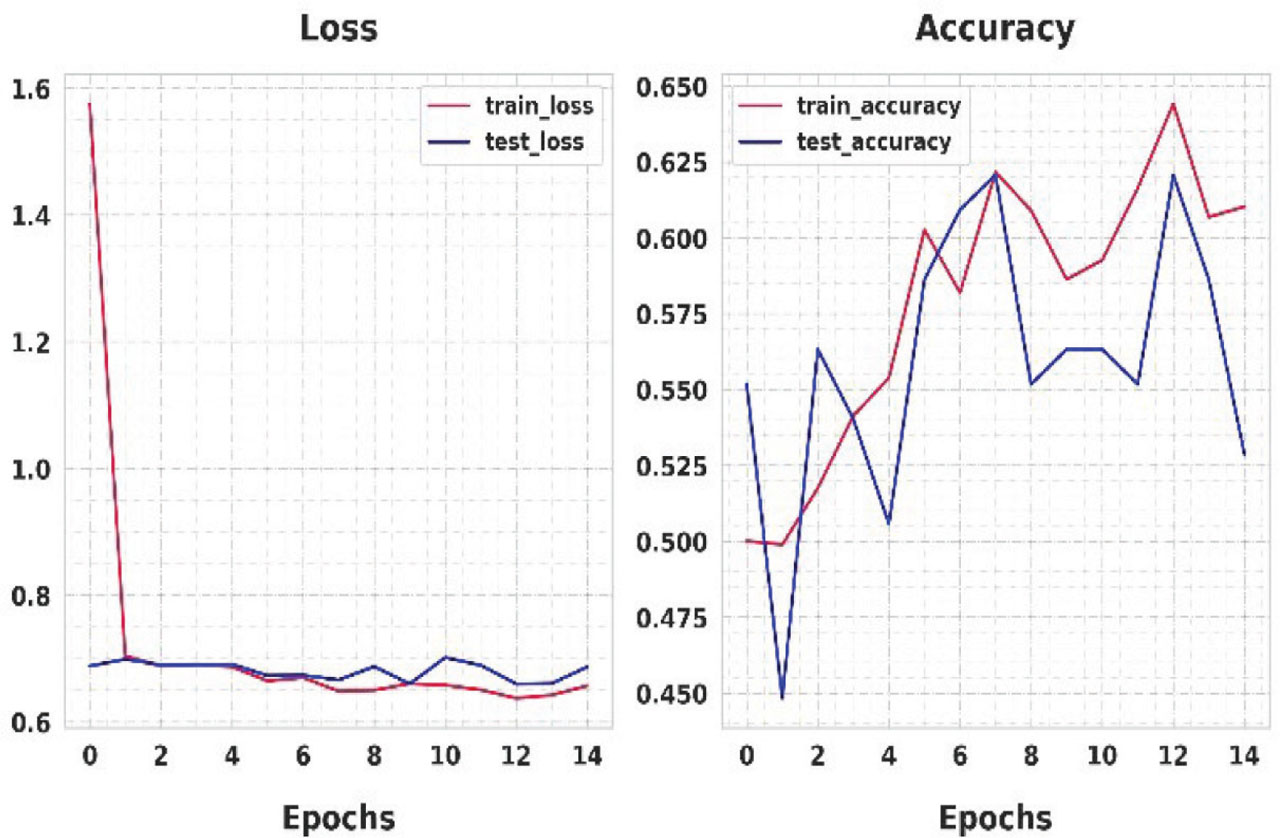
Figure 8:
Training and validation performance metrics.
However, it can be overfitting or underfitting, as designated by the training loss of 0.69 and validation loss of 0.7. A classic indicator of overfitting is when the training loss is marginally less than the validation loss, indicating that the model performs better on the training data than the unseen validation data. Furthermore, the model performs moderately, as evidenced by the training accuracy of 0.645 and validation accuracy of 0.620, where the training accuracy is greater than the validation accuracy. This implies that although the model can predict illness on the training set, it is difficult when tested on fresh, untested data. Tactics, including expanding the training dataset, modifying the model architecture, or applying regularization techniques, may lessen overfitting and improve the model’s capacity for generalization to enhance performance.
Table 9 shows the avocado crop monitoring with HSTSF-AT. By pairing temperature observations with spectral changes, the technology registers changes in crop status over time. For a threshold temperature of 25°C and a threshold spectral change of 5.0%, if the temperature is recorded at 23.2°C on day 1 with a spectral shift of 3.5%, day 5 has a 6.5% change in the spectrum and a temperature of 26.1°C, on day 10 the change is 12.1% and temperature is 30.0°C, on day 15, the change is 15.4% and temperature is 32.2°C. Adaptive thresholding improves the identification of abnormal crop conditions by dynamically allowing the threshold values to change based on current data. This approach ensures timely interventions and better crop health management by enhancing early detection and more accurate monitoring.
Table 9:
HSTSF-AT for crop monitoring
| Day | Crop type | Temp (°C) | Spectral change (%) | Threshold temp (°C) | Threshold spectral change (%) |
|---|---|---|---|---|---|
| 1 | Avocado | 23.2 | 3.5 | 25 | 5.0 |
| 5 | 26.1 | 6.5 | 26 | 6.0 | |
| 10 | 30.0 | 12.1 | 29 | 8.5 | |
| 15 | 32.2 | 15.4 | 30 | 9.5 |
As shown in Figure 9, the proposed method outperforms both SVM and CNN regarding multiple metrics. The proposed method achieves better accuracy (95%) than SVM (70%) and CNN (85%) as compared with leaf temperature monitoring. This demonstrates its ability to analyze environmental data accurately. On yield prediction, our suggested approach tops the 70% and 75% accuracy of SVM and CNN, respectively, reaching an accuracy of 90%. This means that the proposed model improves the prediction of agricultural results. In addition, our proposed method achieves a remarkably high reliability of 98% for the entire system, significantly better than SVM (85%) and CNN (90%), an essential characteristic of a real-world solution. This suggests that the proposed algorithm demonstrated more substantial predictive power and accuracy and shows excellent promise for agricultural applications. This high-performance potential indicates it is a more appropriate choice than traditional machine learning approaches for these areas.
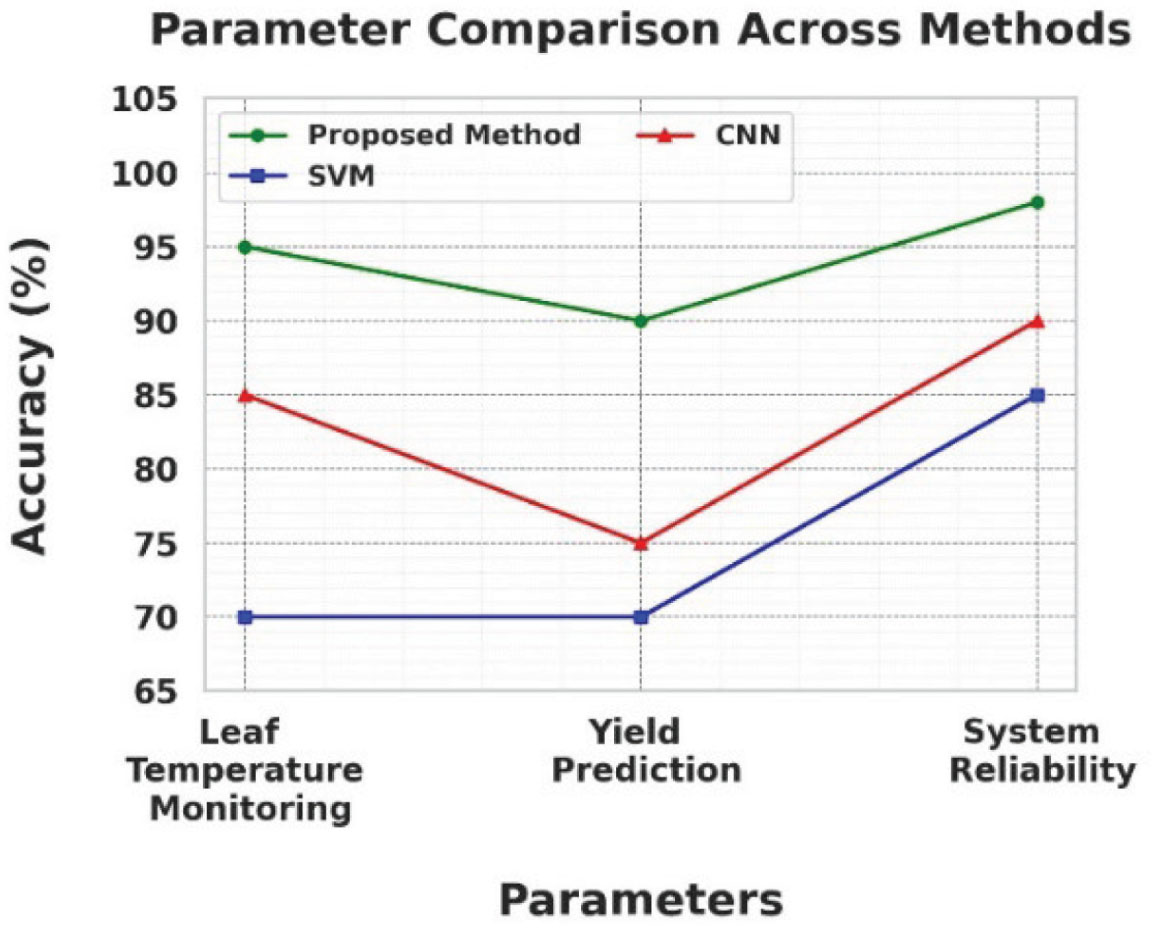
Figure 9:
Comparison of proposed method with SVM and CNN. CNN, convolutional neural networks; SVM, support vector machine.
V. Conclusion
A combination of machine learning and IoT in terms of identifying and preventing plant diseases on fruit leaves creates a strategic change in the contemporary farming sector. IoT-based sensors provide high-accuracy and real-time information on a variety of plant physiological values and environmental conditions in the area, such as temperature, humidity, and the physical features of leaves. Because of their capability to handle plant images and sensor data, such as CNNs and HVTs, these technologies could be efficiently used to identify the early signs of prevalent pathogens, such as Verticillium wilt and anthracnose.
Machine-learning algorithms make it easier to diagnose disease states with a high degree of accuracy, thus making it easier to detect the disease earlier and use minimal human involvement. Timely diagnosis also enables the farmers to take timely actions to minimize chances of crops being left in the field and to be damaged by unfavorable weather conditions. In the long run, models may prove effective in decision making, as models become more reliable and efficient as time goes by, and data gathered will support them in learning.
Thus, the intersection of IoT and machine learning can result in a significant reduction in the use of chemicals and other resources in agricultural production. Through active management of disease burdens, the technologies lead to higher yield of crops; a study has shown that there are some increases in harvest of between one and a half to two times the original yield, hence contributing to the overall production levels. The above development highlights the central role of technology in streamlining all aspects of crop control, hence ensuring that there are food stocks in the face of rising international demands.