
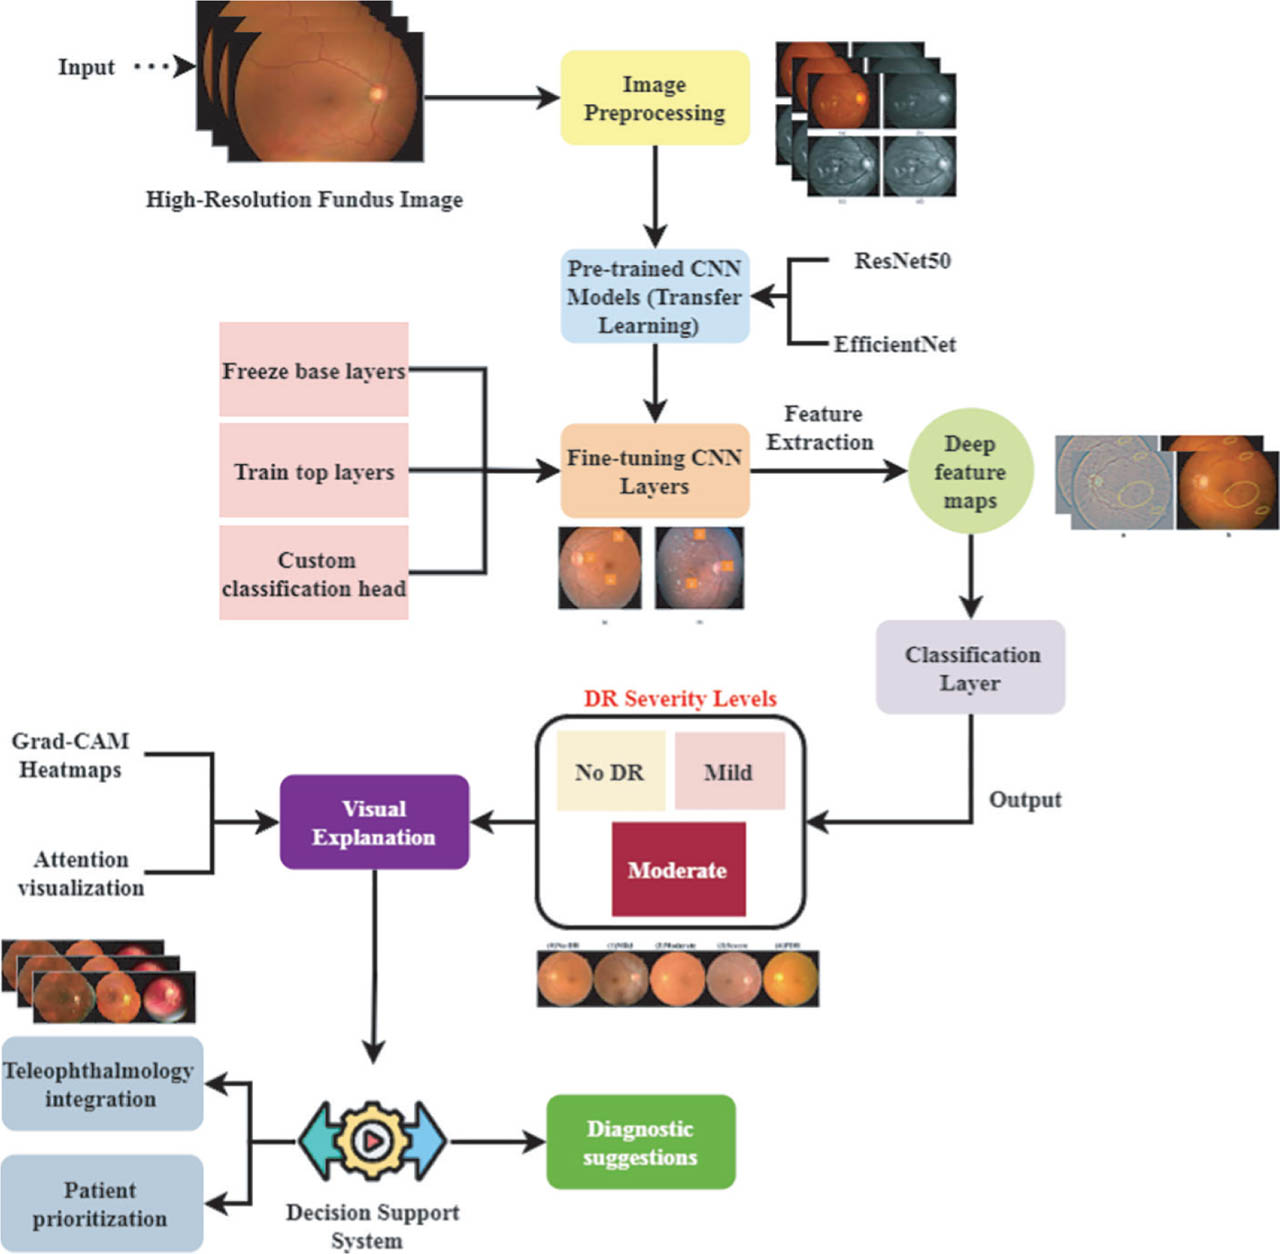
Figure 1:
TL-Pretr-CNN framework for automated retinal disease detection and classification. CNNs, convolutional neural networks; DR, diabetic retinopathy; Grad-CAM, gradient-weighted class activation mapping; TL-Pretr-CNN, transfer learning with pre-trained CNN models.


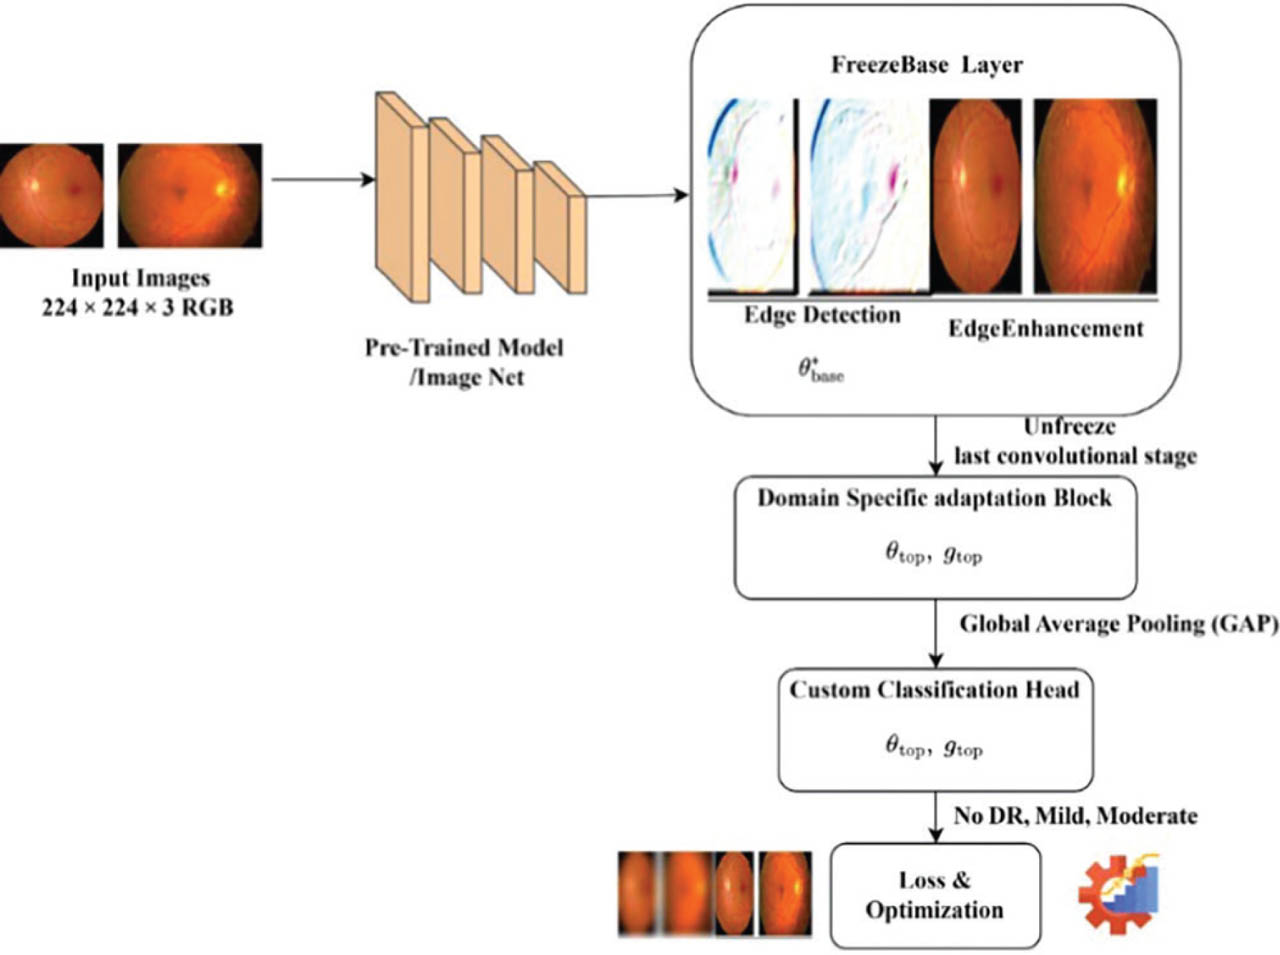
Figure 2:
TLPretrCNN workflow for multimodal retinal diagnosis. CNNs, convolutional neural networks; DR, diabetic retinopathy; GAP, global average pooling; TL-Pretr-CNN, transfer learning with pre-trained CNN models.
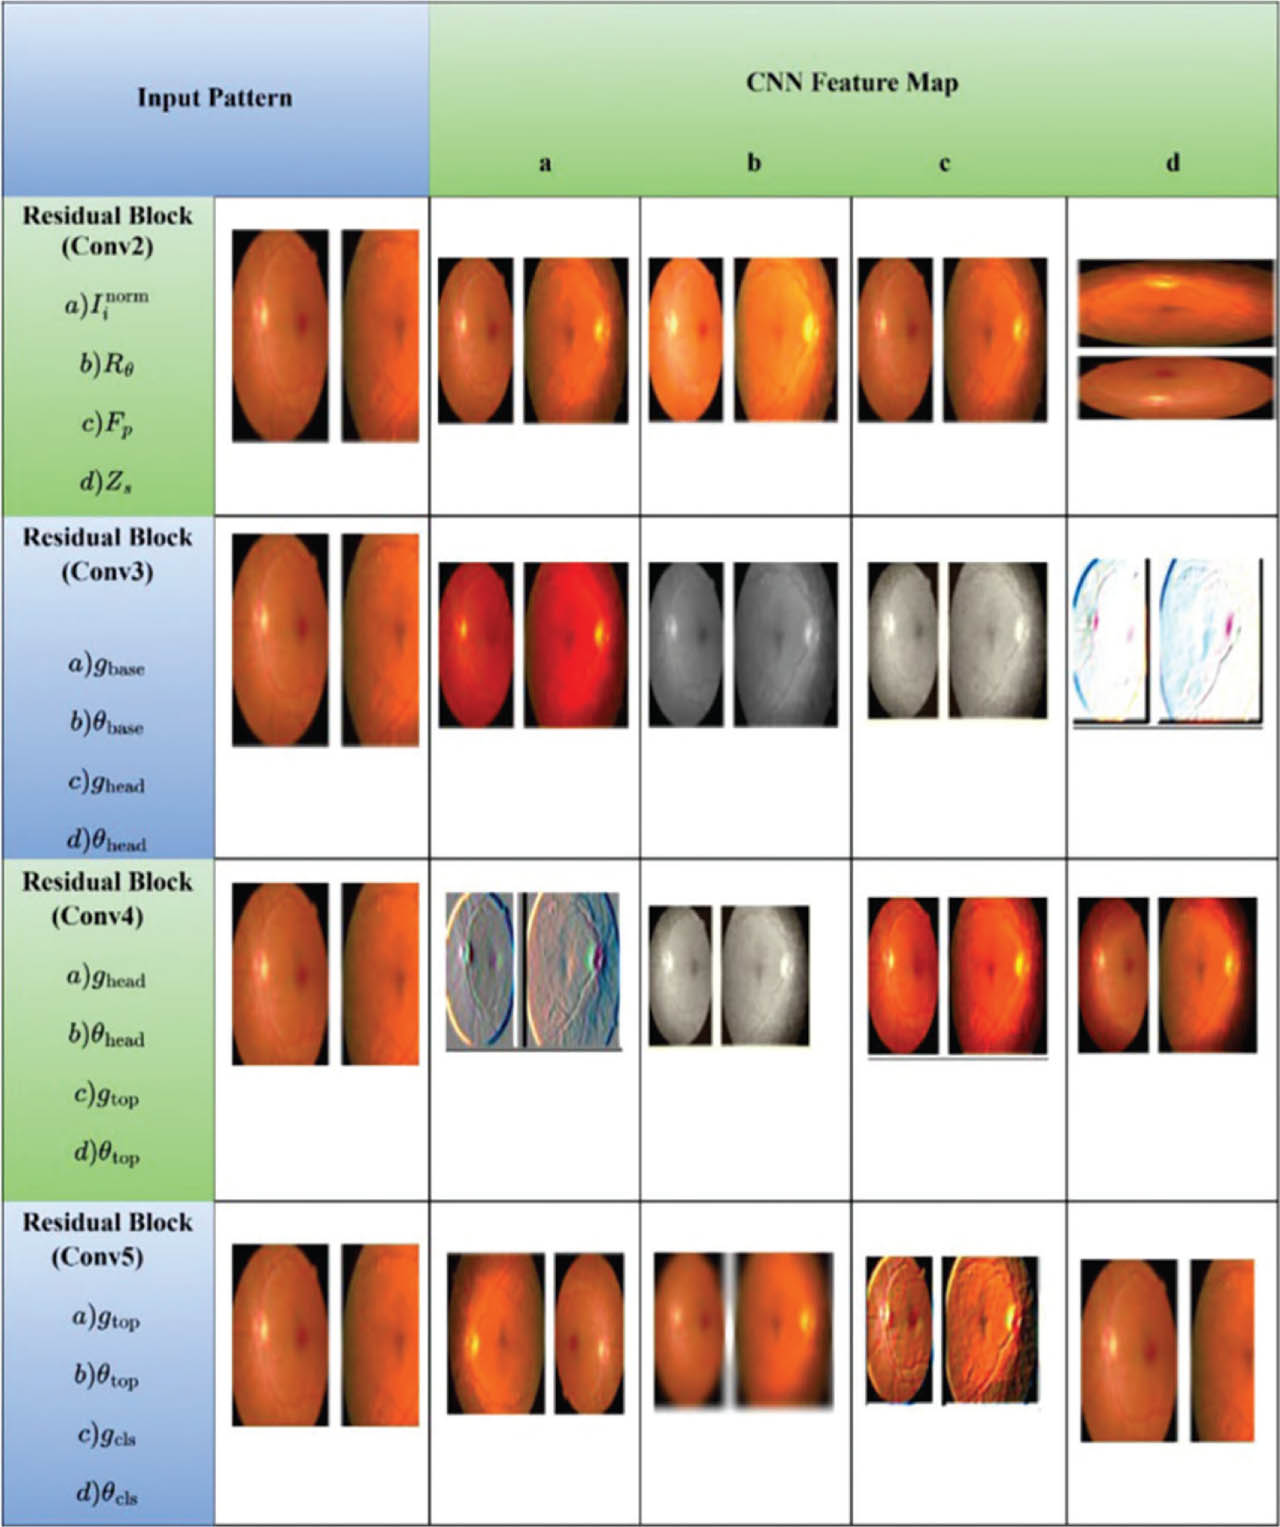
Figure 3:
Progressive feature evolution across TLPretrCNN residual stages. CNNs, convolutional neural networks; TLPretrCNN, transfer learning with pre-trained CNN models.
Table 2:
Hyperparameters
| Hyperparameter | Selected value | Notes/optimization rationale |
|---|---|---|
| Batch size | 32 | Balances GPU memory and gradient stability |
| Learning rate | 1 × 10⁻⁴ (cosine annealing) | Smooth convergence; avoids oscillation or plateauing |
| Optimizer | AdamW (weight decay = 0.01) | Strong generalization compared to Adam |
| Epochs | 40 | Trade-off between performance gain and overfitting |
| Fine-tuning depth | Last three convolutional blocks | Adapts pre-trained features to retinal pathology |
| Data augmentation | CLAHE, ±20° rotation, random crop, brightness/contrast | Improves model generalization and robustness by increasing the diversity of the training data and reducing overfitting. |
| Algorithm 1: TL-Pretr-CNN—Transfer Learning Framework for Multimodal Medical Image Analysis |
| Input: Dataset D = {If, IMRI}, Pre-trained CNN Model M (e.g., ResNet50, EfficientNet), Labels Y |
| Output: Predicted Labels , Grad-CAM heatmaps, evaluation metrics |
| Step 1: Data Preparation |
| For each Img in D: |
| Preproc (resize, norm) |
| Augment (rot, flip) |
| Step 2: Load Pre-trained CNN Model |
| Load M (ImageNet): M = fInet |
| Freeze base layers: |
| Add custom head: θtop |
| Step 3: Transfer Learning – Two-Phase Training |
| For each epoch in training_epochs: |
| For each mini-batch (Ib, Yb) in the training set: |
| Forward Pass: |
| F = FInet (Ib) # Feature extraction |
| Compute Loss: |
| Backward Pass: |
| update θtop (fine-tune top layers) |
| Step 4: Deep Feature Extraction with GAP |
| For each input I_pre in the test set: |
| Fi = CNN_intermediate_layer(Ipre) |
| #Apply Global Average Pooling: |
| Step 5: Model Evaluation |
| Predict on test set: |
| Compute metrics: |
| Accuracy = correct/total |
| AUC = area under ROC curve |
| Sensitivity = TP / (TP + FN) |
| Step 6: Explainability via Grad-CAM |
| For in : |
| Gen GCAM from the final conv |
| Overlay GCAM on the original image |
| Step 7: Output Integration |
| If eval_m ≥ th: |
| Intg mdl → TH_DSS |
| Else: |
| Retrn , Ptune |
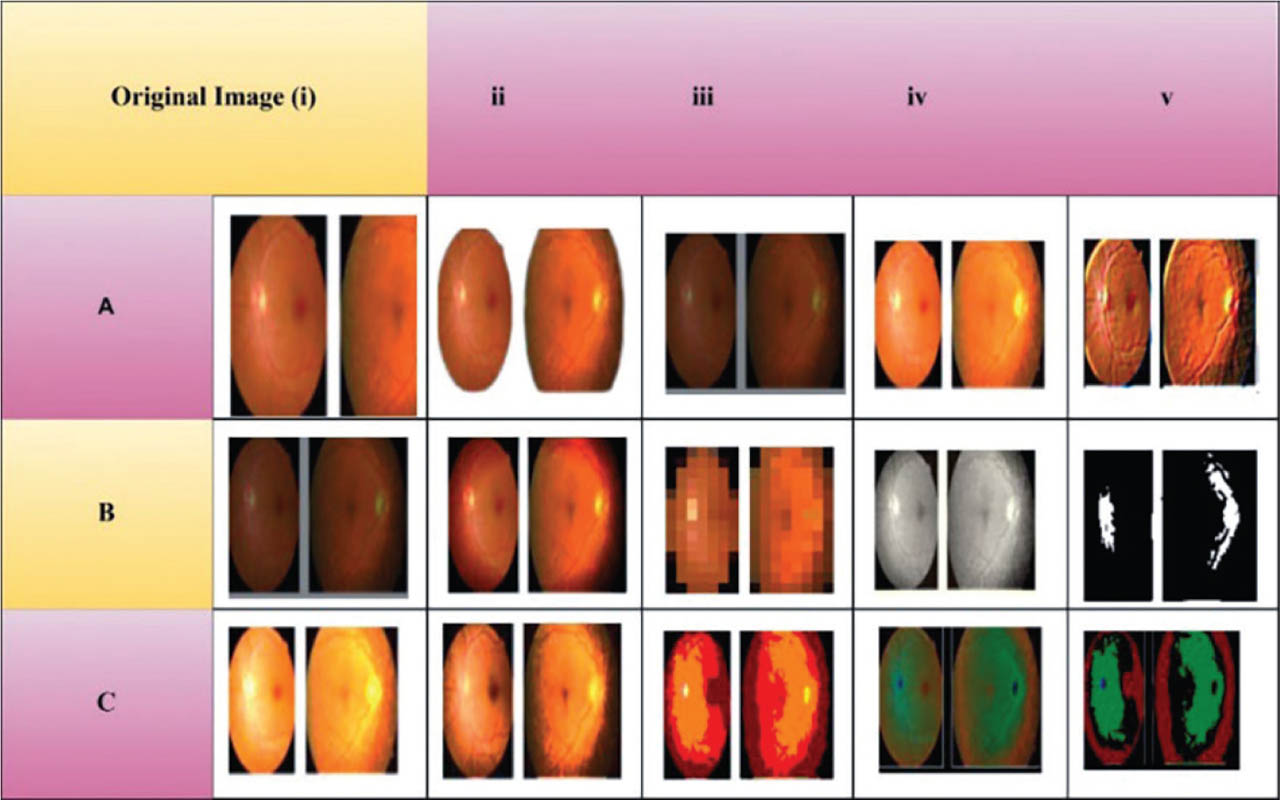
Figure 4:
Multi-class GradCAM visualization for three diagnostic categories (A) Healthy, (B) Mild pathology, (C) Moderate/severe pathology. GradCAM, gradient-weighted class activation mapping.
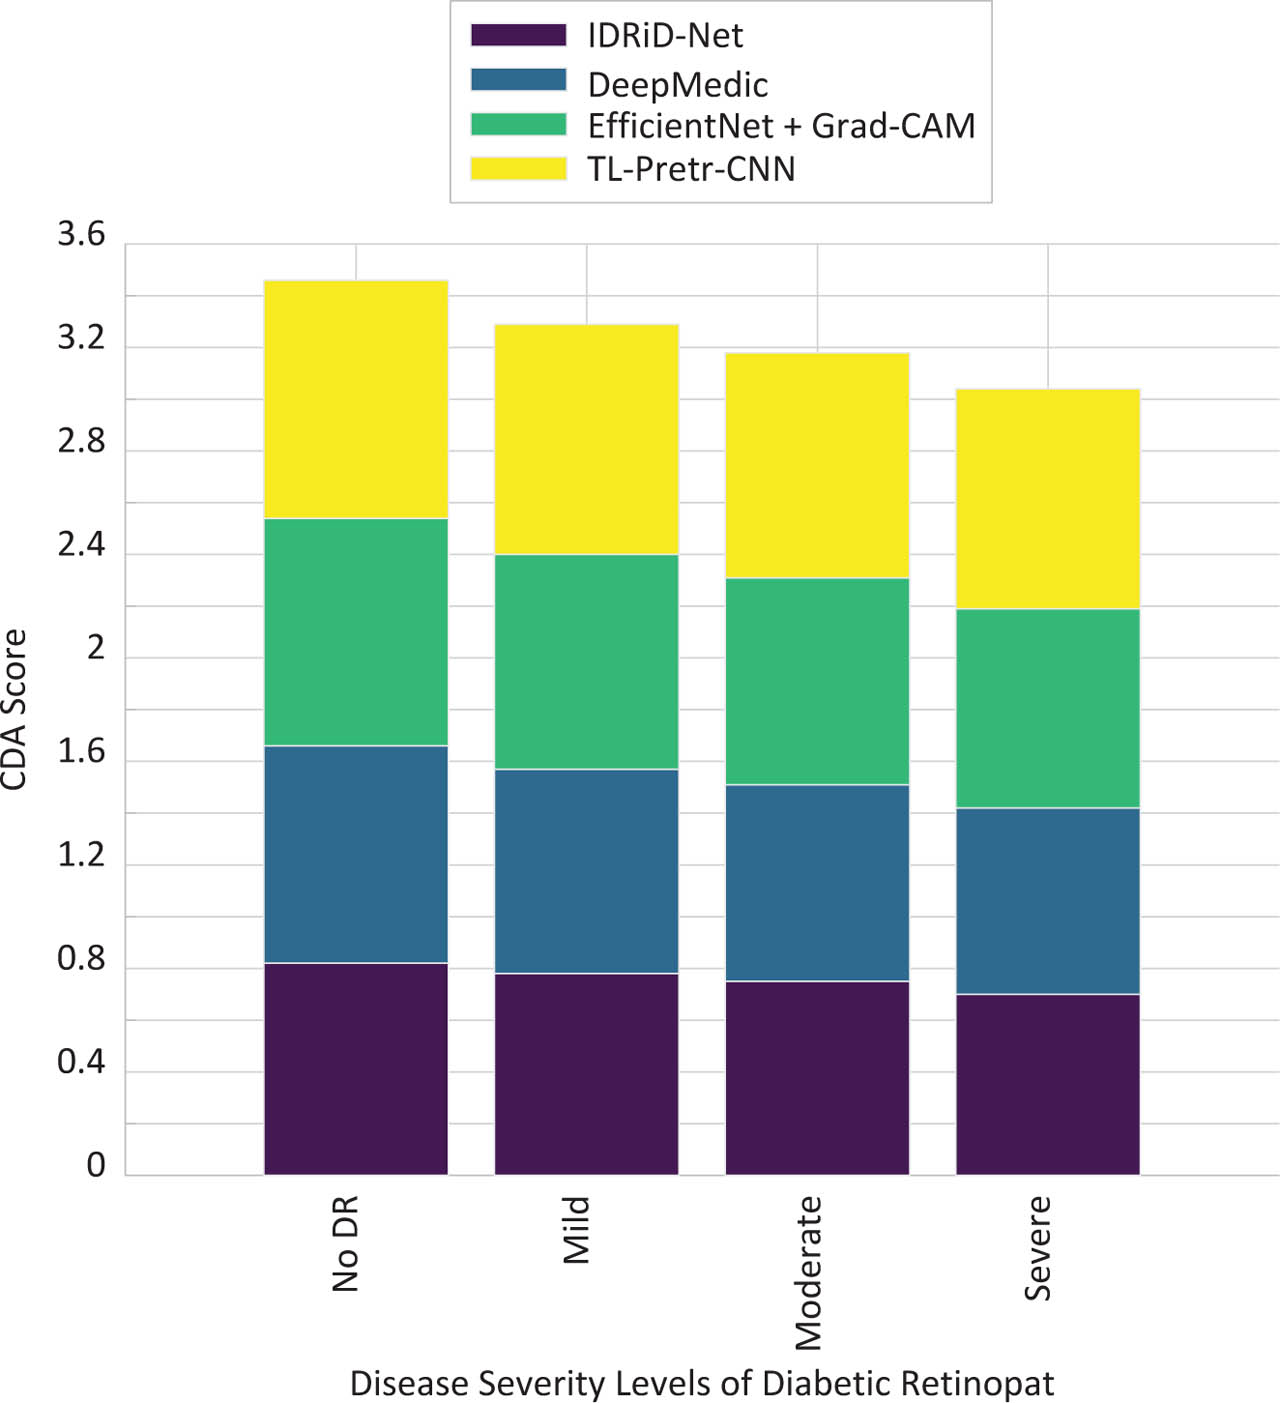
Figure 5:
CDA comparison across disease severity levels of DR. CDA, clinical diagnostic accuracy; DR, diabetic retinopathy; Grad-CAM, gradient-weighted class activation mapping; IDRiD-Net, improved deep retinal intelligence detector network; TL-Pretr-CNN, transfer learning with pre-trained CNN models.
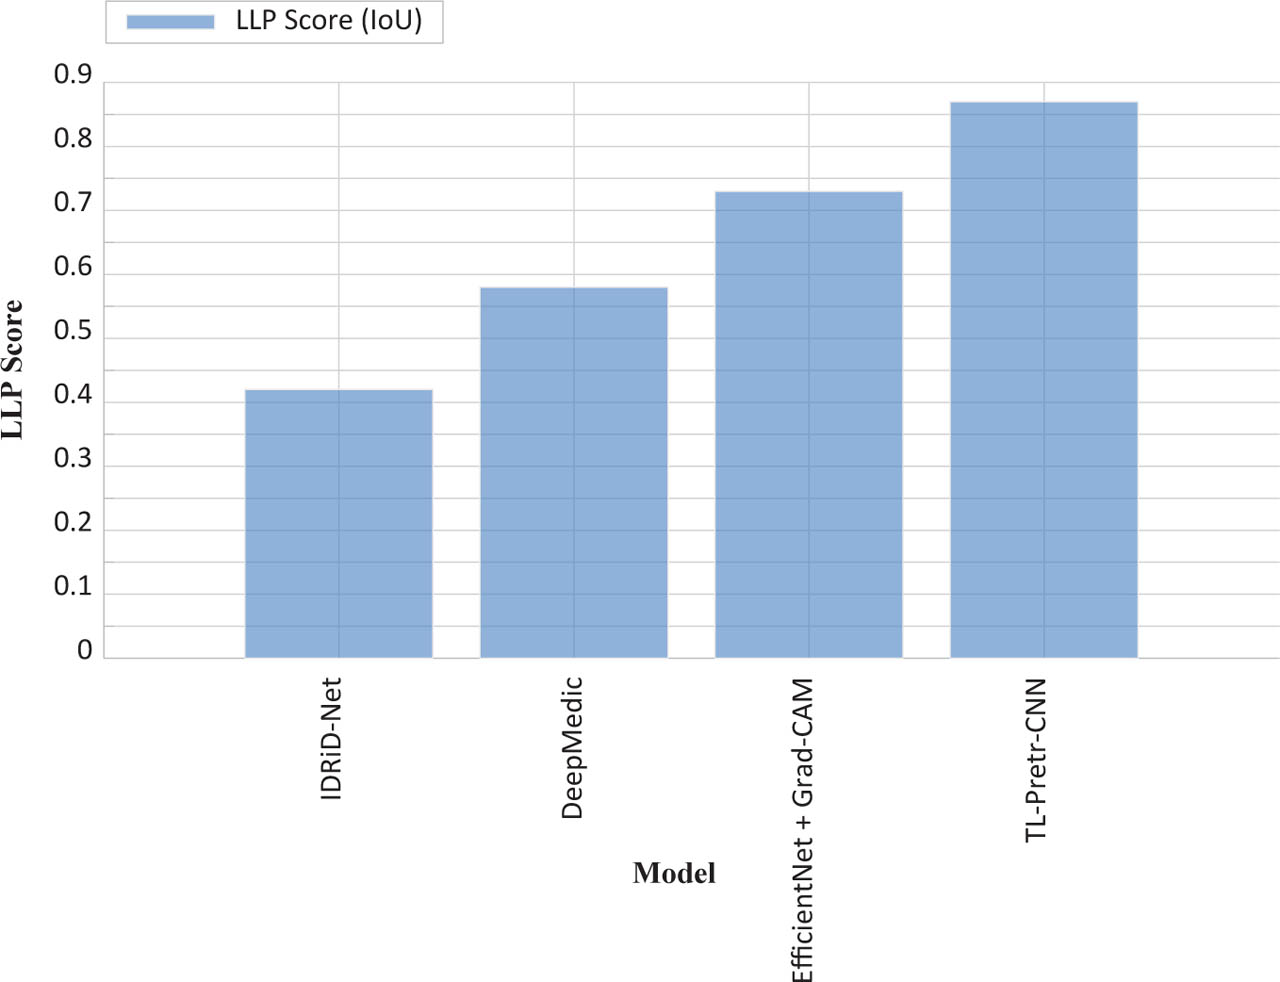
Figure 6:
LLP evaluation plot. Grad-CAM, gradient-weighted class activation mapping; IDRiD-Net, improved deep retinal intelligence detector network; TL-Pretr-CNN, transfer learning with pre-trained CNN models.
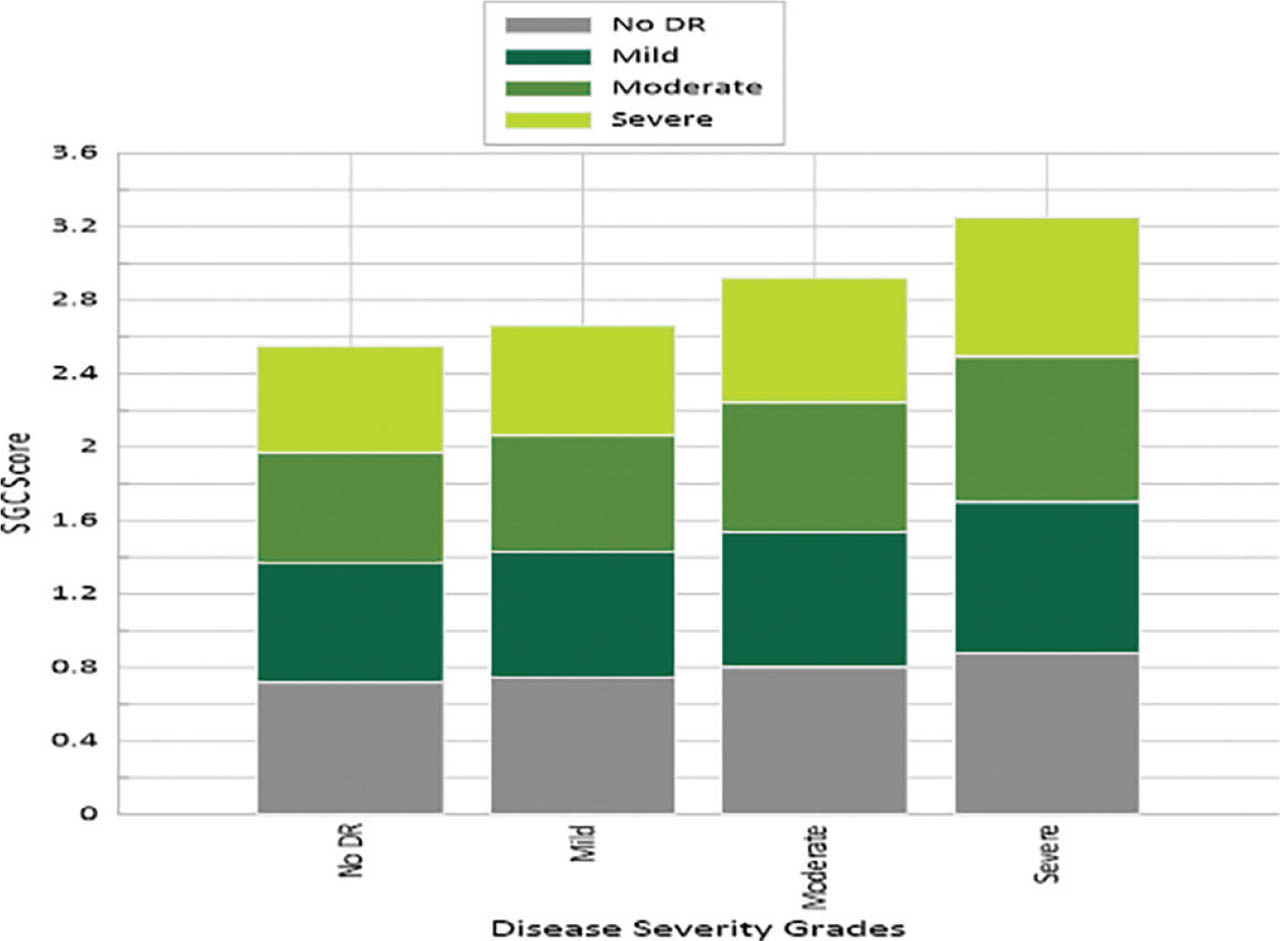
Figure 7:
SGC line chart across disease grades. DR, diabetic retinopathy; SGC, severity grading concordance.
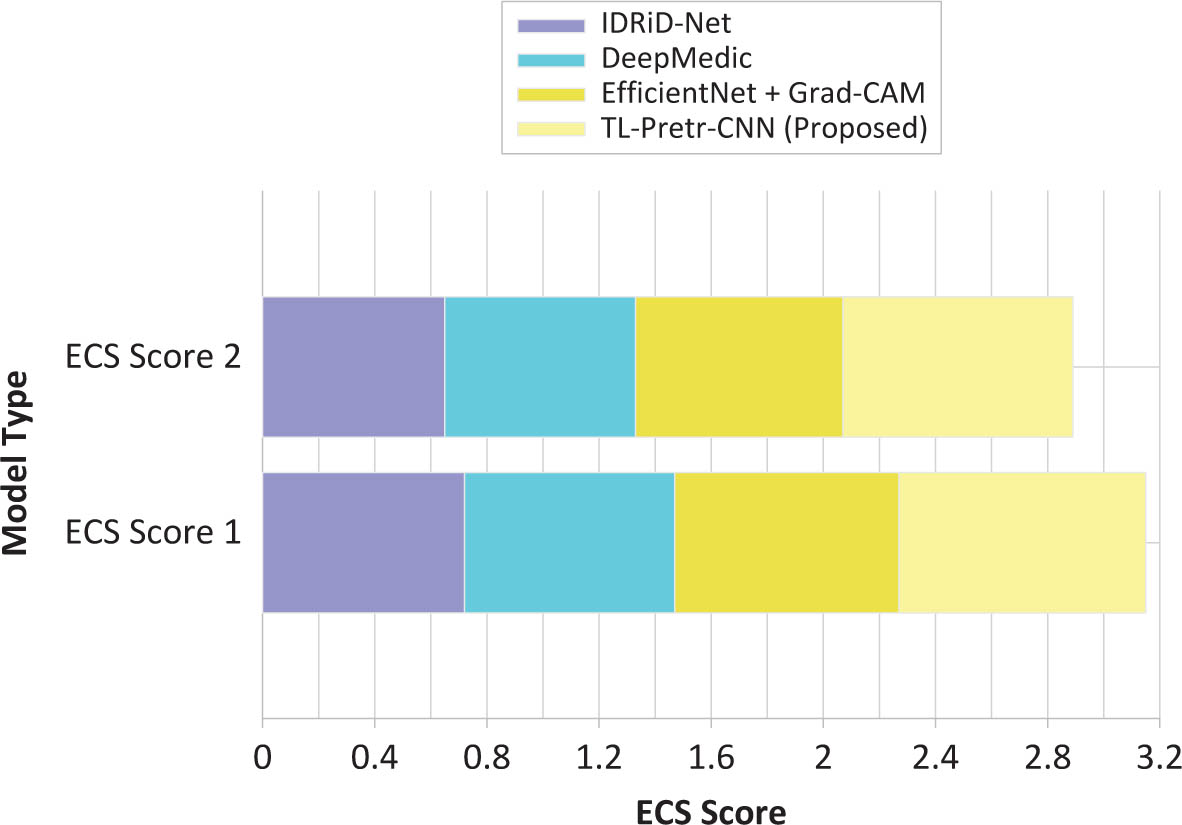
Figure 8:
ECS evaluation plot. ECS, explainability confidence score; Grad-CAM, gradient-weighted class activation mapping; IDRiD-Net, improved deep retinal intelligence detector network; TL-Pretr-CNN, transfer learning with pre-trained CNN models.
Table 3:
Comparative metrics, statistical significance and inference time
| Model | Accuracy (%) | LLP (IoU) | SGC (QWK) | ECS | Sensitivity | Specificity | AUC | p-value vs TL-Pretr-CNN | Inference Time (ms/image) |
|---|---|---|---|---|---|---|---|---|---|
| IDRiD-Net | 78.3 ± 1.2 | 0.62 ± 0.03 | 0.71 ± 0.02 | 0.67 | 0.75 | 0.80 | 0.84 | <0.05 | 8 |
| DeepMedic | 80.5 ± 1.0 | 0.66 ± 0.02 | 0.75 ± 0.02 | 0.70 | 0.78 | 0.82 | 0.86 | <0.05 | 10 |
| EfficientNet + Grad-CAM | 84.1 ± 0.9 | 0.71 ± 0.02 | 0.79 ± 0.01 | 0.74 | 0.81 | 0.85 | 0.89 | <0.05 | 14 |
| TL-Pretr-CNN | 88.6 ± 0.8 | 0.78 ± 0.01 | 0.85 ± 0.01 | 0.81 | 0.86 | 0.89 | 0.93 | — | 12 |
[i] Note: Accuracy, LLP and SGC show statistically significant improvements (p < 0.05) compared to baselines. Inference times correspond to batch size 32 on NVIDIA A100 GPU + Intel Xeon CPU.
[ii] CNNs, convolutional neural networks; ECS: explainability confidence score; Grad-CAM, gradient-weighted class activation mapping; IDRiD-Net, improved deep retinal intelligence detector network; IoU, intersection over union; QWK, quadratic weighted kappa; SGC, severity grading concordance; TL-Pretr-CNN, transfer learning with pre-trained CNN models.