
Table 1:
Data head
| Soil health | Weather conditions | Plant health | Disease label |
|---|---|---|---|
| 51 | 56 | 62 | 0 |
| 92 | 16 | 85 | 0 |
| 14 | 85 | 1 | 1 |
| 71 | 89 | 87 | 0 |
| 60 | 43 | 71 | 0 |
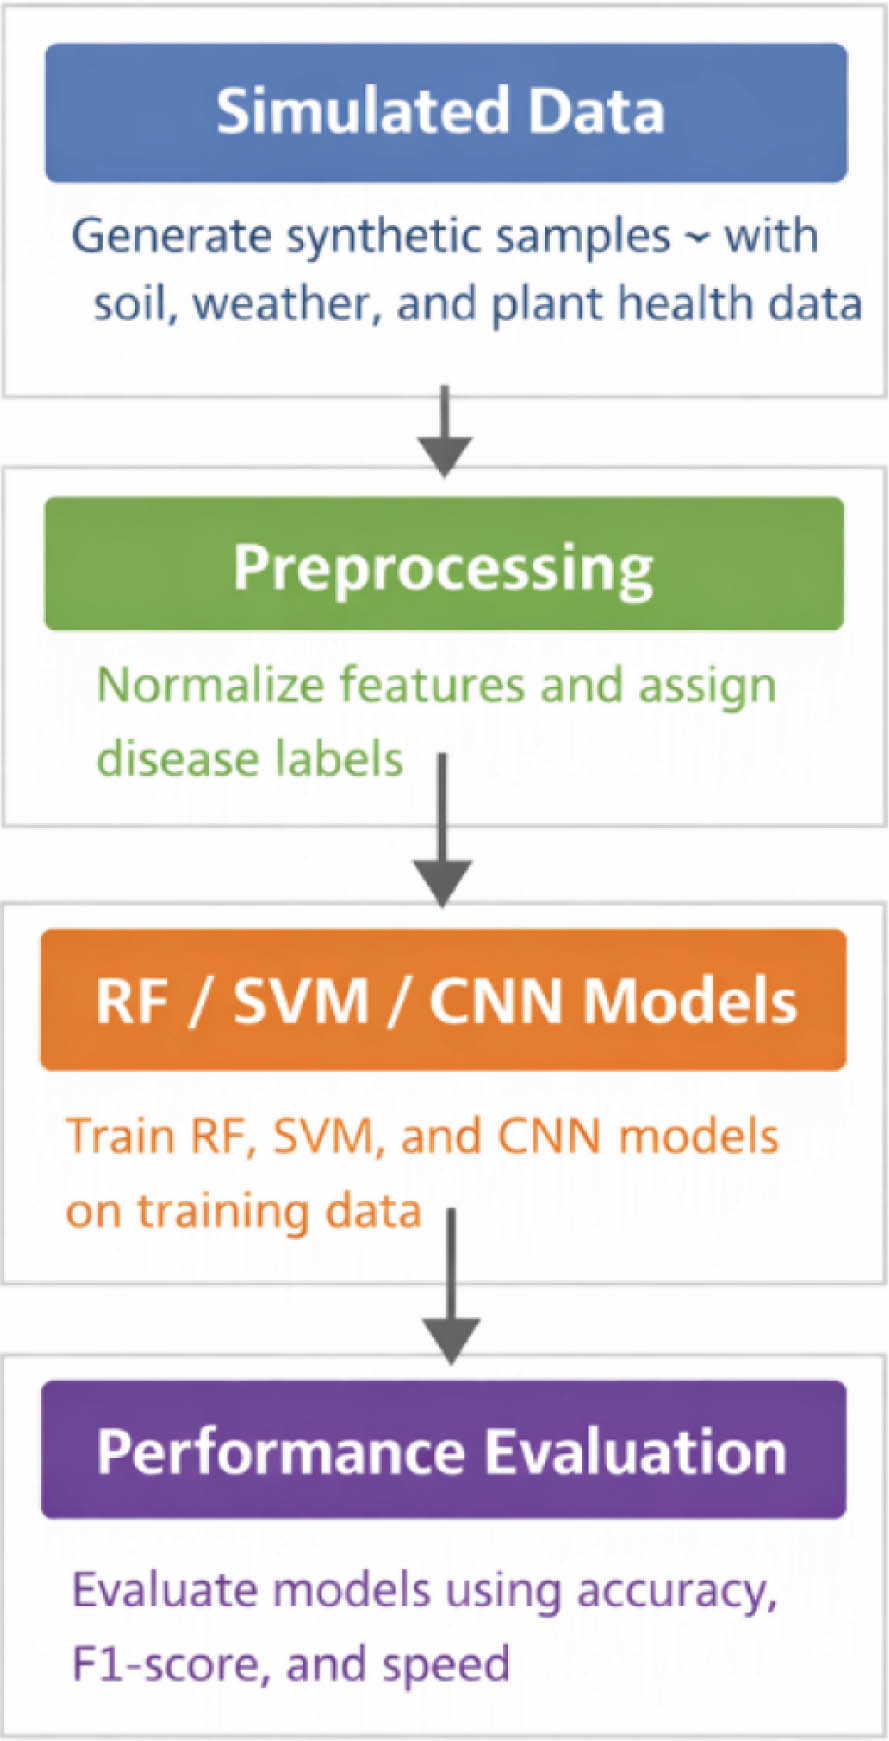
Figure 1.
Workflow of the proposed crop disease detection system.
Algorithm 1:
Crop Disease Detection Using Simulated Data
|
Table 2:
RF classifier
| Class | Precision | Recall | F1-score | Support |
|---|---|---|---|---|
| 0 (No disease) | 1.00 | 1.00 | 1.00 | 89 |
| 1 (disease) | 1.00 | 1.00 | 1.00 | 111 |
| Accuracy | 1.00 | 200 | ||
| Macro avg | 1.00 | 1.00 | 1.00 | 200 |
| Weighted avg | 1.00 | 1.00 | 1.00 | 200 |
Table 3:
SVM
| Class | Precision | Recall | F1-score | Support |
|---|---|---|---|---|
| 0 (No disease) | 1.00 | 1.00 | 1.00 | 89 |
| 1 (Disease) | 1.00 | 1.00 | 1.00 | 111 |
| Accuracy | 1.00 | 200 | ||
| Macro avg | 1.00 | 1.00 | 1.00 | 200 |
| Weighted avg | 1.00 | 1.00 | 1.00 | 200 |
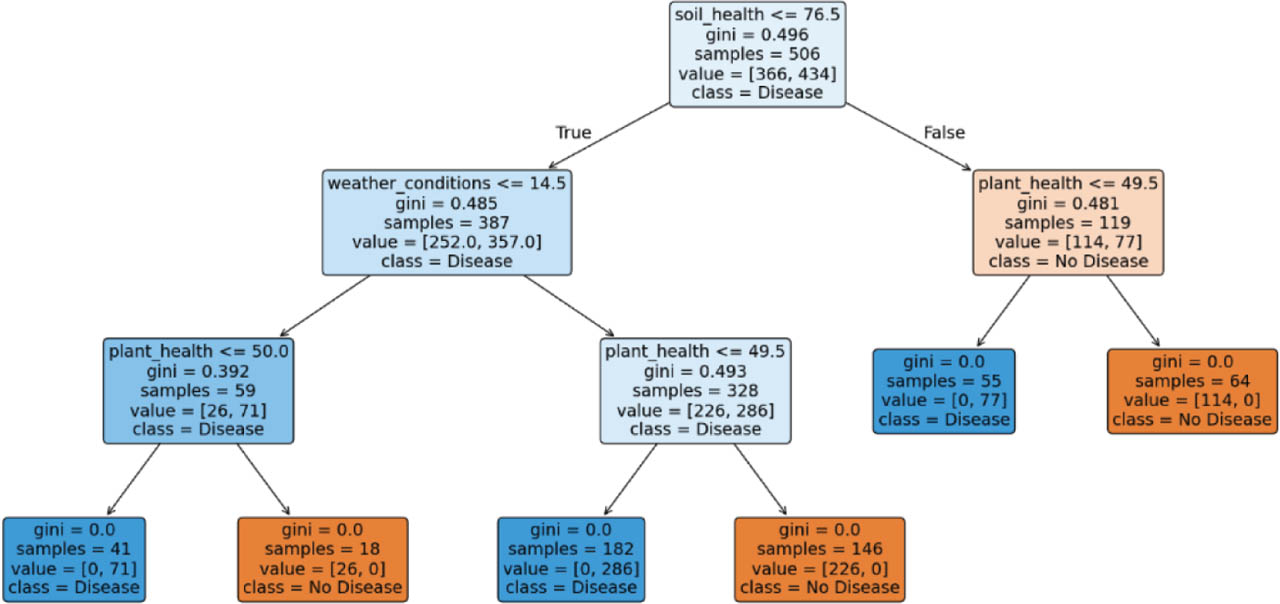
Figure 2:
Decision tree.
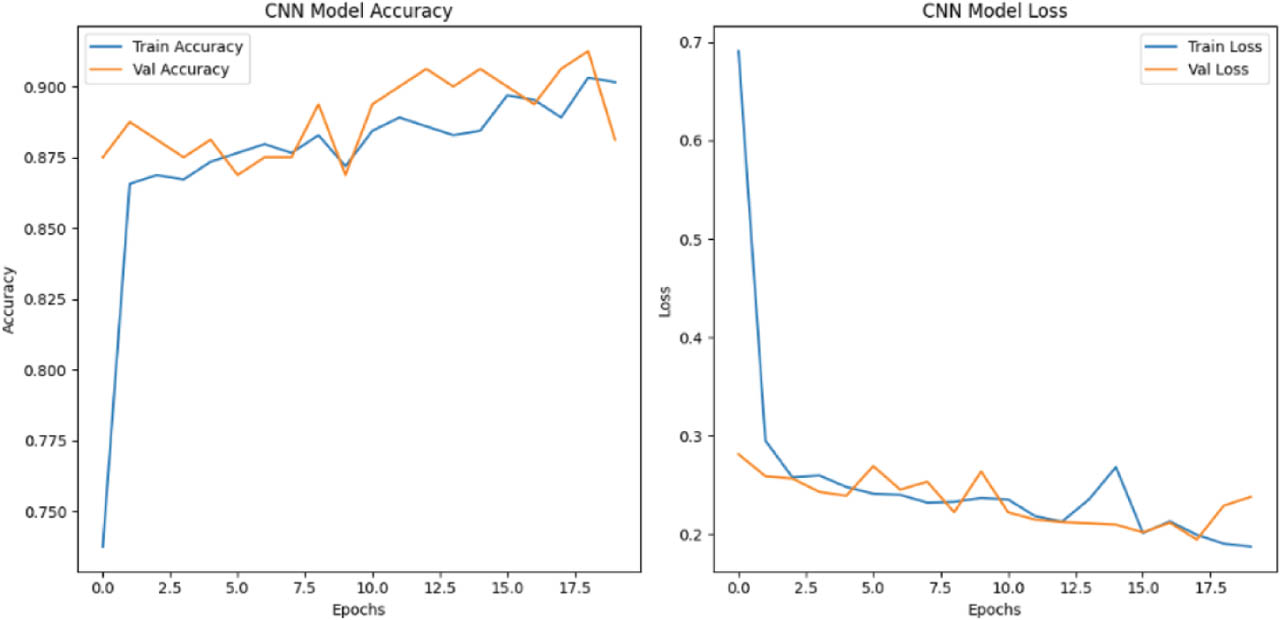
Figure 3:
CNN model accuracy and loss. CNN, Convolutional Neural Network.