
Table 1:
An overview of the identification and categorization of diseases of plant leaves
| Reference | Objective | Approach | Main results | Constraints |
|---|---|---|---|---|
| [3] | Segment diseased leaf portions for classification | SVM | Improved feature extraction for disease classification | Requires manual feature extraction; may not generalize well |
| [4] | Enhance feature extraction using combined classifiers | Voting classifier integrating decision trees, SVM, and K-NN | Combining classifiers significantly enhances accuracy | Complexity in integrating multiple classifiers |
| [14] | Detect strawberry diseases (leaf blight, crown/leaf/fruit, gray mold, powdery mildew) via CNN (compare VGG16, GoogLeNet, ResNet50) | 792 original images +1,306 features (manually trimmed) of Taoyuan milling cutters, train 3 CNNs (20 epochs, SGD, 80/20 split) on originals/features; confusion matrices | ResNet50 + features–100% leaf blight (crown/leaf/fruit), 98% gray mold/powdery mildew. Features > original all models. | Manually cropped images; specific dataset (cultivars/location Taiwan); not healthy, not real-time/field, small dataset (augmentation) |
| [15] | Compare 18 CNNs + DL optimizers to classify 38 diseases (PlantVillage). | Three best (Xception, Imp. GoogLeNet, AlexNet + GoogLeNet) + 6 optimizers. | Xception + Adam = 99.81% acc, 0.9978 F1 Imp. GoogLeNet + Adam = 99.04% acc, 0.9864 F1 | Heavy computing (56 hr of Xception, 4GB GPU) Classification. Single Lab dataset field |
| [6] | Crop disease detection using CNN | Residual CNN with self-attention | Achieved 98% accuracy on MK-D2 and 95.33% on AES-CD9214 | Limited generalization to other crops; dataset-specific results |
| [16] | Identification of rice leaf diseases | Pre-trained MobileNet-V2 with attention mechanism | Achieved 98.48% accuracy | Dependent on ImageNet pre-training; focused on rice leaf disease only |
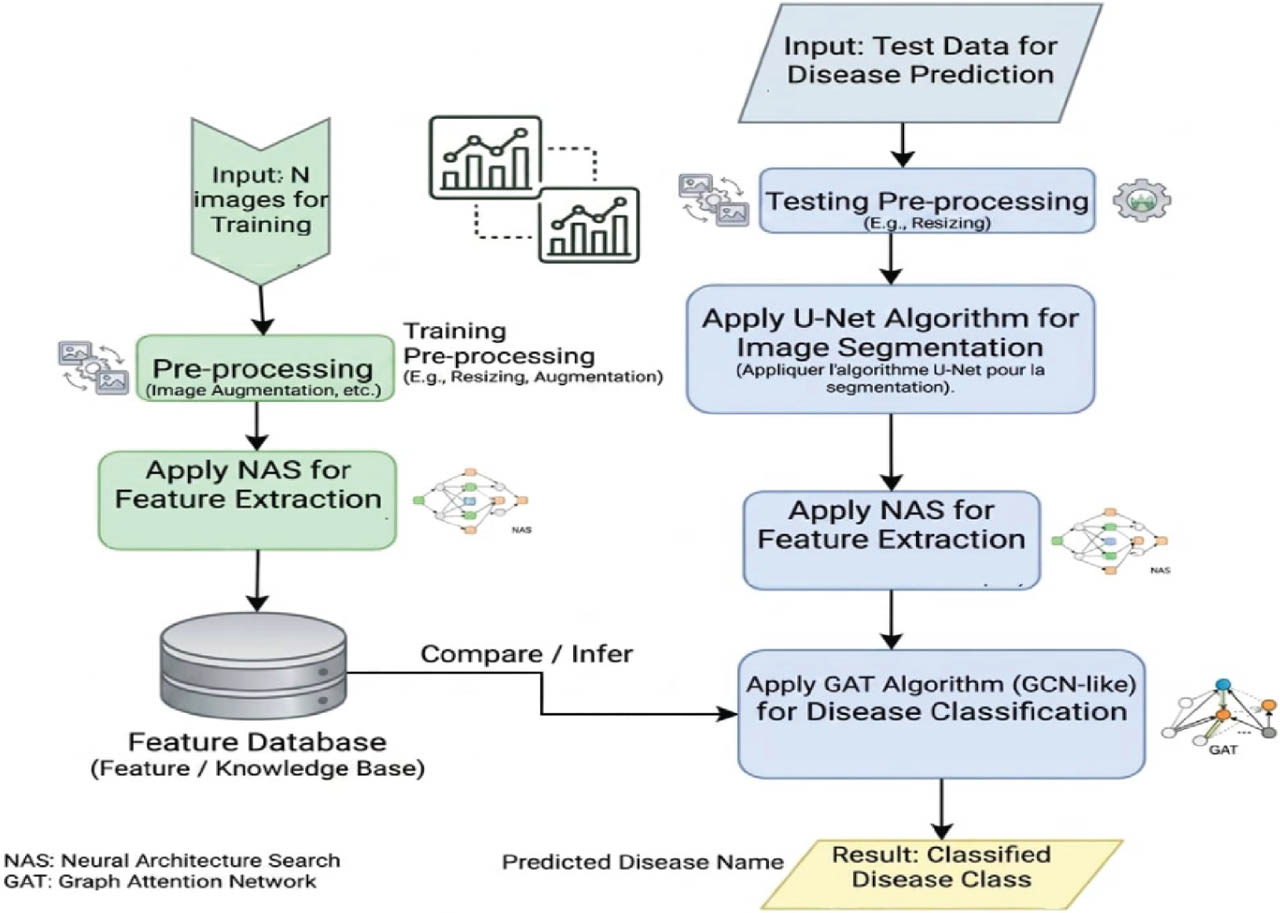
Figure 1:
Overall workflow of the proposed framework for plant disease detection. GAT, graph attention network; GCN, graph convolutional network; NAS, neural architecture search.
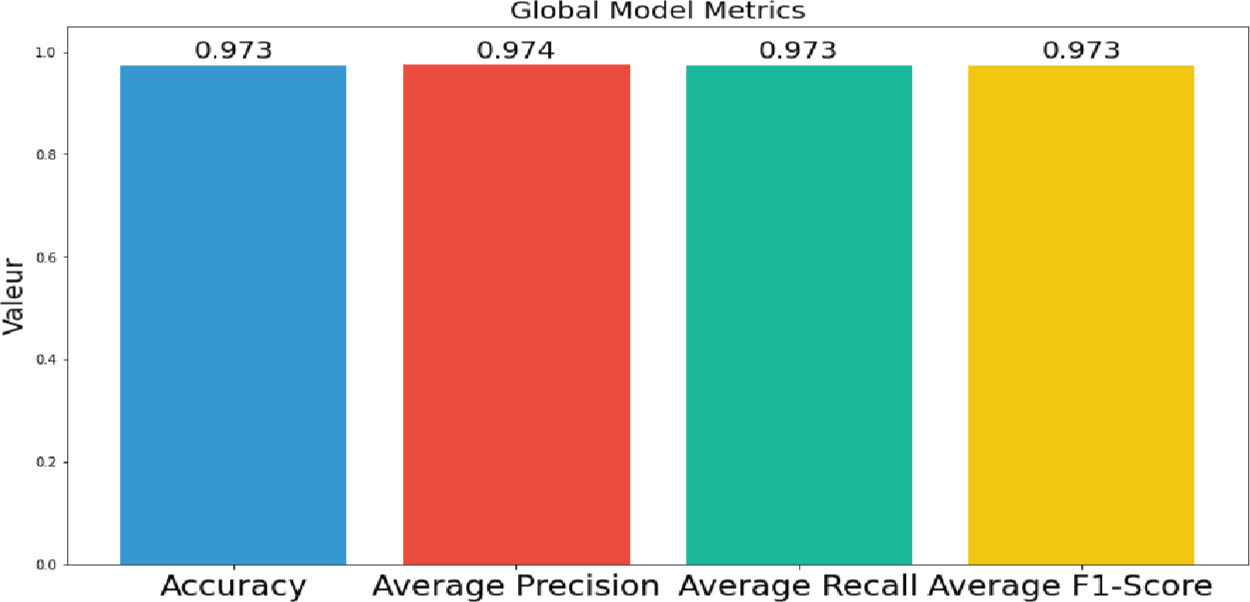
Figure 2:
Global performance metrics of the GAT model. GAT, graph attention network.
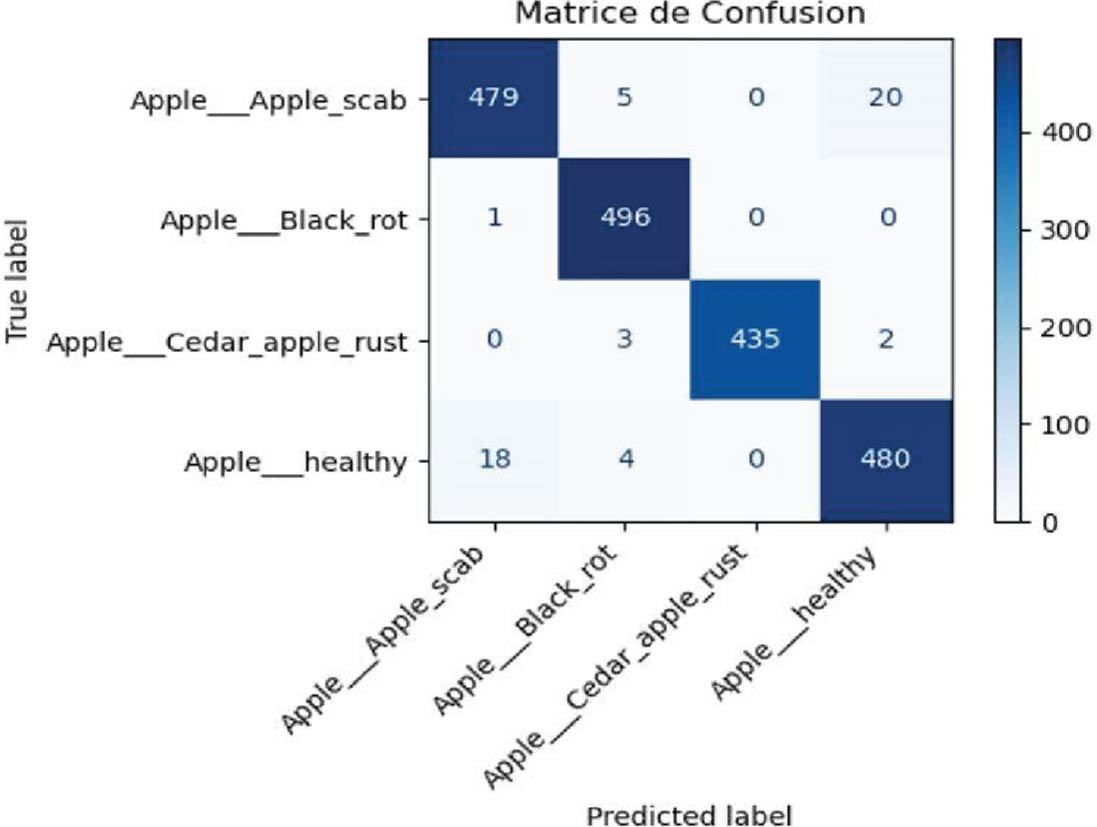
Figure 3:
Confusion matrix of the proposed model on the Apple dataset.
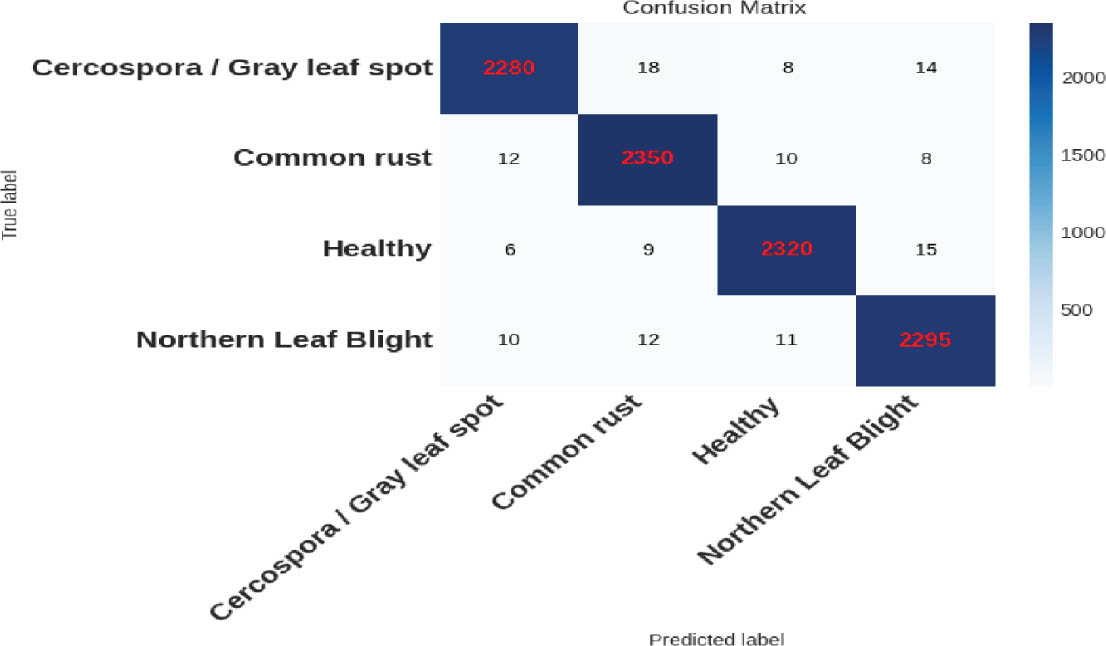
Figure 4:
Confusion matrix of the proposed model on the Grape dataset.
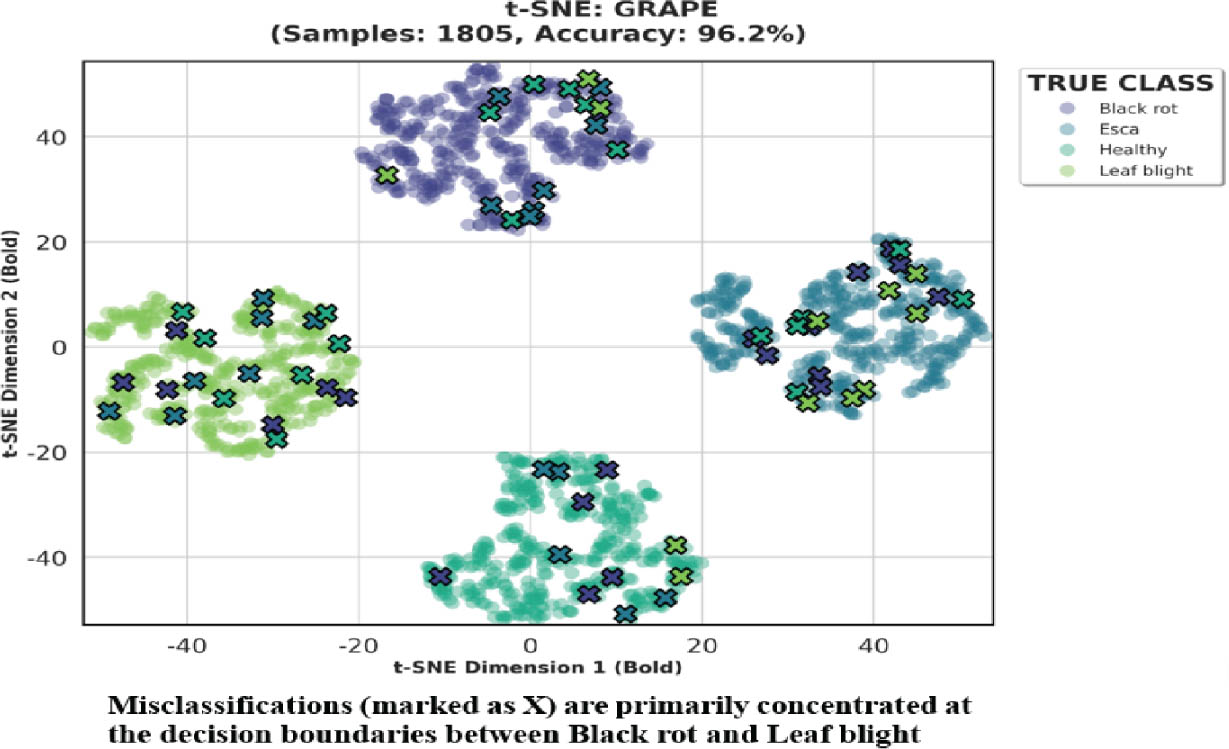
Figure 5:
t-SNE Visualization for grape classification. Misclassified samples (“X”) are colored by their true class but positioned in the predicted (false) cluster.
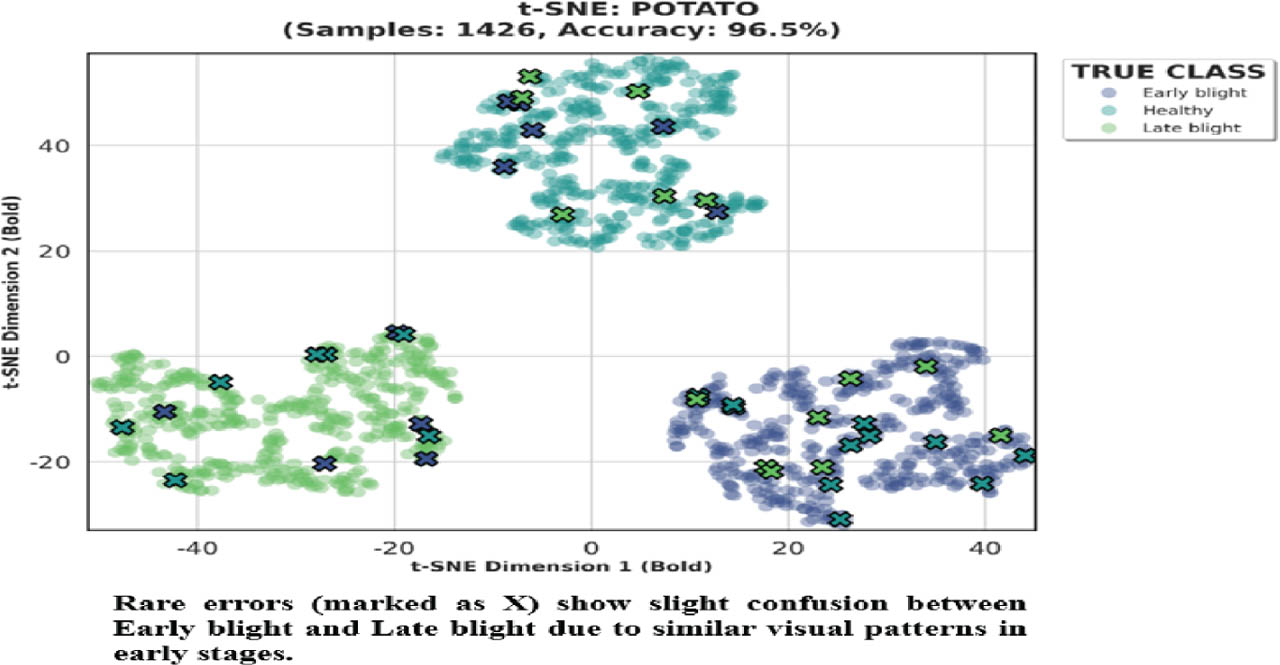
Figure 6:
t-SNE Visualization for potato classification. Misclassified samples (“X”) are colored by their true class but positioned in the predicted (false) cluster.
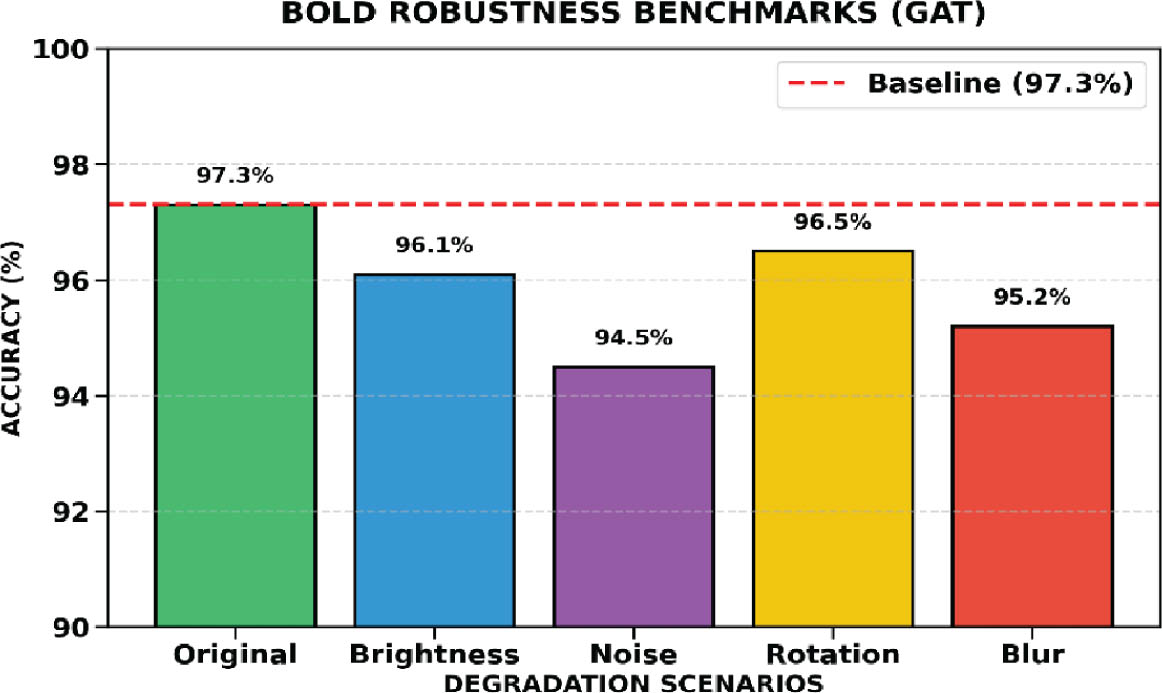
Figure 7:
GAT robustness benchmarks. GAT, graph attention network.
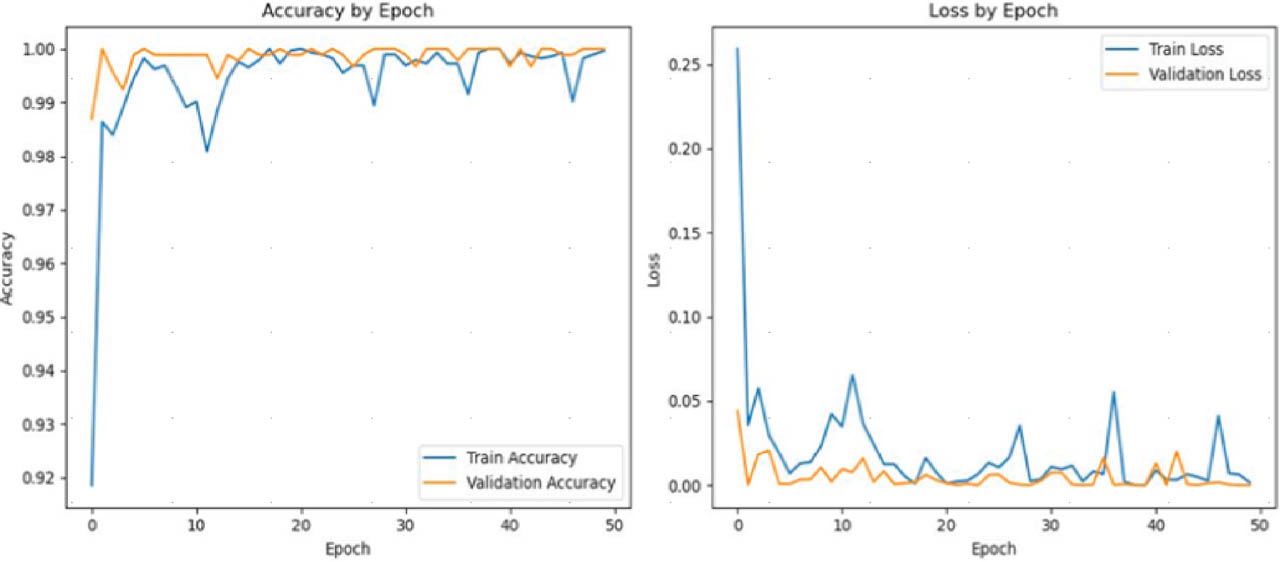
Figure 8:
Training and validation accuracy and loss curves of the proposed model on the Apple dataset.
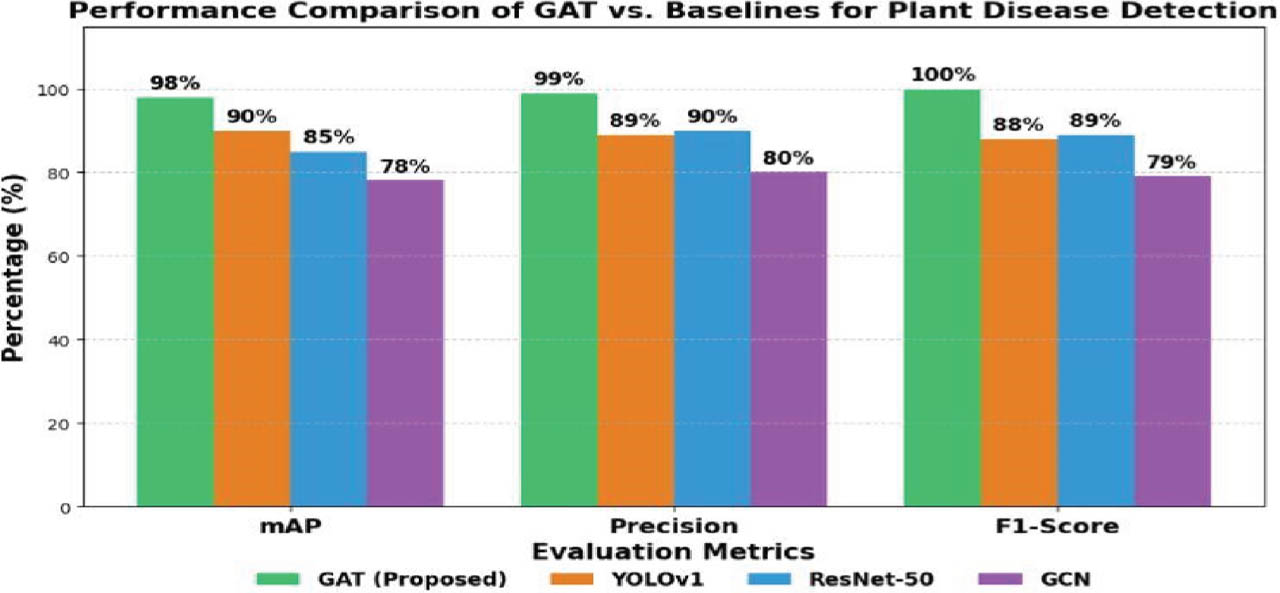
Figure 9:
Comparative performance of the proposed GAT model and baseline methods (YOLOv11, ResNet-50, and GCN) on plant disease detection. GAT, graph attention network; GCN, graph convolutional network; mAP, mean average precision.