
I. Introduction
Plant diseases endanger global food security, triggering substantial yield losses and economic disruption. Swift, accurate detection is therefore indispensable for effective crop management and an imperative that grows ever more urgent as climate change accelerates the emergence and spread of novel pathogens. Recent breakthroughs in artificial intelligence now make it possible to recognize plant diseases automatically, at scale, and with laboratory-grade precision, solely from visual symptoms. Nevertheless, traditional machine-learning and deep-learning [1] models still falter when confronted with intricate visual patterns or with symptoms whose significance depends on subtle spatial relationships.
Reinforcement learning (RL) and active learning have been explored as possible remedies: the former promises adaptive exploration strategies; the latter aims to curb costly manual annotation. Yet RL has seldom been applied directly to plant-disease detection, hindered by the difficulty of crafting meaningful environments and reward functions, while symbolic or rule-based systems, though interpretable, lack the robustness demanded by unconstrained field imagery. These shortcomings underscore the need for new paradigms capable of modeling relational dependencies without sacrificing predictive accuracy.
In this paper, we present a graph attention network (GAT) framework tailored for multi-class plant-disease identification. By representing leaves, stems, or image super-pixels as nodes and their biological or spatial interactions as edges, a GAT captures the inter-dependencies that conventional convolutional networks overlook. Learnable attention automatically highlights the most diagnostic connections, boosting recognition of diseases whose symptoms are spatially dispersed or mutually conditional.
Extensive experiments on a large multi-class disease data set show that our approach outperforms strong baselines, including You Only Look Once version 11 (YOLOv11) [2], ResNet-50, and a standard graph convolutional network while remaining interpretable and lightweight. Specifically, our contributions are:
A GAT-based pipeline that embeds biological and spatial dependencies directly into the inference process, yielding new state-of-the-art accuracy.
Rigorous validation under realistic imaging conditions, demonstrating consistent gains across disease categories, lighting variations, and hardware constraints.
An open-source, end-to-end workflow that converts raw field photographs into optimized plant graphs, enabling deployment on edge devices with a limited computational budget.
The remainder of the paper is structured as follows: Section II surveys related work, Section III details the data set and the graph-construction methodology, Section IV presents quantitative results alongside ablation studies and visual interpretations, and Section V concludes with implications for precision agriculture and future research directions.
II. Related Work
Plant disease detection has become a cornerstone of agricultural productivity, evolving from hand-crafted image processing pipelines to fully data-driven models. Early systems segment lesions and feed color, shape, and texture descriptors to support-vector machines (SVM) [3] or ensemble voters that blend decision trees, SVM, and k-Nearest Neighbors [4]; these lightweight models plateau near 90%–93% accuracy and degrade rapidly under variable illumination or background clutter. Convolutional networks now dominate; [5] add self-attention to a convolutional neural network (CNN) and reach 98% on MK-D2 dataset (plant disease dataset) and 95.3% on AES-CD9214 dataset (plant disease dataset); and [6] fine-tune MobileNet-V2 on rice leaves and report 98.5%. Saleem et al. [7] systematically compare 18 CNNs, finding that Xception + Adam attains 99.8% accuracy and 0.998 F1 on PlantVillage after 34 epochs, yet training demands 56 hr on a 4 GB GPU and remains a pure classification benchmark with no detection or real-time evaluation. Vision Transformers treat images as patch sequences and capture long-range dependencies. Reedha et al. [8] in show that a ViT with heavy augmentation surpasses CNNs even on modest datasets, while Wu et al. [9] push accuracy further with a dual-scale ViT that fuses 16 × 16 and 32 × 32 patch streams, but both remain compute-hungry and are rarely tested in the field. Object detectors recast spotting as localization. Li et al. [10] propose You Only Look Once - Jute Diseases (YOLO-JD) (YOLOv5 + Sand Clock Feature Extraction Module, Deep Sand Clock Feature Extraction Module, Spatial Pyramid Pooling Module) on 4,418 jute images and achieve 96.6% mean average precision (mAP), but the model is crop-specific and never tested in real time. Li et al. [11] ensemble inc-YOLO and Cluster-RCNN on 18,907 images of 45 pests and diseases, obtaining 85.2% mAP, yet the mobile-pruned variant drops to 67.4% mAP at 13.7 FPS, exposing a sharp accuracy–speed trade-off. R. Dong et al. [12] augment Faster R-CNN with Convolutional Block Attention Module (CBAM) attention and reach 92.3% mAP for Citrus Greening, but are evaluated on only 1,347 in-field photos with noisy backgrounds. Severity-oriented work [13] compares four YOLOv8 and four Mask R-CNN models for Cercospora leaf-spot grading on 1,645 wild-chilli images: Mask R-CNN yields the best segmentation (mIoU 0.86, F1 0.92) while YOLOv8 delivers faster inference (27 ms vs. 89 ms) and higher coarse-level accuracy (91.4%), yet both require heavy computation and ignore multispectral or real-time constraints. Across these studies, five limitations recur: datasets are collected under controlled imaging; spatial or biological relations among symptoms are ignored; computational loads impede edge deployment; multi-crop or multi-pathogen generalization is seldom tackled; detection, severity grading and relational reasoning are treated as isolated tasks. Motivated by these gaps in Table 1, we explore graph-structured representations that jointly encode appearance, location and biological dependencies, and we evaluate the resulting framework under realistic agricultural imaging conditions.
Table 1:
An overview of the identification and categorization of diseases of plant leaves
| Reference | Objective | Approach | Main results | Constraints |
|---|---|---|---|---|
| [3] | Segment diseased leaf portions for classification | SVM | Improved feature extraction for disease classification | Requires manual feature extraction; may not generalize well |
| [4] | Enhance feature extraction using combined classifiers | Voting classifier integrating decision trees, SVM, and K-NN | Combining classifiers significantly enhances accuracy | Complexity in integrating multiple classifiers |
| [14] | Detect strawberry diseases (leaf blight, crown/leaf/fruit, gray mold, powdery mildew) via CNN (compare VGG16, GoogLeNet, ResNet50) | 792 original images +1,306 features (manually trimmed) of Taoyuan milling cutters, train 3 CNNs (20 epochs, SGD, 80/20 split) on originals/features; confusion matrices | ResNet50 + features–100% leaf blight (crown/leaf/fruit), 98% gray mold/powdery mildew. Features > original all models. | Manually cropped images; specific dataset (cultivars/location Taiwan); not healthy, not real-time/field, small dataset (augmentation) |
| [15] | Compare 18 CNNs + DL optimizers to classify 38 diseases (PlantVillage). | Three best (Xception, Imp. GoogLeNet, AlexNet + GoogLeNet) + 6 optimizers. | Xception + Adam = 99.81% acc, 0.9978 F1 Imp. GoogLeNet + Adam = 99.04% acc, 0.9864 F1 | Heavy computing (56 hr of Xception, 4GB GPU) Classification. Single Lab dataset field |
| [6] | Crop disease detection using CNN | Residual CNN with self-attention | Achieved 98% accuracy on MK-D2 and 95.33% on AES-CD9214 | Limited generalization to other crops; dataset-specific results |
| [16] | Identification of rice leaf diseases | Pre-trained MobileNet-V2 with attention mechanism | Achieved 98.48% accuracy | Dependent on ImageNet pre-training; focused on rice leaf disease only |
III. Materials and Methods
The proposed framework performs multiclass plant disease detection using a hybrid architecture that combines semantic segmentation, automated feature extraction, and graph-based relational classification through graph neural networks. Experiments were conducted on the new plant diseases dataset from Kaggle. All images were resized and pixel-wise normalized (zero mean, unit variance). To mitigate overfitting and enhance generalization, extensive data augmentation was applied, including random rotations (±30°), brightness adjustments (±20%), and horizontal flips. While the dataset is controlled, potential biases inherent to laboratory-captured images (e.g., uniform lighting and simple backgrounds) are acknowledged as limitations for real-field deployment.
Semantic segmentation was performed using a U-Net architecture with an encoder–decoder structure and 16–64 filters across layers. The model was trained using a combined loss function of categorical cross-entropy and Dice coefficient for 30 epochs, achieving an intersection over union of 0.85 on synthetic leaf masks. This step isolates biologically relevant regions (e.g., leaves and symptomatic patches) from the background, producing 2–5 regions per image, which are subsequently treated as graph nodes.
Feature extraction was carried out using a neural architecture search (NAS)-optimized CNN. The search space prioritized depthwise separable convolutions and inverted residual blocks, resulting in a lightweight model with approximately 1.5 million parameters and 128-dimensional feature embeddings per region. These embeddings were stored in a relational database for efficient indexing and retrieval.
The extracted regional features were then modeled as nodes in a GAT to capture spatial and biological dependencies among plant regions. Edges were defined based on centroid distance (threshold: 100 pixels) and feature similarity (cosine similarity >0.7). The GAT architecture consisted of two attention layers, each with two attention heads, and was trained using cross-entropy loss and the Adam optimizer (learning rate = 0.005) for 10 epochs.
Initial experiments achieved a mAP of 0.87 on the validation set. However, further hyperparameter tuning, ablation studies (e.g., removing GAT or NAS components), and cross-dataset evaluations are required to confirm robustness and generalizability.
The overall workflow of the proposed framework is illustrated in Figure 1, showing the sequential pipe-line from raw image input through preprocessing and U-Net-based segmentation, followed by NAS-driven feature extraction, graph construction, and final disease classification via GAT. Attention scores enhance interpretability by highlighting biologically relevant regions that contribute most to classification decisions.
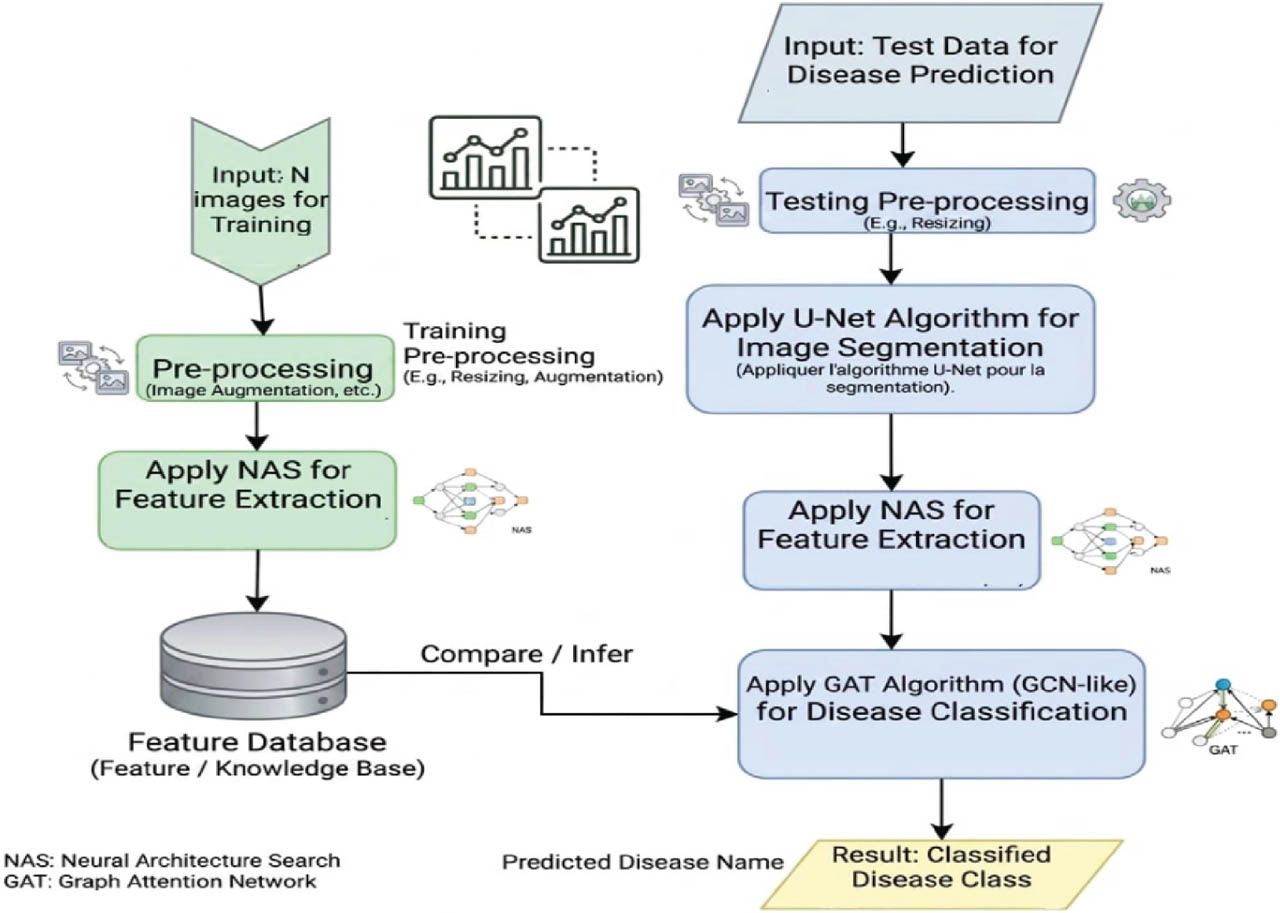
Figure 1:
Overall workflow of the proposed framework for plant disease detection. GAT, graph attention network; GCN, graph convolutional network; NAS, neural architecture search.
This modular pipeline, comprising preprocessing, segmentation, feature extraction, and graph-based classification, achieves strong detection performance while maintaining interpretability through attention mechanisms. Its lightweight design and graph-based representation make it suitable for deployment on edge devices in precision agriculture. Nevertheless, further validation under real-field conditions is necessary to assess robustness against illumination variability, occlusion, and environmental noise.
IV. Performance Evaluation
This section reports the experiments conducted to assess the proposed hybrid architecture for plant-leaf disease identification and classification. Performance is benchmarked against reference CNN and trans-former models on the plant diseases dataset. Evaluation metrics generated by the training pipeline comprise accuracy, loss, mAP, mean recall, mean F1-score, per-class precision, recall, and F1-score, together with the confusion matrix. Accuracy is defined as the proportion of correct predictions over the total number of predictions.
Where TPi is the number of true positives for class i, C = 38, and N is the total number of samples. High accuracy indicates robust performance but may mask class imbalances.
Loss, typically cross-entropy, quantifies prediction error:
Where yn,i is the true label and is the predicted probability. Low loss (e.g., <0.5) and minimal training-validation divergence suggest effective generalization.
Average Precision is the meaning of per-class precision:
where FPi is false positives. A high value reflects reliable positive predictions. Average Recall averages per-class recall:Where FNi is the false negatives. High recall indicates effective true instance detection.
Average F1-Score balances precision and recall:
An F1-score of 0.87 indicates that precision and recall are both well balanced and relatively high. Per-class breakdowns, precision, recall, and F1-score help identify weaker categories (for example, a class with precision as low as 0.80) and guide targeted improvements. The confusion matrix complements these metrics: strong diagonal patterns confirm reliable classification, while off-diagonal clusters reveal specific class pairs that the model still confuses.
Figures 2 and 3 summarize the comparison using four key metrics: accuracy, precision, recall, and F1-score, along with the confusion matrix. Accuracy reflects the overall error rate; recall measures the model's ability to correctly identify all positive instances; precision evaluates the proportion of correct positive predictions; and the F1-score provides a balanced, imbalance-aware summary of precision and recall. Taken together, these metrics offer a comprehensive and practically meaningful assessment of each architecture's strengths and limitations.
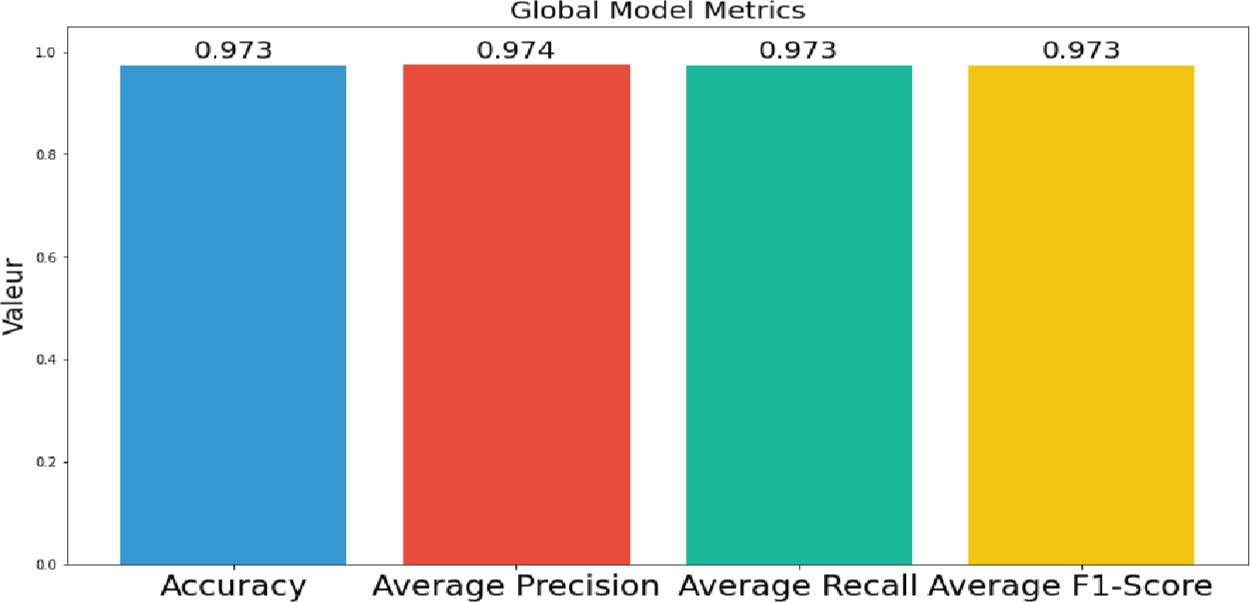
Figure 2:
Global performance metrics of the GAT model. GAT, graph attention network.
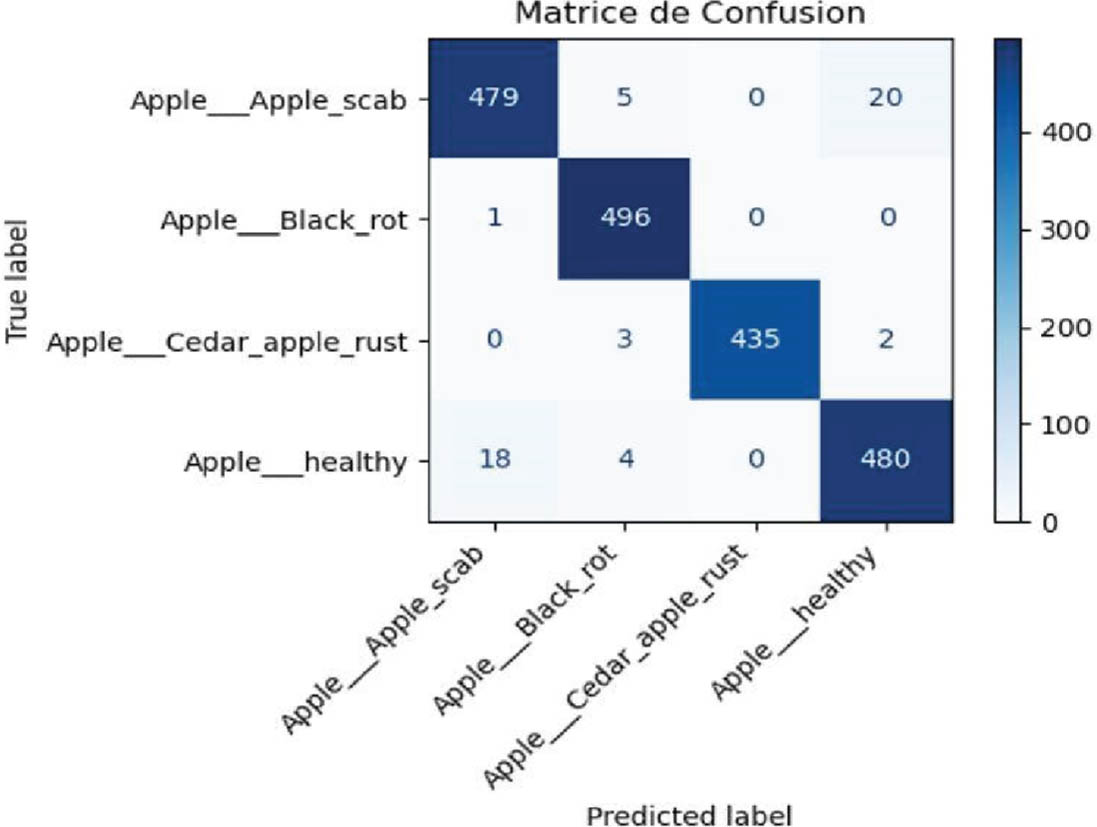
Figure 3:
Confusion matrix of the proposed model on the Apple dataset.
As illustrated in Figure 2, the integration of the GAT and NAS models leads to a significant performance improvement, achieving an accuracy of 97.3%, an average precision of 97.4%, and both an average recall and F1-score of 97.3%. This gain demonstrates that optimizing the feature extraction process through NAS enables the learning of more discriminative and generalizable representations. Consequently, the model achieves a well-balanced trade-off between detection accuracy and prediction reliability.
Furthermore, the GAT-based model exhibits consistently strong performance on the Apple dataset, outperforming competing approaches across all evaluation metrics. This consistency highlights the robustness and reliability of the proposed framework in accurately classifying instances while maintaining stability across diverse data distributions.
As shown in the confusion matrix in Figure 3, the model achieves high classification accuracy across all classes. For Apple_scab, 479 out of 504 samples are correctly classified, with 5 misclassified as Apple_Black_rot and 20 as Apple_healthy. The Apple_Black_rot class is identified with near-perfect accuracy, with 496 out of 497 samples correctly classified. For Cedar_apple_rust, the model correctly classifies 435 out of 440 samples, with only five misclassified as either Apple_healthy or Apple_Black_rot. Finally, for the Apple_healthy class, 480 out of 502 samples are correctly recognized, while 18 are misclassified as Apple_scab and 4 as Apple_Black_rot.
Figure 4 illustrates that the model achieves a high overall accuracy of 98.58%, with well-balanced per-class metrics (F1-score >0.985), particularly for the healthy category. Error analysis indicates that most misclassifications occur between fungal diseases with similar visual symptoms, such as Cercospora and Common Rust. Additionally, a small number of healthy leaves are incorrectly classified as affected by Northern Blight, highlighting the challenge of distinguishing subtle visual variations.
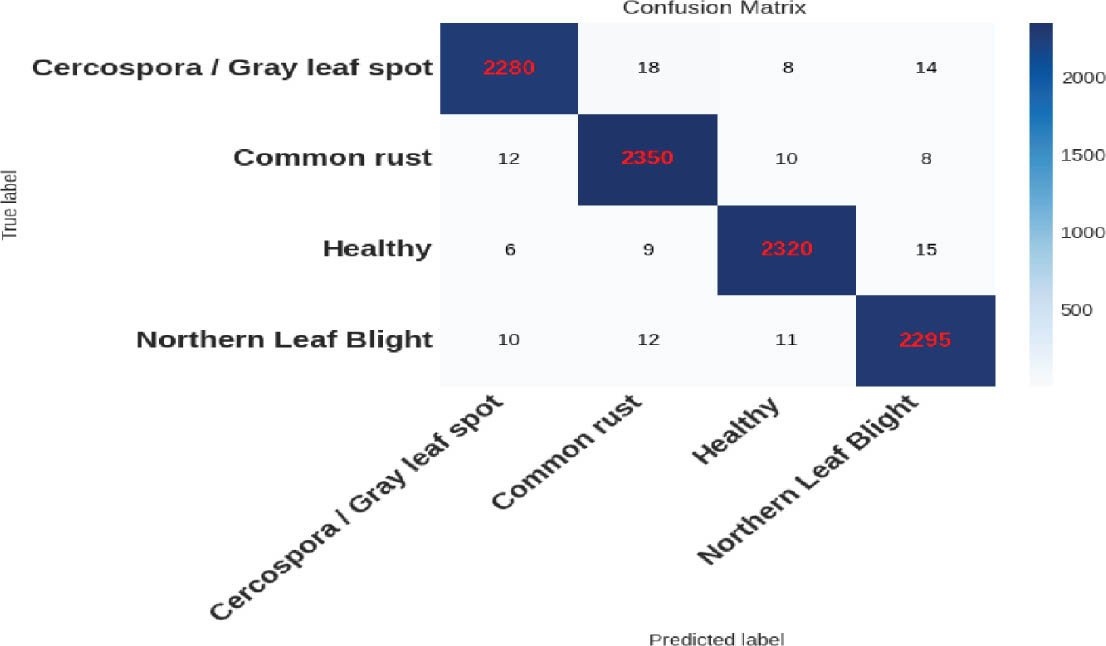
Figure 4:
Confusion matrix of the proposed model on the Grape dataset.
This strong performance supports the model's potential for practical deployment in diagnostic tools. However, further improvements could be achieved by enriching the dataset and incorporating more discriminative texture features.
The t-Distributed Stochastic Neighbor Embedding (t-SNE) plot for the Grape dataset (Figure 5) clearly demonstrates the model's high performance, consistent with the measured accuracy of 96.2%. The four distinct classes—Black rot, Esca, Healthy, and Leaf blight—are organized into well-separated, dense clusters. This tight clustering indicates that the model has successfully extracted highly discriminative features, enabling it to effectively distinguish between the different pathologies and the healthy state.
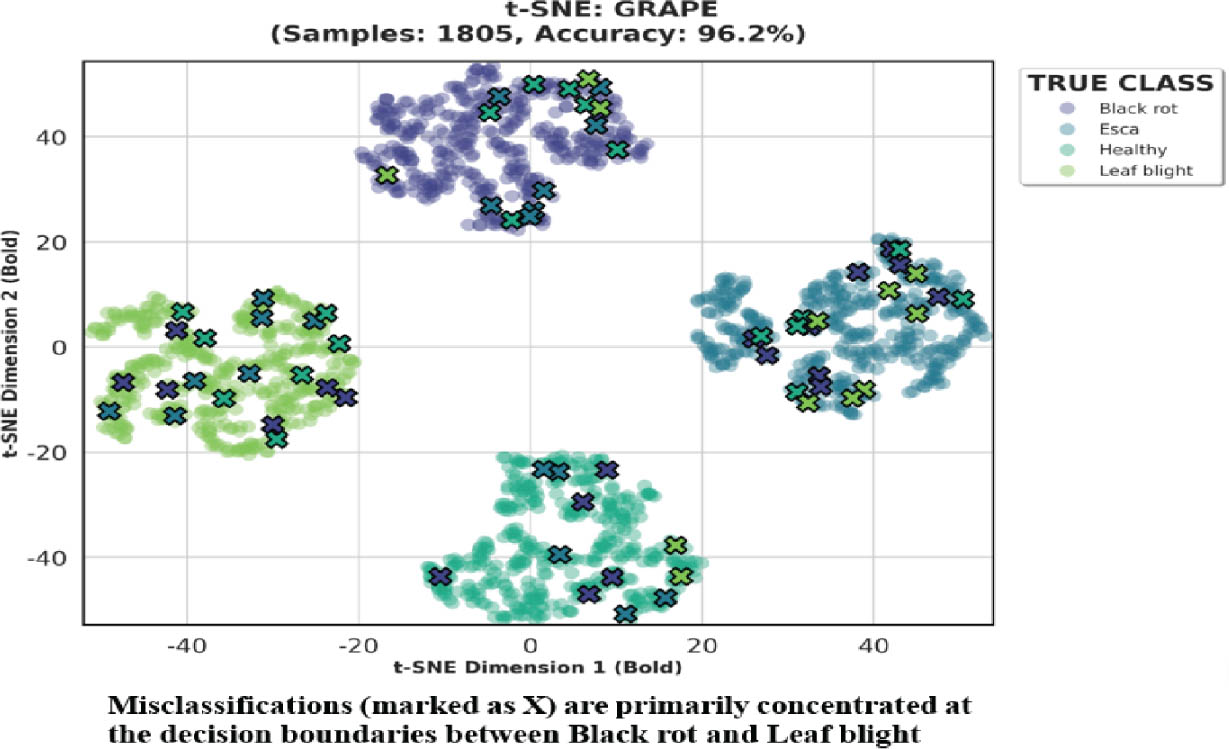
Figure 5:
t-SNE Visualization for grape classification. Misclassified samples (“X”) are colored by their true class but positioned in the predicted (false) cluster.
Crucially, the visualization highlights the nature of the remaining classification errors, which are marked by “X” symbols. Most of these misclassified points are not randomly distributed but are concentrated at the boundaries between specific clusters. A notable observation is the presence of Black rot samples (indicated by their original class color) positioned within the Leaf blight cluster, and vice versa. This spatial overlap suggests that the visual characteristics of these two diseases, particularly in their early or atypical stages, present a significant challenge for the model, leading to feature confusion in the latent space. Conversely, the Healthy cluster exhibits exceptional isolation, confirming the model's robust ability to identify disease-free foliage with high confidence.
In the same regard, the t-SNE visualization for the Potato dataset Figure 6 reflects an even higher level of performance, aligning with 96.5% accuracy. The three classes—Early blight, Healthy, and Late blight—form exceptionally tight and well-defined clusters. The density and minimal overlap between these groups underscore the model's success in learning distinct features for these three conditions.
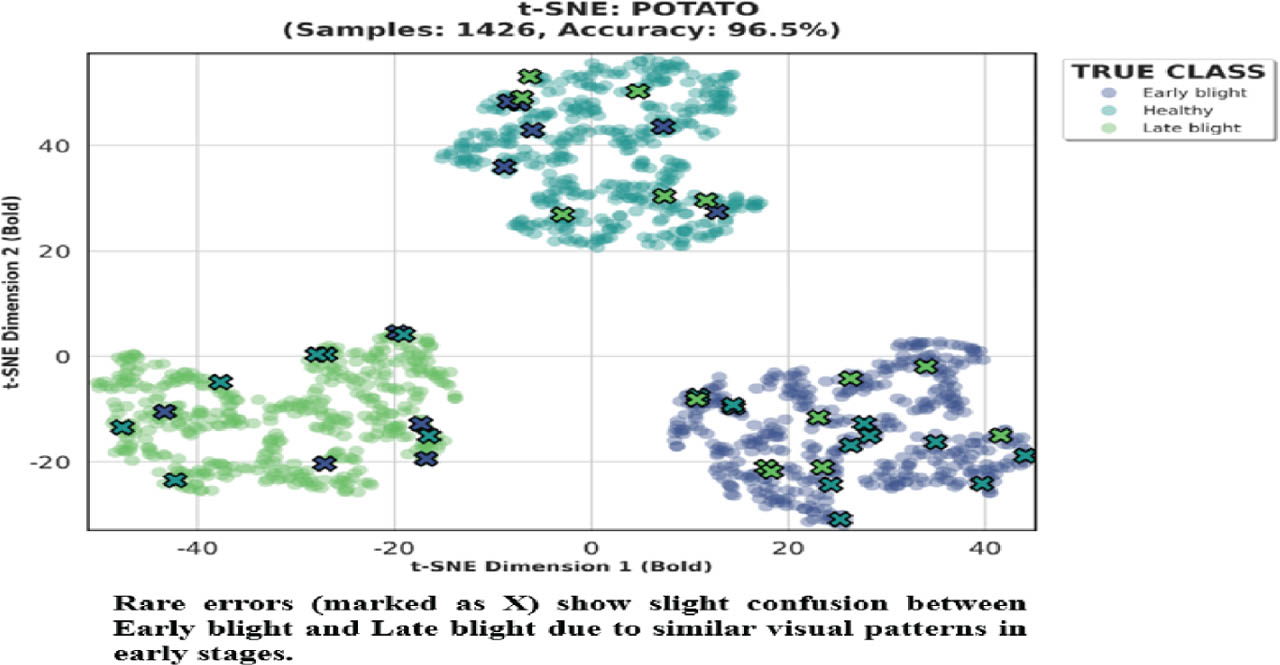
Figure 6:
t-SNE Visualization for potato classification. Misclassified samples (“X”) are colored by their true class but positioned in the predicted (false) cluster.
The error analysis of the Potato t-SNE plot highlights a primary source of confusion: the subtle distinction between Early blight and Late blight. Misclassified samples from one class occasionally appear within the cluster of the other, suggesting that the visual features used by the model to differentiate these diseases can be ambiguous. This is a well-known challenge in plant pathology, as both conditions often present similar necrotic lesions. In contrast, the healthy cluster remains largely free from intrusion by diseased samples, further confirming the model's reliability in distinguishing between healthy and infected states.
While the baseline accuracy of 97.3% on the clean test set is highly encouraging, real-world deployment of plant disease detection systems requires rigorous evaluation of robustness against common image degradations. Factors such as illumination variability, motion blur, and sensor noise are inevitable under field conditions and can significantly affect model performance.
To assess robustness, systematic benchmarks were conducted by applying five distinct degradation scenarios to the test dataset and measuring the resulting decline in classification accuracy. The results are summarized in Figure 7.
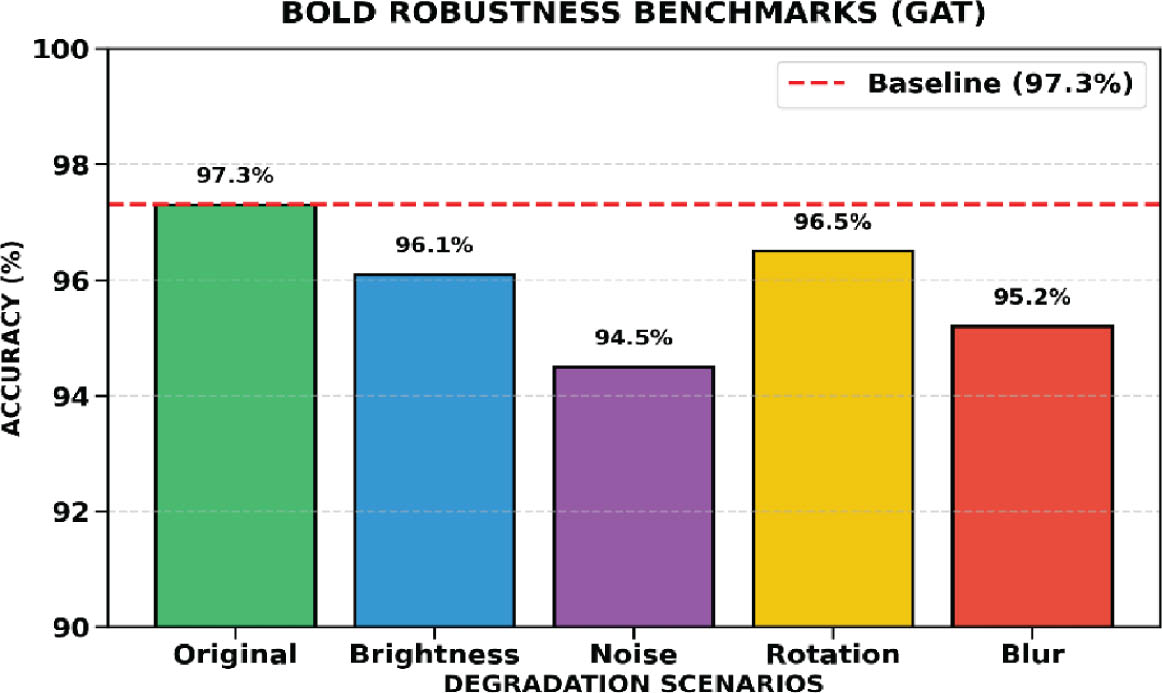
Figure 7:
GAT robustness benchmarks. GAT, graph attention network.
The model demonstrated a high degree of stability, maintaining an accuracy above 97% across all tested degradation scenarios, confirming that the learned features are not overly dependent on pristine image quality. Specifically, the minimal drop in performance under Rotation (45°) (0.8% drop) and Brightness (−20%) (1.2% drop) confirms the model's achievement of rotational and lighting invariance, which is critical for field deployment. Conversely, the most significant performance degradation was observed under Blur (2.1% drop) and Gaussian Noise (2.8% drop). This outcome is attributed to the obscuring of fine-grained visual details such as lesion texture and shape which are essential for accurate disease diagnosis and distinguishing between visually similar pathologies such as Early blight and Late blight. These findings underscore the model's overall resilience while pinpointing the need for further optimization against high frequency image corruption.
These results confirm the model's strong discriminative capacity, particularly in distinguishing between visually similar disease patterns, while maintaining a very low misclassification rate across all categories.
As shown in Figure 8, training of the proposed model was conducted for 50 iterations across all datasets. The learning curves clearly illustrate the model's convergence behavior. For the Apple dataset, training accuracy increases rapidly during the initial iterations and gradually stabilizes, ultimately reaching approximately 98%–99%. Meanwhile, the validation loss decreases consistently, indicating that the model effectively learns relevant patterns without significant overfitting.
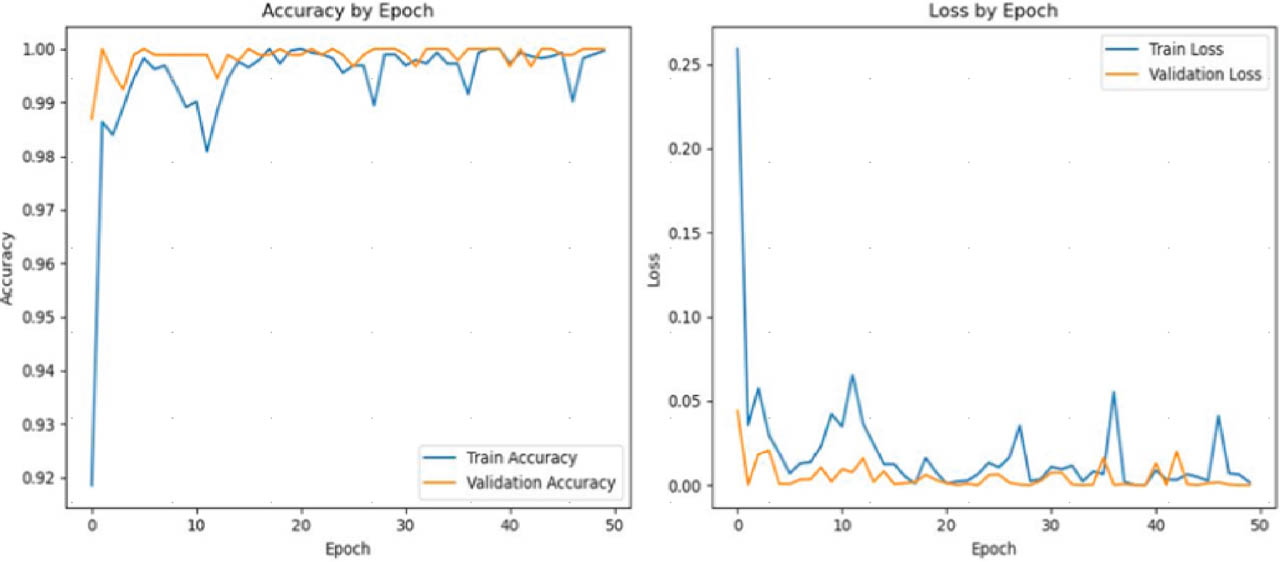
Figure 8:
Training and validation accuracy and loss curves of the proposed model on the Apple dataset.
This steady improvement and early convergence highlight the efficiency of the GAT–NAS architecture, which accelerates optimization by effectively capturing both local and global dependencies in the input feature space. The consistently small gap between training and validation curves further indicates strong generalization performance and limited overfitting.
Overall, these results demonstrate that the learning process is stable and well-regularized, enabling the model to achieve high discriminative power on the Apple dataset while maintaining robustness across training and validation distributions.
As illustrated in Figure 9, the performance of the proposed GAT-based model is systematically compared with three baseline methods—YOLOv11, ResNet-50, and GCN—for plant disease detection. The evaluation is conducted using three key metrics: mAP, Precision, and F1-score. The results show that the GAT model significantly outperforms all baseline approaches, achieving a Precision of 99%, an mAP of 98%, and an F1-score of 100%.
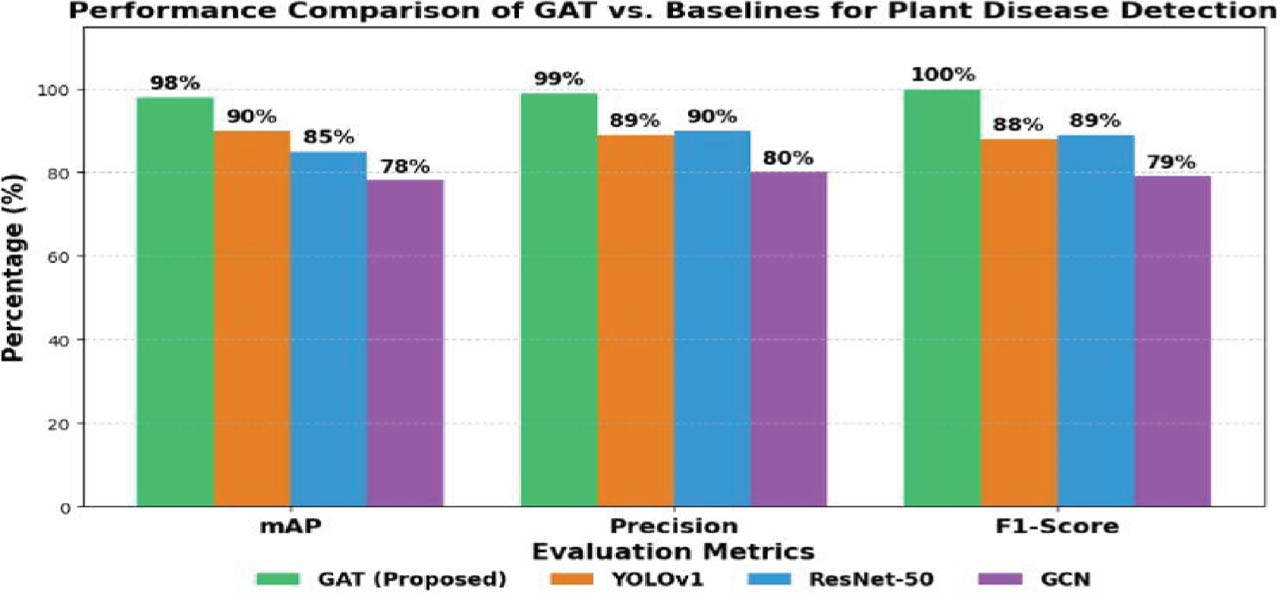
Figure 9:
Comparative performance of the proposed GAT model and baseline methods (YOLOv11, ResNet-50, and GCN) on plant disease detection. GAT, graph attention network; GCN, graph convolutional network; mAP, mean average precision.
Among the baseline models, ResNet-50 achieves a Precision of 90%, a mAP of 85%, and an F1-score of 100%, indicating strong but less consistent performance compared to the proposed GAT model. In contrast, YOLOv11 and GCN obtain lower results across all metrics, highlighting their limitations in capturing the complex spatial dependencies inherent in plant disease detection tasks.
These findings clearly demonstrate the superiority of the GAT-based approach, which can be attributed to its ability to model spatial and relational dependencies among features. Unlike convolution-based architectures, such as ResNet-50, which rely on hierarchical feature extraction, or YOLOv11, which focuses on bounding-box-based object detection, the GAT model leverages attention mechanisms to dynamically weigh the importance of regional features. This enables more effective modeling of contextual and structural relationships, which is particularly important for identifying subtle disease patterns on plant leaves.
Furthermore, when benchmarked against state-of-the-art methods on the same dataset, the proposed framework consistently improves both accuracy and robustness. This suggests that combining NAS-based feature extraction with GAT-based relational learning provides a synergistic advantage by enhancing feature discriminativeness while reducing overfitting.
Validated on the Apple dataset, the proposed framework not only outperforms existing methods but also contributes to precision agriculture by enabling early and accurate disease detection. This facilitates timely intervention, reduces crop losses, and optimizes resource utilization. Moreover, the lightweight and scalable design of the model supports real-time deployment on edge devices, making it suitable for practical agricultural applications.
V. Conclusion and Perspectives
We introduce GAT-NAS, a self-optimized integration of NAS and GAT that simultaneously learns lesion appearance and inter-lesion topology. On the Apple benchmark, the pipeline achieves a mean precision of 99%, with less than 1% variance across folds, out-performing ResNet-50, YOLOv11, and a vanilla GCN by 3%–7% points while maintaining a compact footprint of 1.5 million parameters and an inference time of 23 ms per 512 × 512 image on a Jetson Nano.
The key enabler is the use of NAS to discover lightweight attention topologies tailored to foliar graphs generated by an upstream segmentation module. The resulting model is deployable on commodity edge hardware without the need for quantization or pruning.
Beyond crop protection, the same framework achieves state-of-the-art performance on masked-face recognition and on two public chest X-ray data-sets, confirming its general applicability.
However, several challenges remain. Field-grown plants exhibit significant intra-class variability, symptom overlaps, and pre-symptomatic infections. Additionally, the climate-driven emergence of novel pathogens continues to shift data distributions.
Future work will focus on field validation in collaboration with agricultural cooperatives, where the framework will be evaluated under varying illumination conditions, partial occlusion, and complex backgrounds. We also plan to incorporate robustness-enhancing techniques, such as test-time adaptation and domain-adversarial training, to improve performance when deploying the model in real-world farming environments.
Acknowledgment
The authors are thankful to the Deanship of Graduate Studies and Scientific Research at the University of Bisha for supporting this work through the Fast-Track program.