
Table 1:
Sample dataset of patients' MI risk study.
| PID | Gender | Age (years) | Stress level | Blood sugar | Resp. rate (breaths/min) | Heart rate (bpm) | Blood pressure (SBP/DBP) | BMI status | Comorbidities | Lifestyle factors |
|---|---|---|---|---|---|---|---|---|---|---|
| 2 | M | 77 | High | Elevated | 22 | 63 | 126/84 | Normal | Heart disease, diabetes | Non-smoker, healthy diet |
| 7 | M | 43 | High | Normal | 20 | 81 | 118/84 | Obese | Heart disease, insomnia | Smoker, junk food |
| 9 | M | 50 | Medium | Normal | 18 | 83 | 111/84 | Normal | None | Smoker, junk food |
| 17 | M | 23 | Medium | Normal | 19 | 83 | 113/86 | Normal | Sleep apnea | Healthy food, active |
| 21 | M | 55 | Low | Normal | 20 | 85 | 126/85 | Normal | None | Non-smoker, active |
| 1 | F | 37 | High | Elevated | 23 | 60 | 124/86 | Over weight | Stress disorder | Smoker, junk food |
| 4 | F | 41 | High | Normal | 22 | 99 | 118/72 | Obese | Sleep apnea | Sedentary, junk food |
| 5 | F | 25 | Medium | Normal | 21 | 69 | 138/76 | Obese | Sleep apnea | Smoker, junk food |
| 8 | F | 72 | Low | Normal | 18 | 96 | 135/77 | Normal | None | Healthy food, active |
| 15 | F | 89 | Low | Normal | 17 | 98 | 127/87 | Normal | None | Non-smoker, balanced |

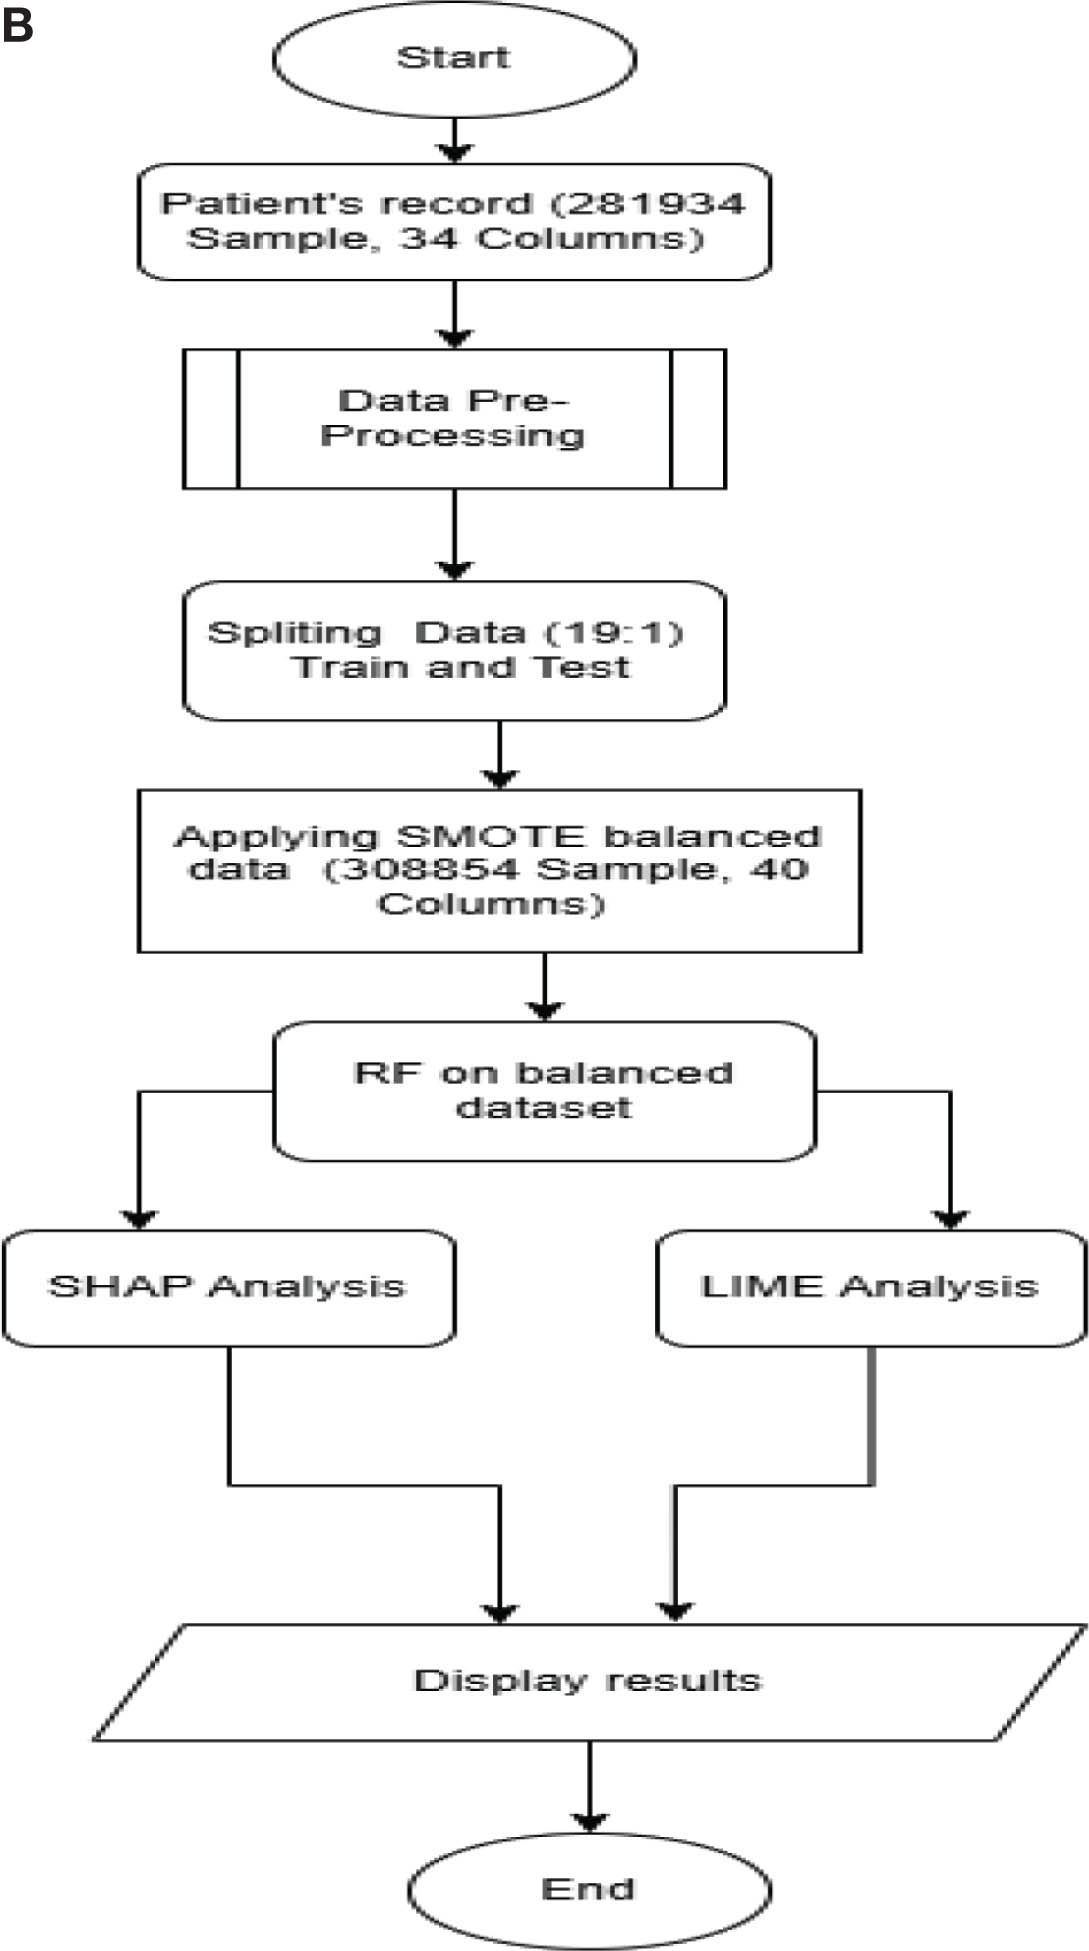
Figure 1:
(A) Evaluation of MI risk with the execution of SVM. (B) MI risk with the execution of SMOTE. ELU, exponential linear unit; MI, myocardial infarction; NB, Naïve Bayes; RF, random forest; SHAP, Shapley additive explanations; SMOTE, synthetic minority oversampling technique; SVM, support vector machine.
Table 2:
Decision boundary comparison.
| Method | Samples properties | Result |
|---|---|---|
| SVM-based: Imbalanced data |
| Boundary optimized for the majority class Anomalies misclassified as normal (high false negatives—dangerous for medical diagnosis) |
| SMOTE-based: Balanced data |
| Boundary fairly separates both classes Better classification of the minority class (Better sensitivity—critical for early detection) |
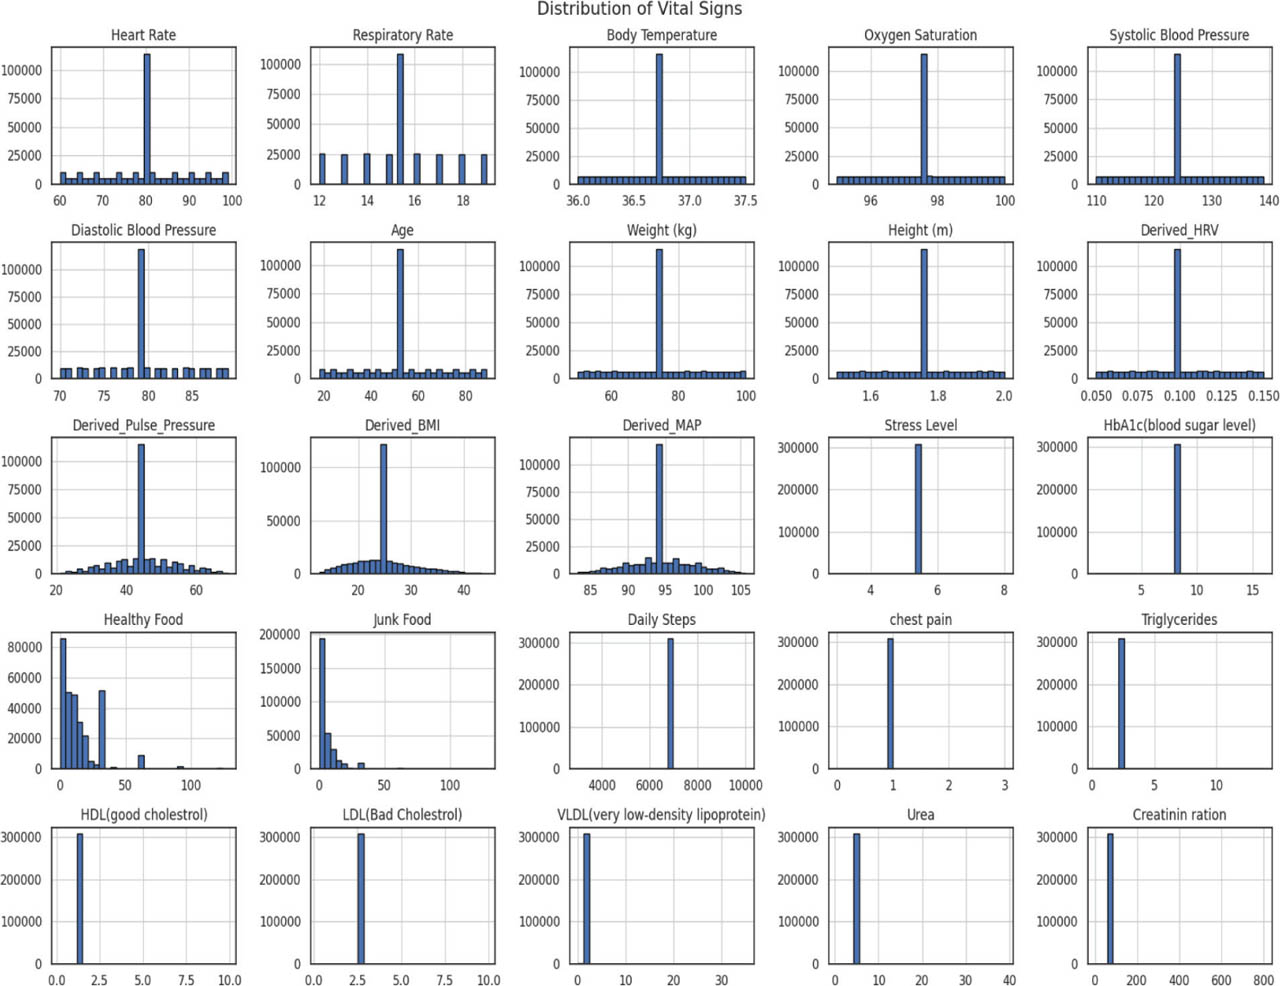
Figure 2:
Distribution plot of patients' vitals. BMI, body mass index; VLDL, very low-density lipoprotein.
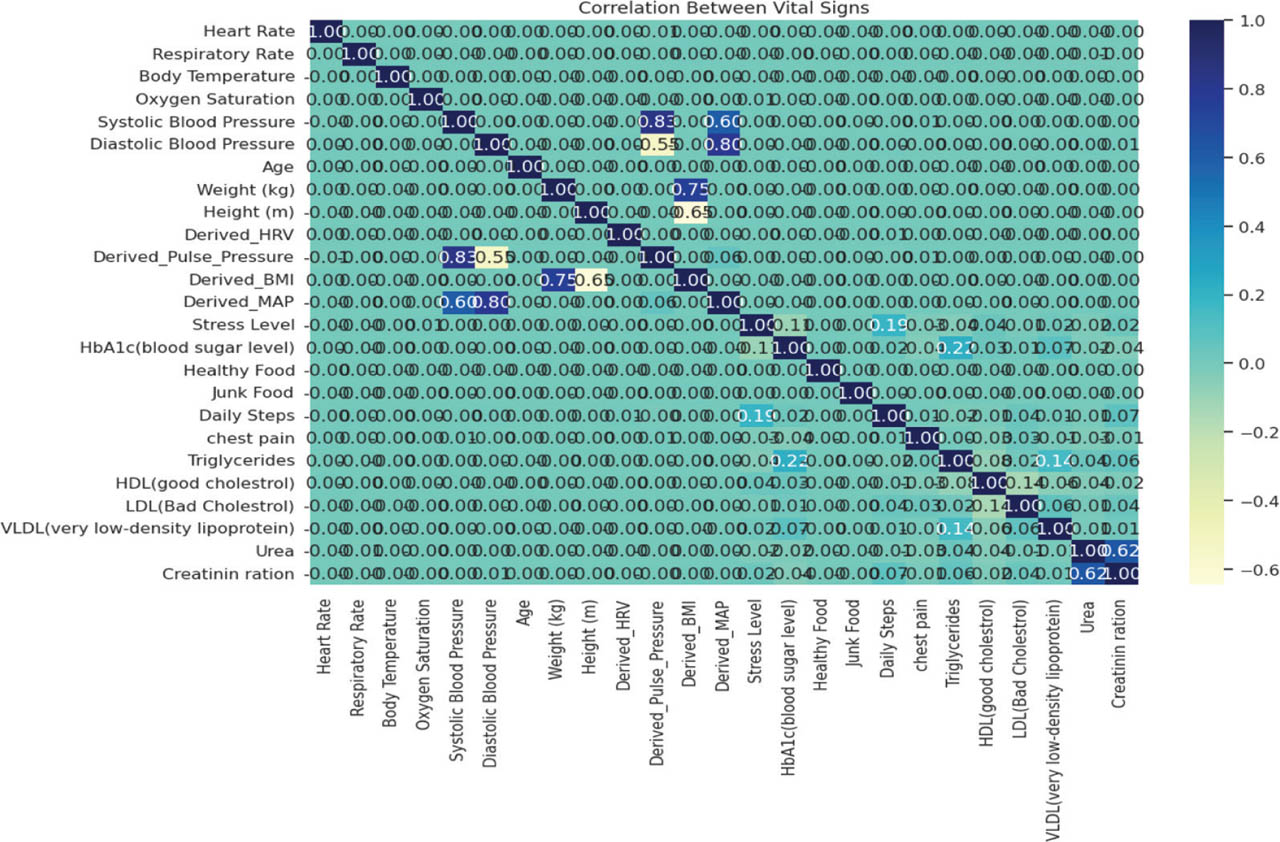
Figure 3:
Correlation heat map for vitals. BMI, body mass index; VLDL, very low-density lipoprotein.
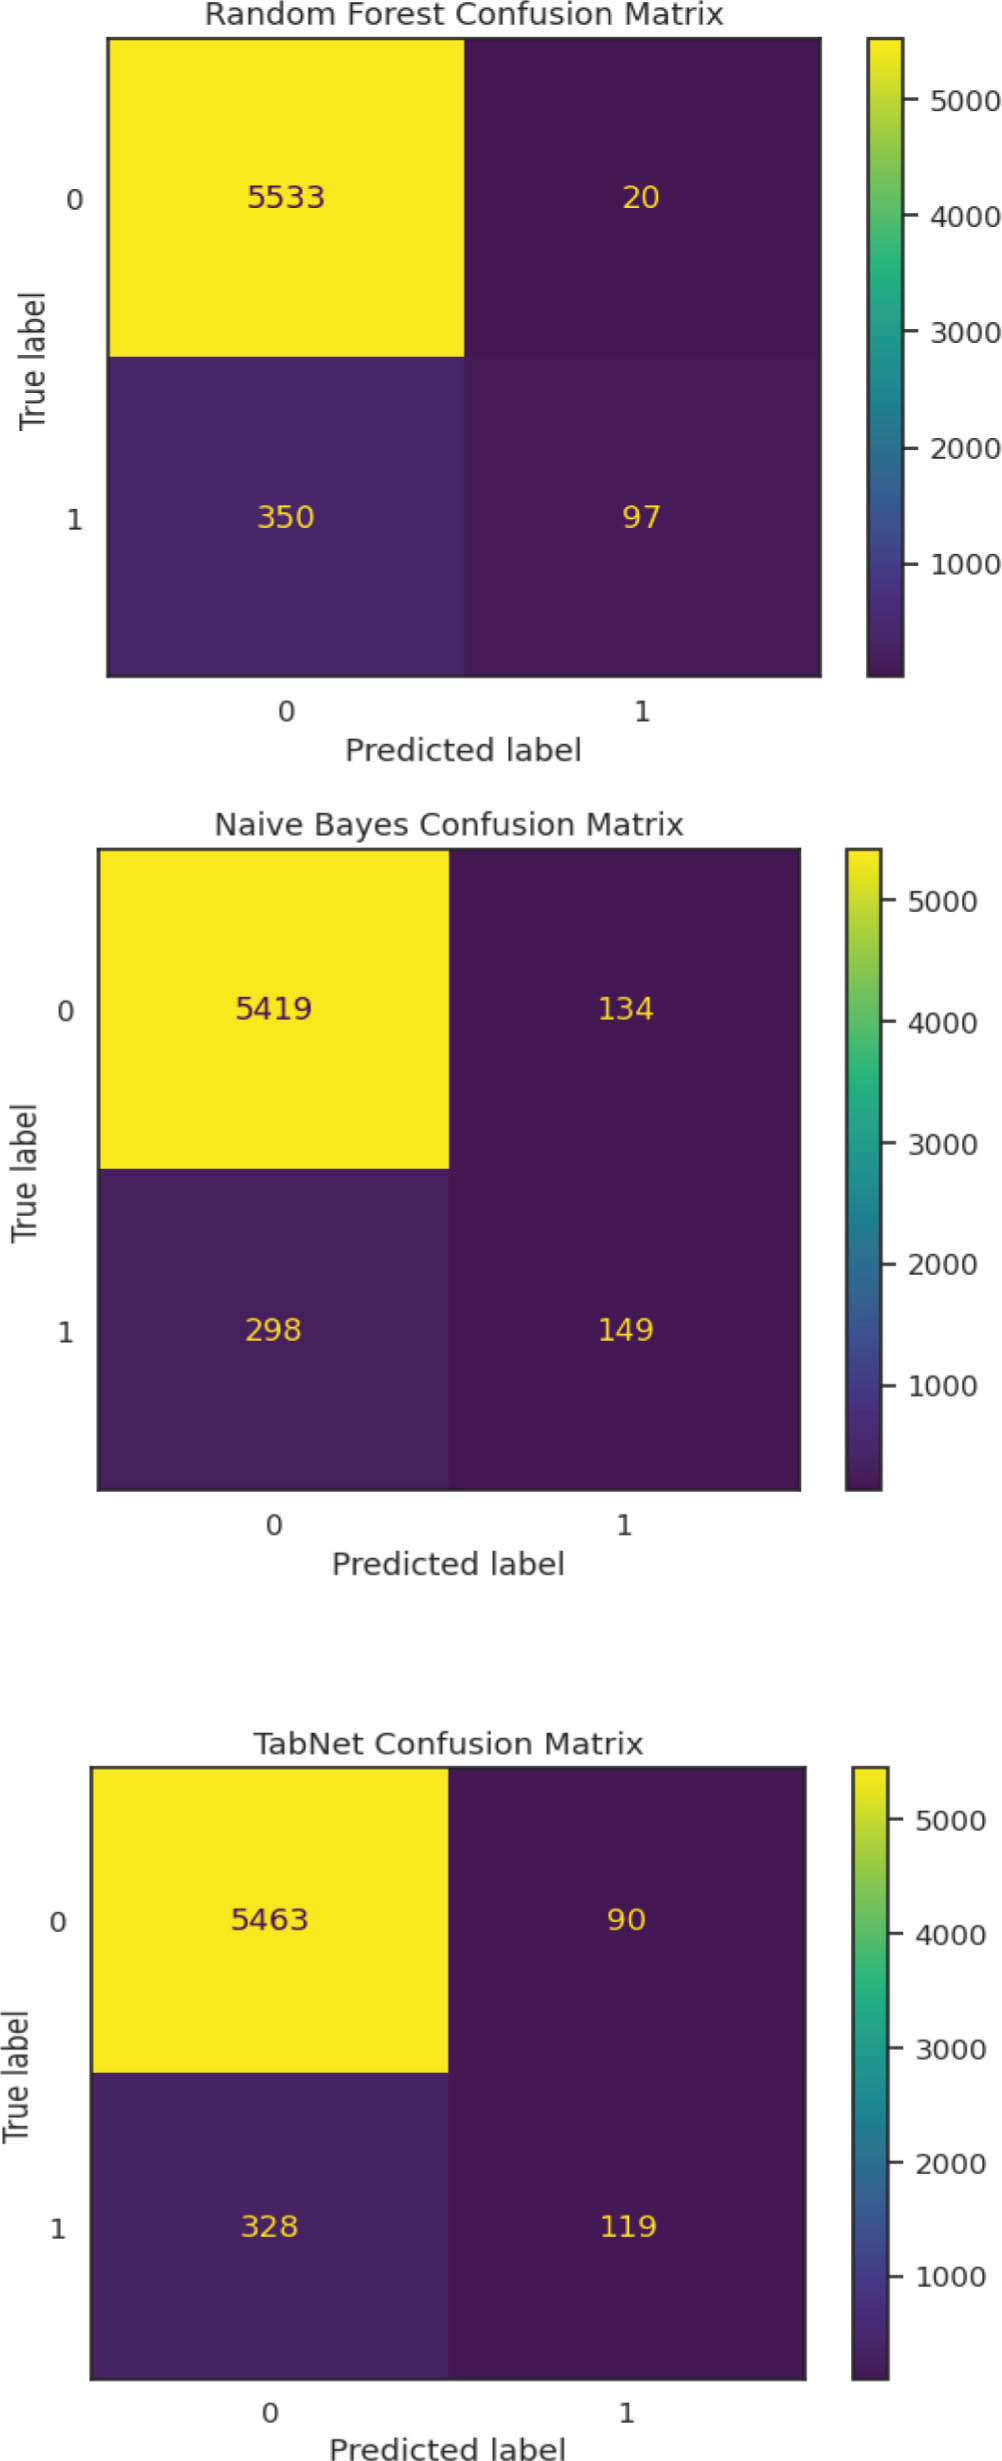
Figure 4:
Confusion matrix for models TabNet, RF, NB. NB, Naïve Bayes; RF, random forest.
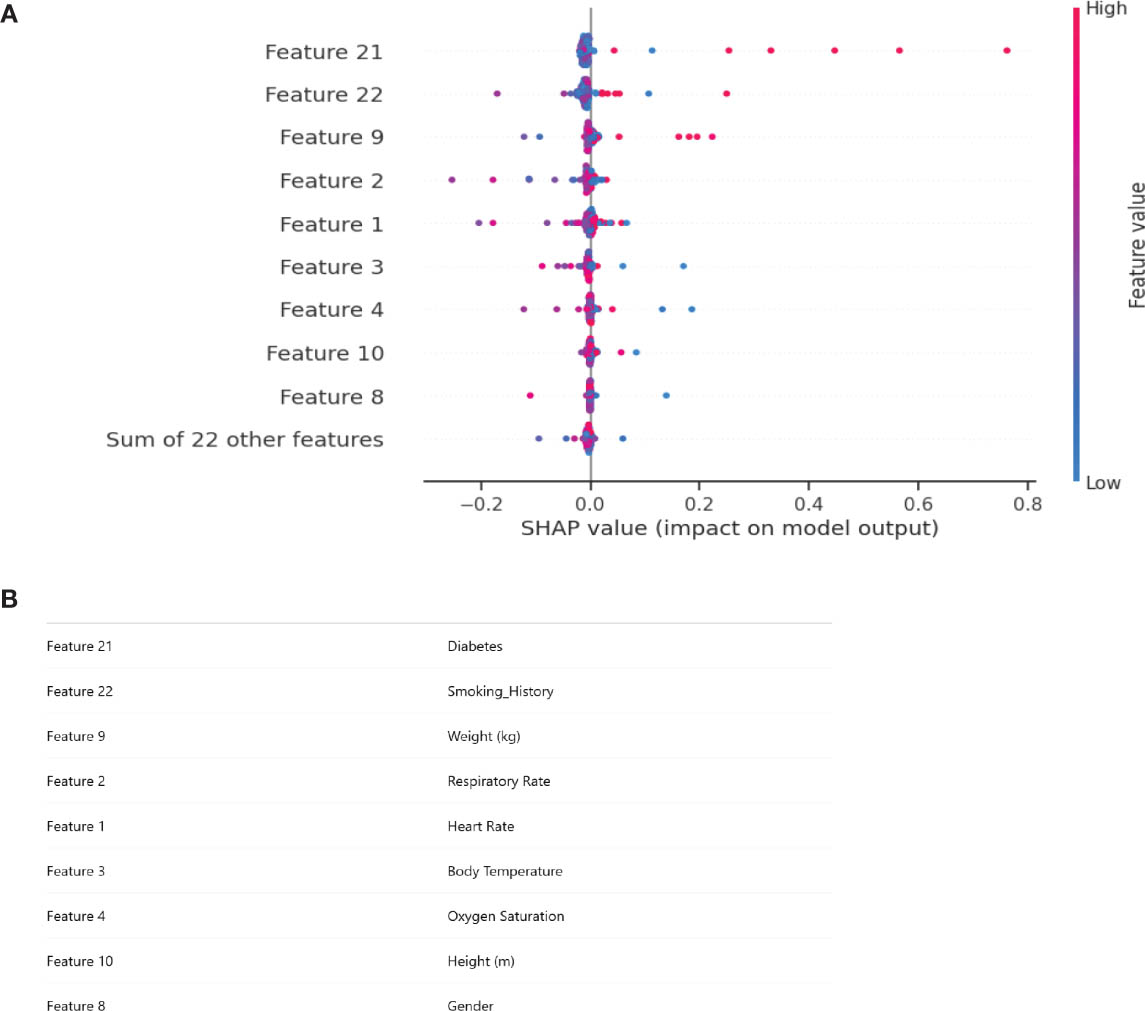
Figure 5:
(A) Feature impact on model output. (B) Feature impact on model output. SHAP, Shapley additive explanations.
Table 4:
Model performance of RF.
| Precision | Recall | F1 score | Support | |
|---|---|---|---|---|
| 0 | 0.94 | 1.00 | 0.97 | 5,553 |
| 1 | 0.82 | 0.21 | 0.33 | 447 |
| Accuracy | 0.94 | 6,000 | ||
| Macro avg | 0.88 | 0.60 | 0.65 | 6,000 |
| Weighted avg | 0.93 | 0.94 | 0.92 | 6,000 |
Table 5:
Model performance of NB.
| Precision | Recall | F1 score | Support | |
|---|---|---|---|---|
| 0 | 0.95 | 0.98 | 0.96 | 5,553 |
| 1 | 0.53 | 0.33 | 0.41 | 447 |
| Accuracy | 0.93 | 6,000 | ||
| Macro avg | 0.74 | 0.65 | 0.68 | 6,000 |
| Weighted avg | 0.92 | 0.93 | 0.92 | 6,000 |
Table 6:
Model performance of TabNet.
| Precision | Recall | F1 score | Support | |
|---|---|---|---|---|
| 0 | 0.94 | 0.98 | 0.96 | 5,553 |
| 1 | 0.57 | 0.27 | 0.36 | 447 |
| Accuracy | 0.93 | 6,000 | ||
| Macro avg | 0.76 | 0.63 | 0.66 | 6,000 |
| Weighted avg | 0.92 | 0.93 | 0.92 | 6,000 |
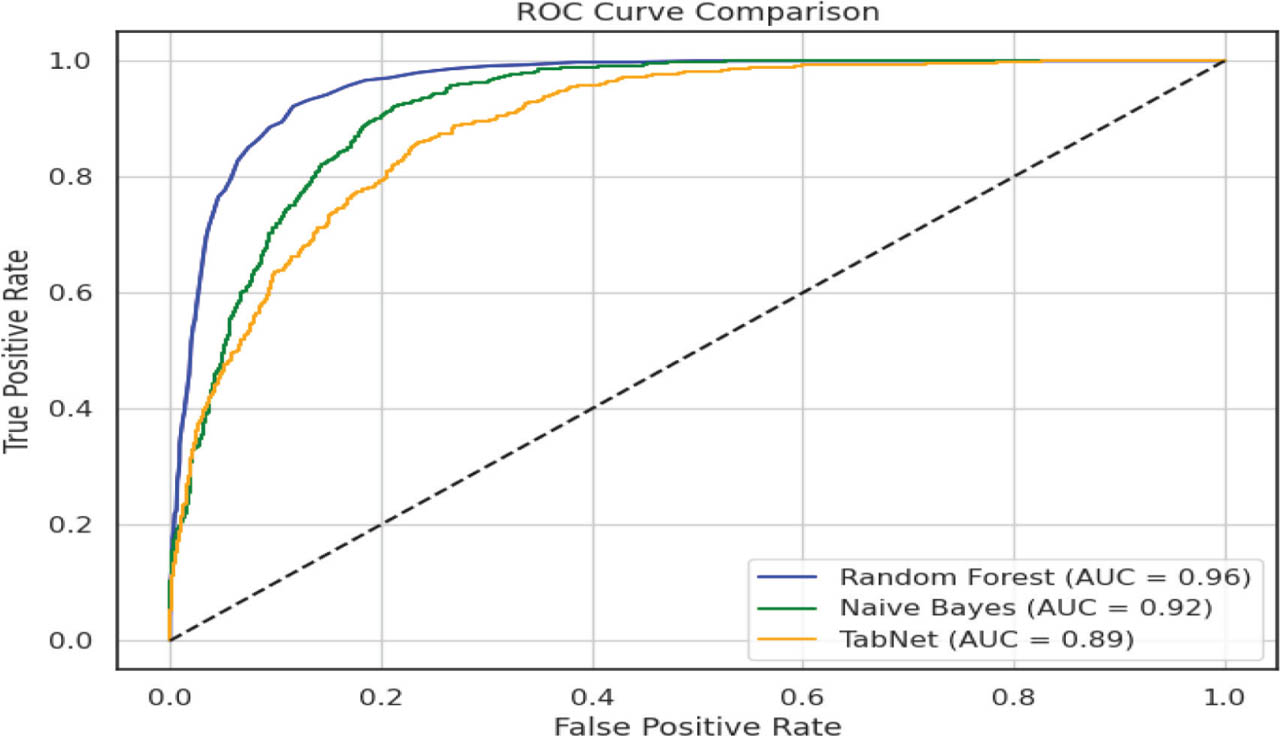
Figure 6:
ROC curve comparison of OC curve comparison of TabNet, and RF. NB, Naïve Bayes; RF, random forest.
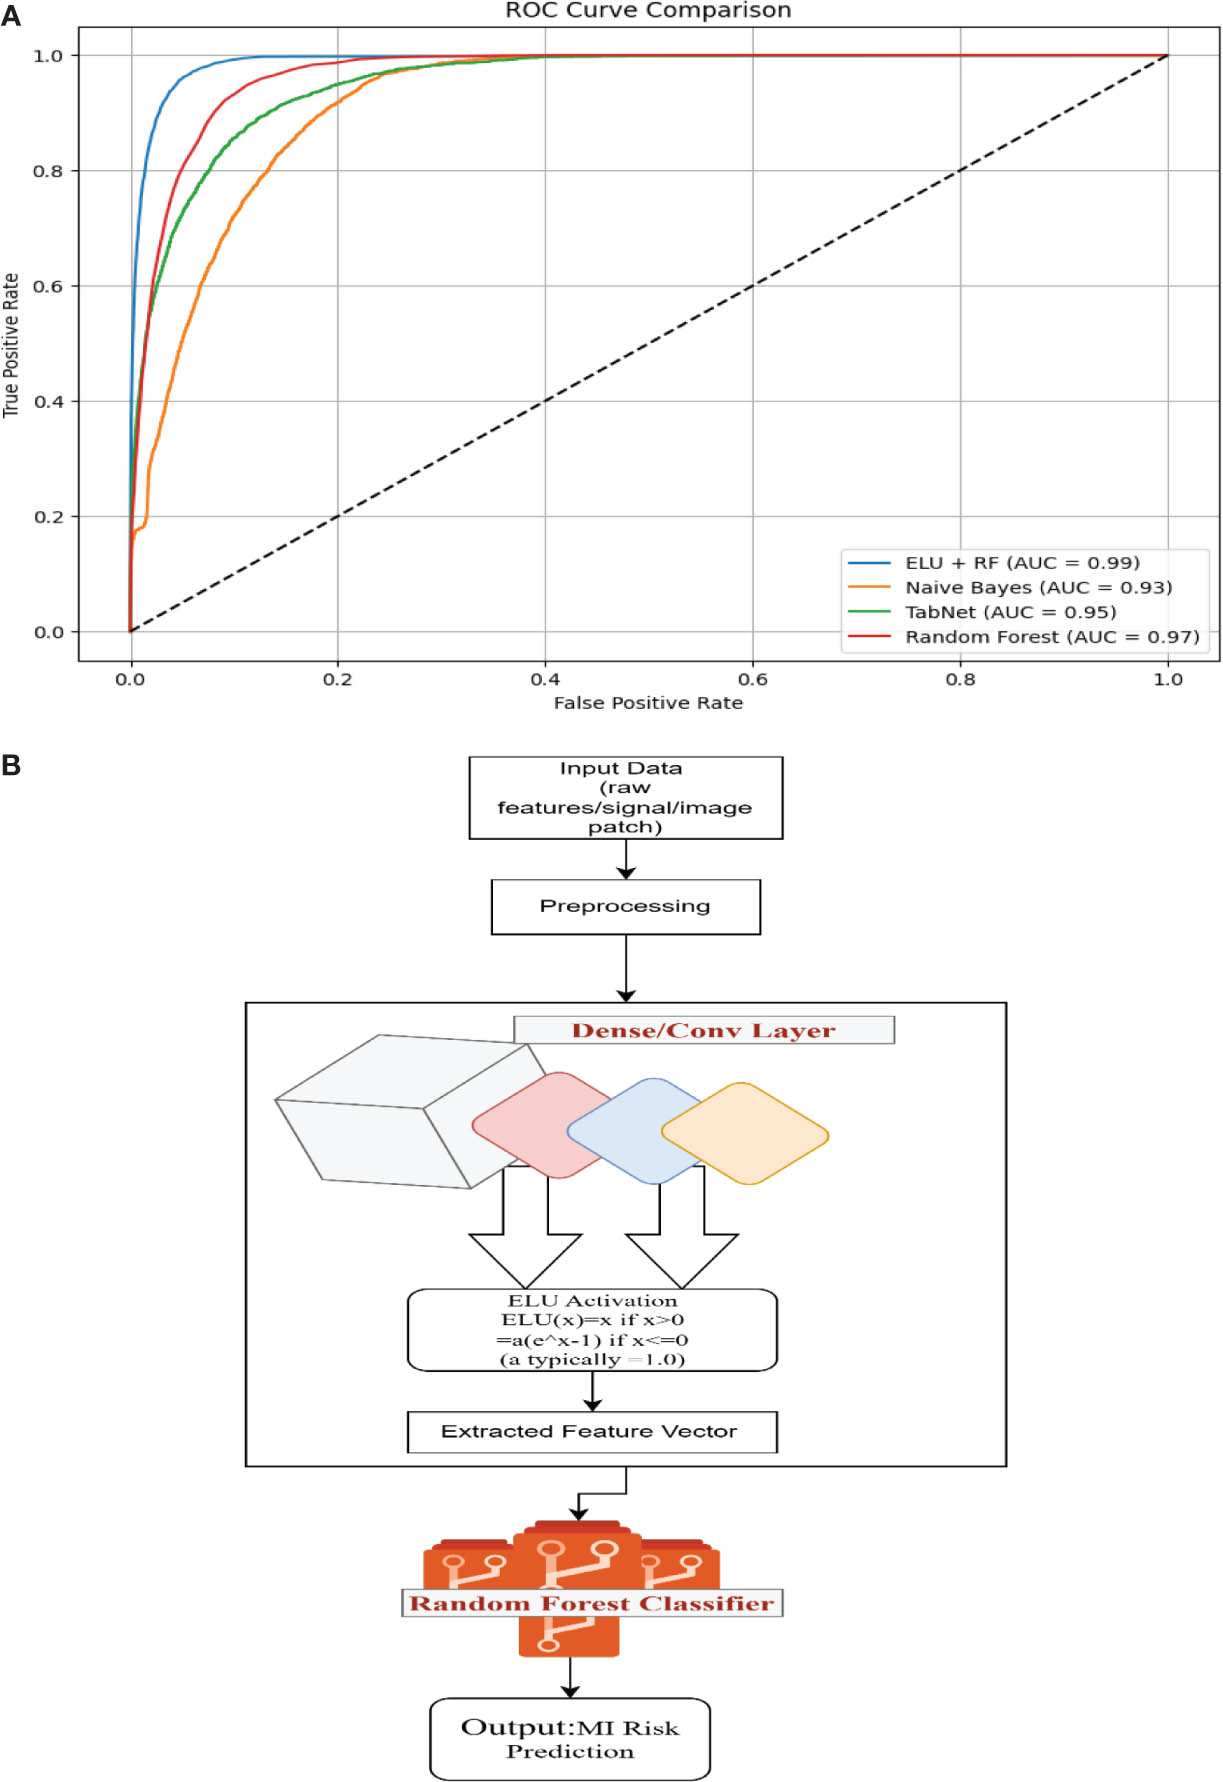
Figure 7:
(A) ROC curve comparison of the enhancing approach. (B) Usage of ELU in the feature extraction layer prior to the RF. ELU, exponential linear unit; MI, myocardial infarction; NB, Naïve Bayes; RF, random forest.
Table 7:
Model performance of ELU on RF.
| Precision | Recall | F1 score | Support | |
|---|---|---|---|---|
| Class 0 | 0.98 | 0.99 | 0.99 | 5,553 |
| Class 1 | 0.90 | 0.85 | 0.88 | 447 |
| Accuracy | - | - | 0.97 | 6,000 |
| Macro avg | 0.94 | 0.92 | 0.93 | 6,000 |
| Weighted avg | 0.97 | 0.97 | 0.97 | 6,000 |
Table 8A:
Data summary.
| Summary | Values |
|---|---|
| Total_samples | 308,854 |
| Total_columns | 40 |
| Total_attributes | 399 |
| Training_sample | 306,186 |
| Test_sample | 92,657 |
| Target_column | Risk |
| Target_classes | 2 |
| Class_training | {0:153093,1:153093} |
| Class_test | {0:65612,1:27045} |
Table 8B:
Classification report.
| Precision | Recall | F1 score | Support | |
|---|---|---|---|---|
| Class 0 | 1.00 | 0.99 | 1.00 | 65,612 |
| Class 1 | 0.98 | 1.00 | 0.99 | 27,045 |
| Accuracy | - | - | 0.99 | 92,657 |
| Macro avg | 0.99 | 1.00 | 0.99 | 92,657 |
| Weighted avg | 0.99 | 0.99 | 0.99 | 92,657 |
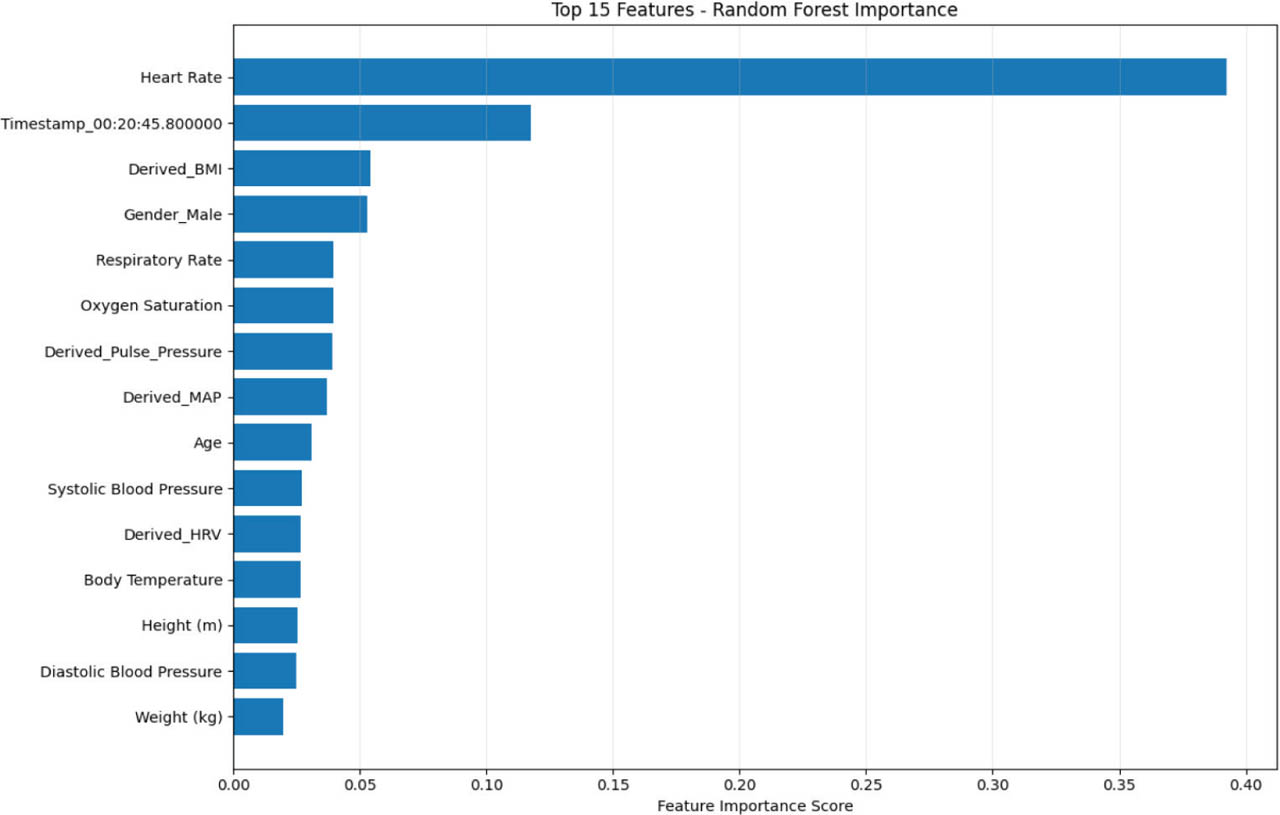
Figure 8:
Investigation of feature importance related to the feature vector. BMI, body mass index; RF, random forest.
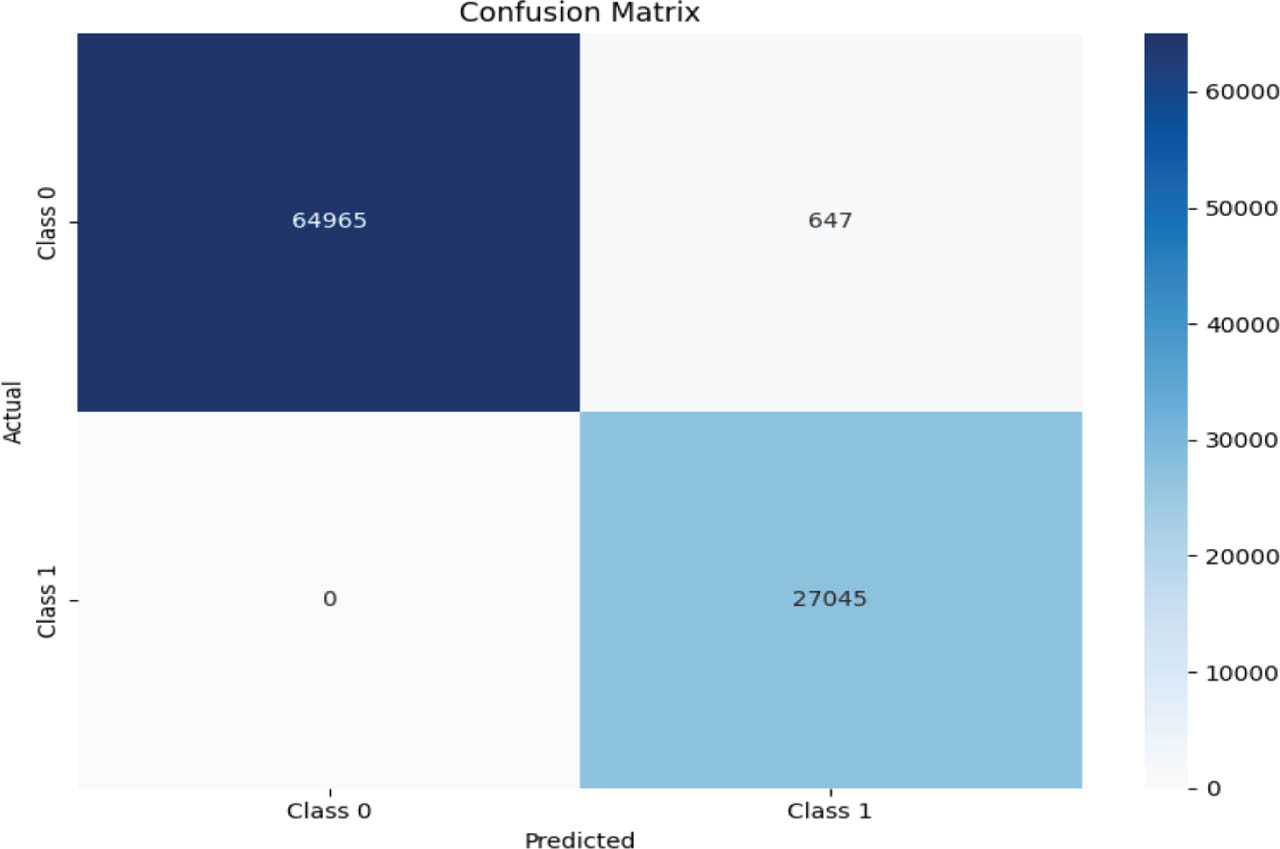
Figure 9:
Confusion matrix of RF following SMOTE. RF, random forest; SMOTE, synthetic minority oversampling technique.
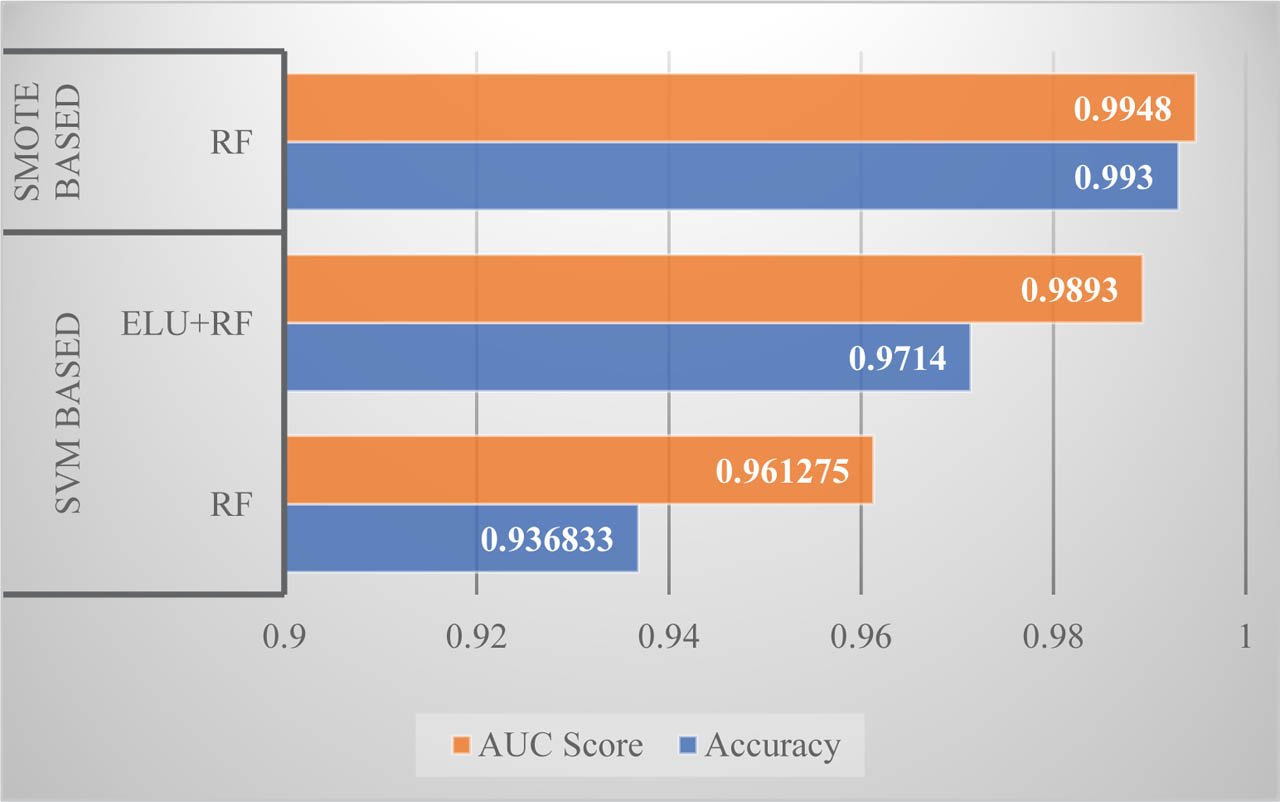
Figure 10:
Comparison of improved accuracy and AUC. ELU, exponential linear unit; RF, random forest; SMOTE, synthetic minority oversampling technique; SVM, support vector machine.
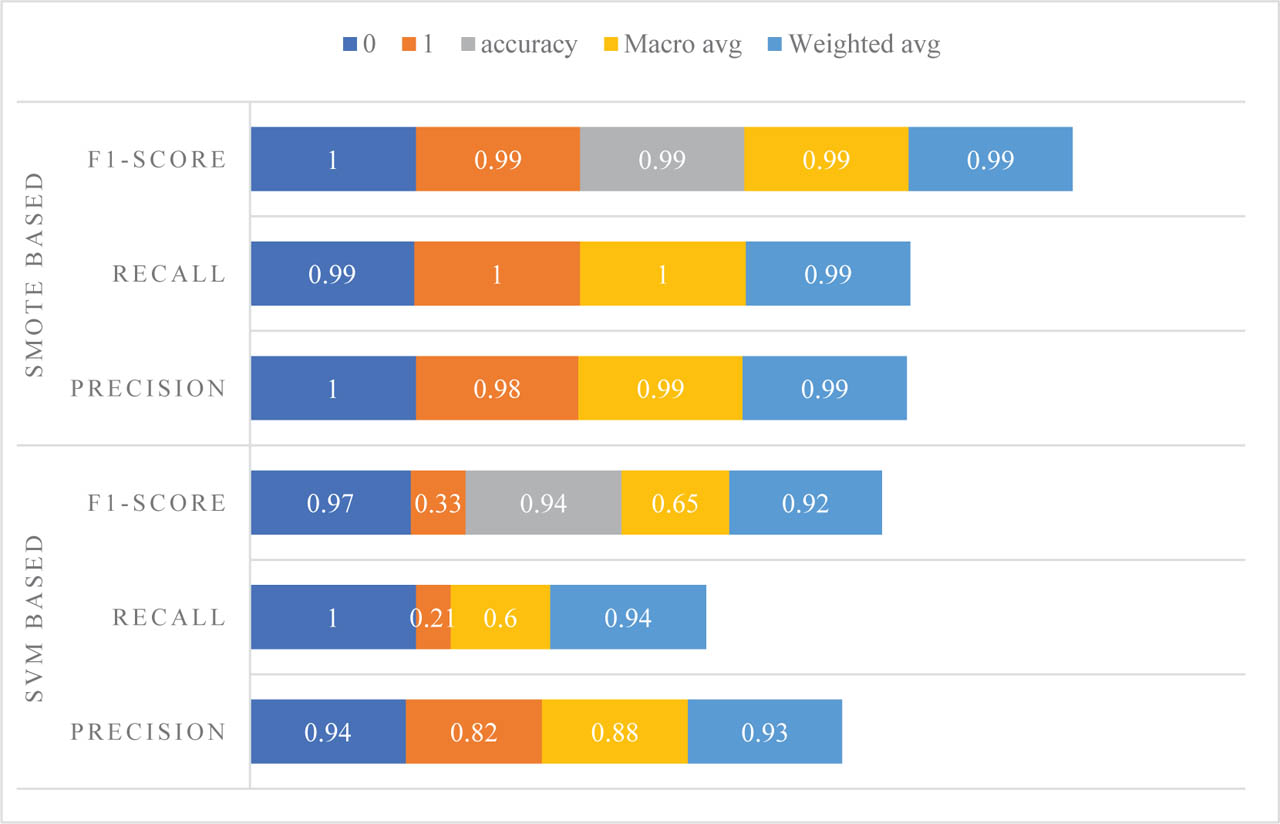
Figure 11:
Metrics comparison of RF. RF, random forest; SMOTE, synthetic minority oversampling technique; SVM, support vector machine.
Table 9:
Classification report of ELU on RF.
| Precision | Recall | F1 score | Support | |
|---|---|---|---|---|
| Class 0 | 1.00 | 0.99 | 1.00 | 65,612 |
| Class 1 | 0.98 | 0.99 | 0.99 | 27,045 |
| Accuracy | - | - | 0.99 | 92,657 |
| Macro avg | 0.99 | 1.00 | 0.99 | 92,657 |
| Weighted avg | 0.99 | 0.99 | 0.99 | 92,657 |
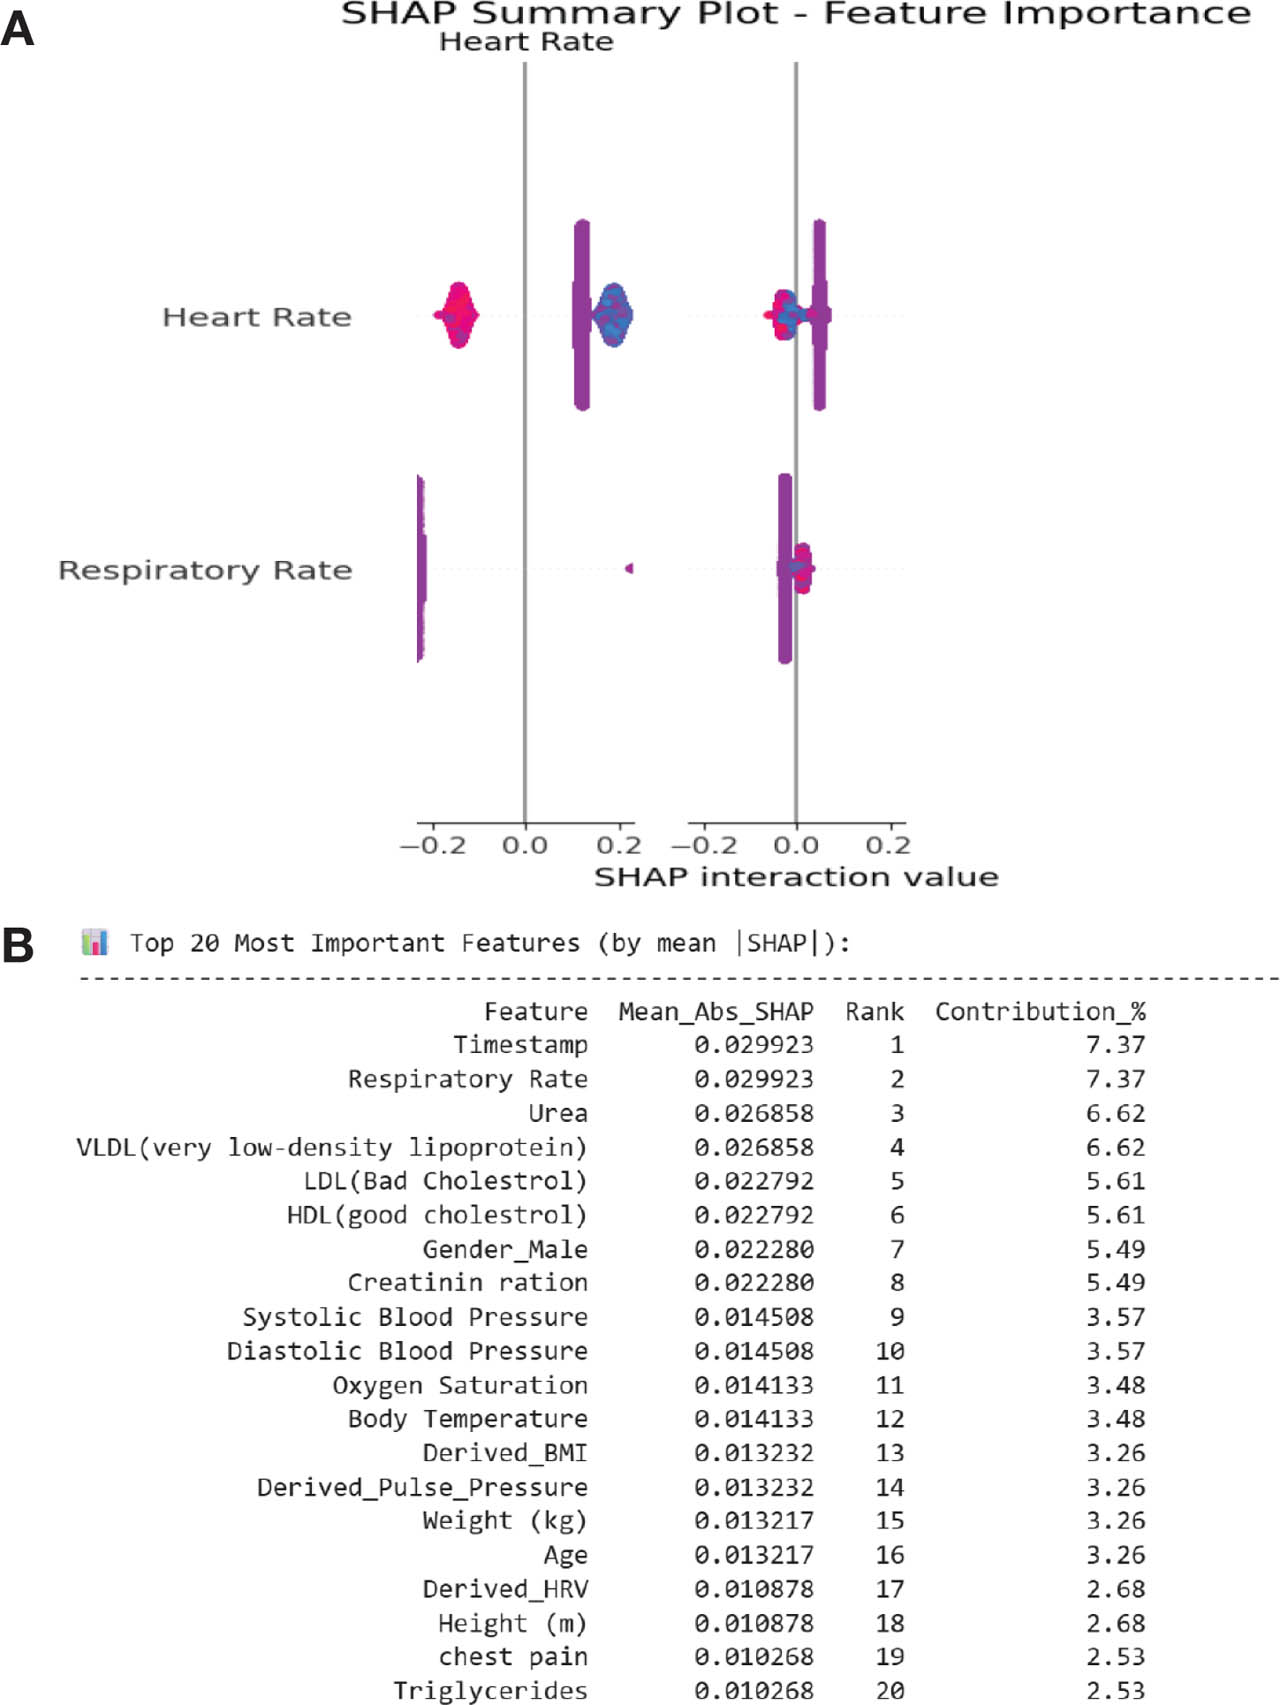
Figure 12:
(A) SHAP for two dominant features. (B) Mean SHAP for features. BMI, body mass index; SHAP, Shapley additive explanations; VLDL, very low-density lipoprotein.
Table 10:
Samples and their properties.
| Samples | Properties |
|---|---|
| Sample 1 | Sample index: 82,496; true label: 1 (Class 1); predicted probabilities: [0.26460299 0.73539701]; predicted class: 1 (Class 1) |
| Sample 2 | Sample index: 51,516; true label: 0 (Class 0); predicted probabilities: [0.60369369 0.39630631]; predicted class: 0 (Class 0) |
| Sample 3 | Sample index: 55,756; true label: 0 (Class 0); predicted probabilities: [0.624137 0.375863]; predicted class: 0 (Class 0) |
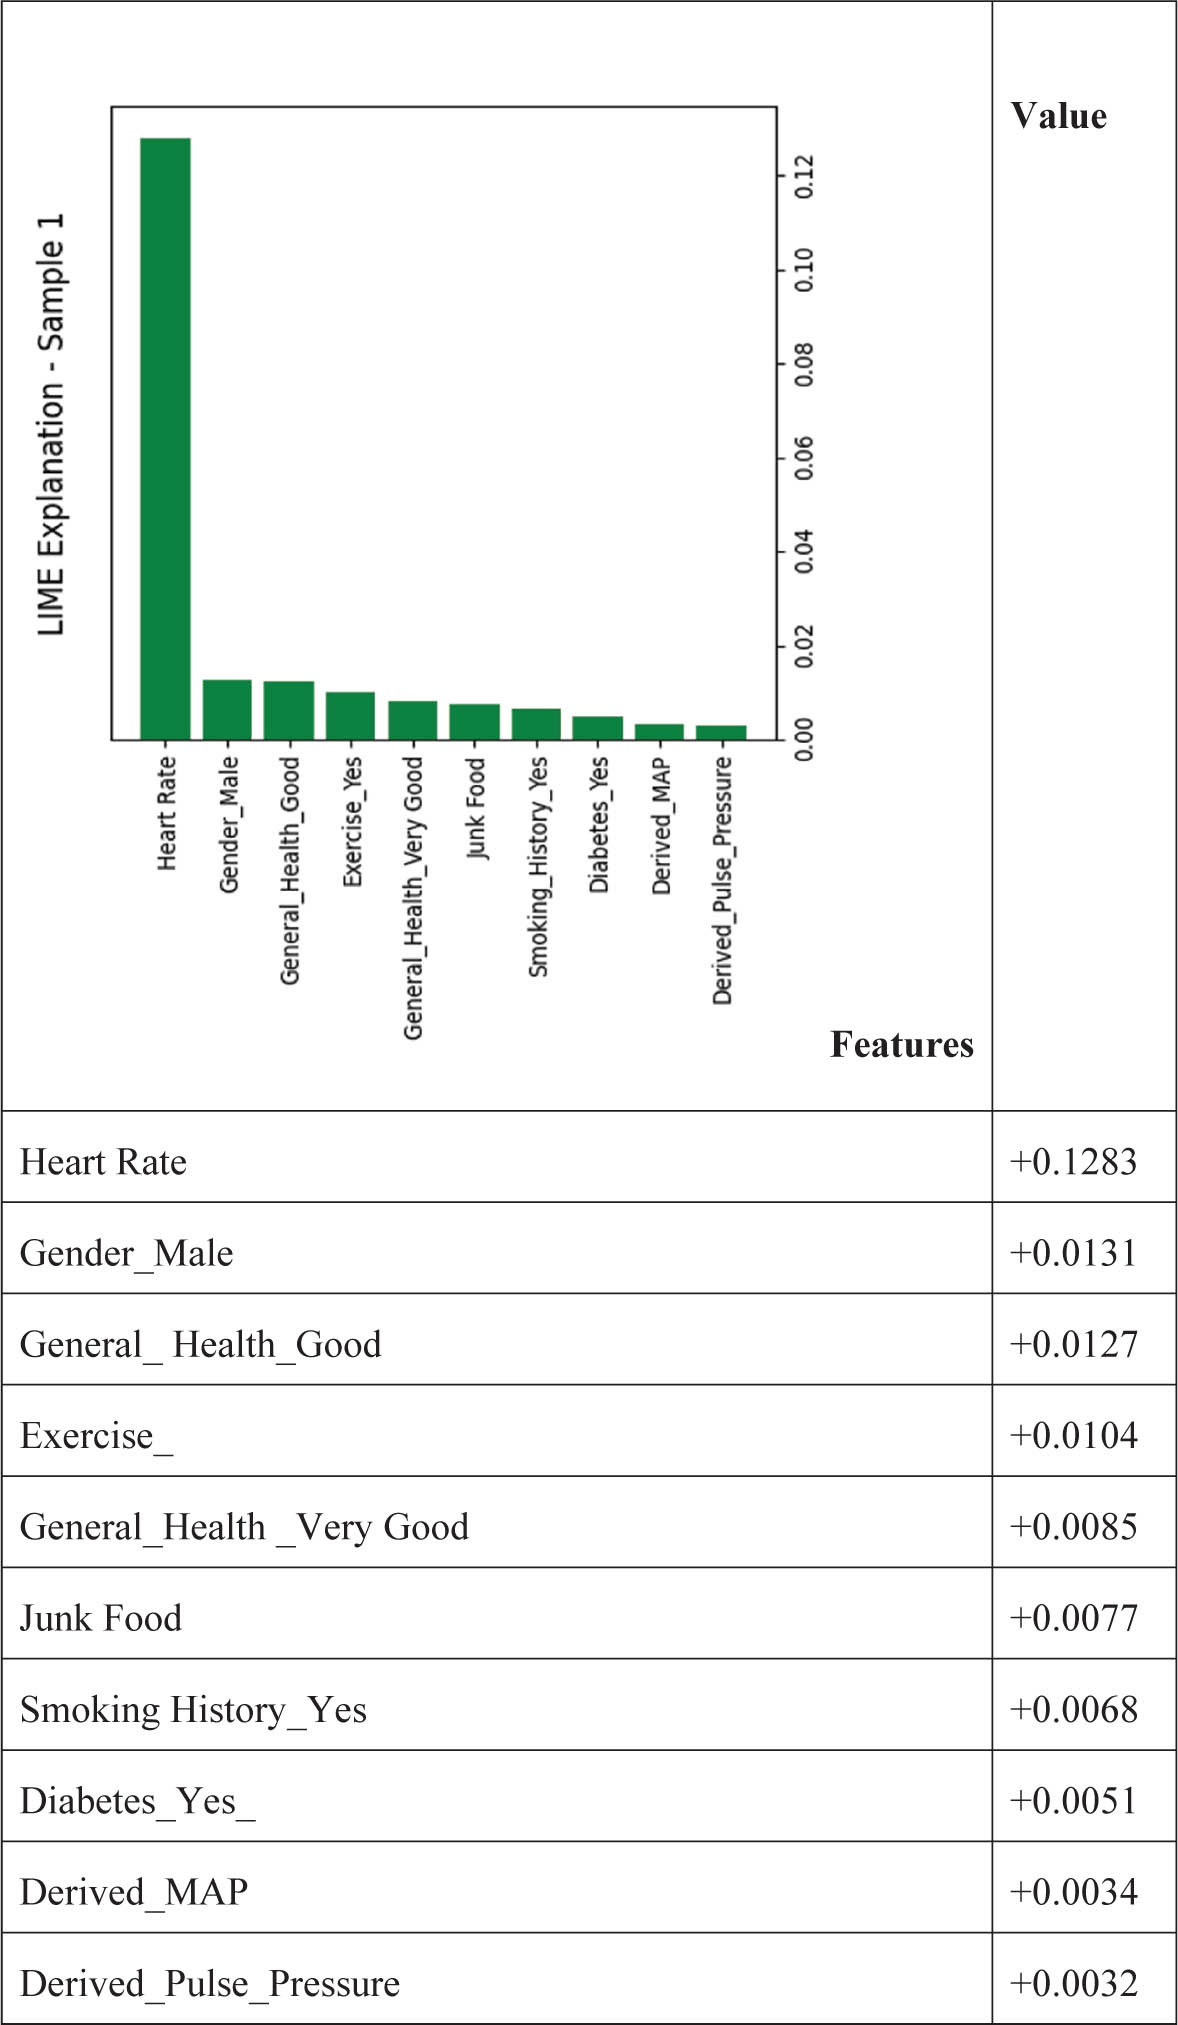
Figure 13:
LIME analysis for sample 1 (Class 1).
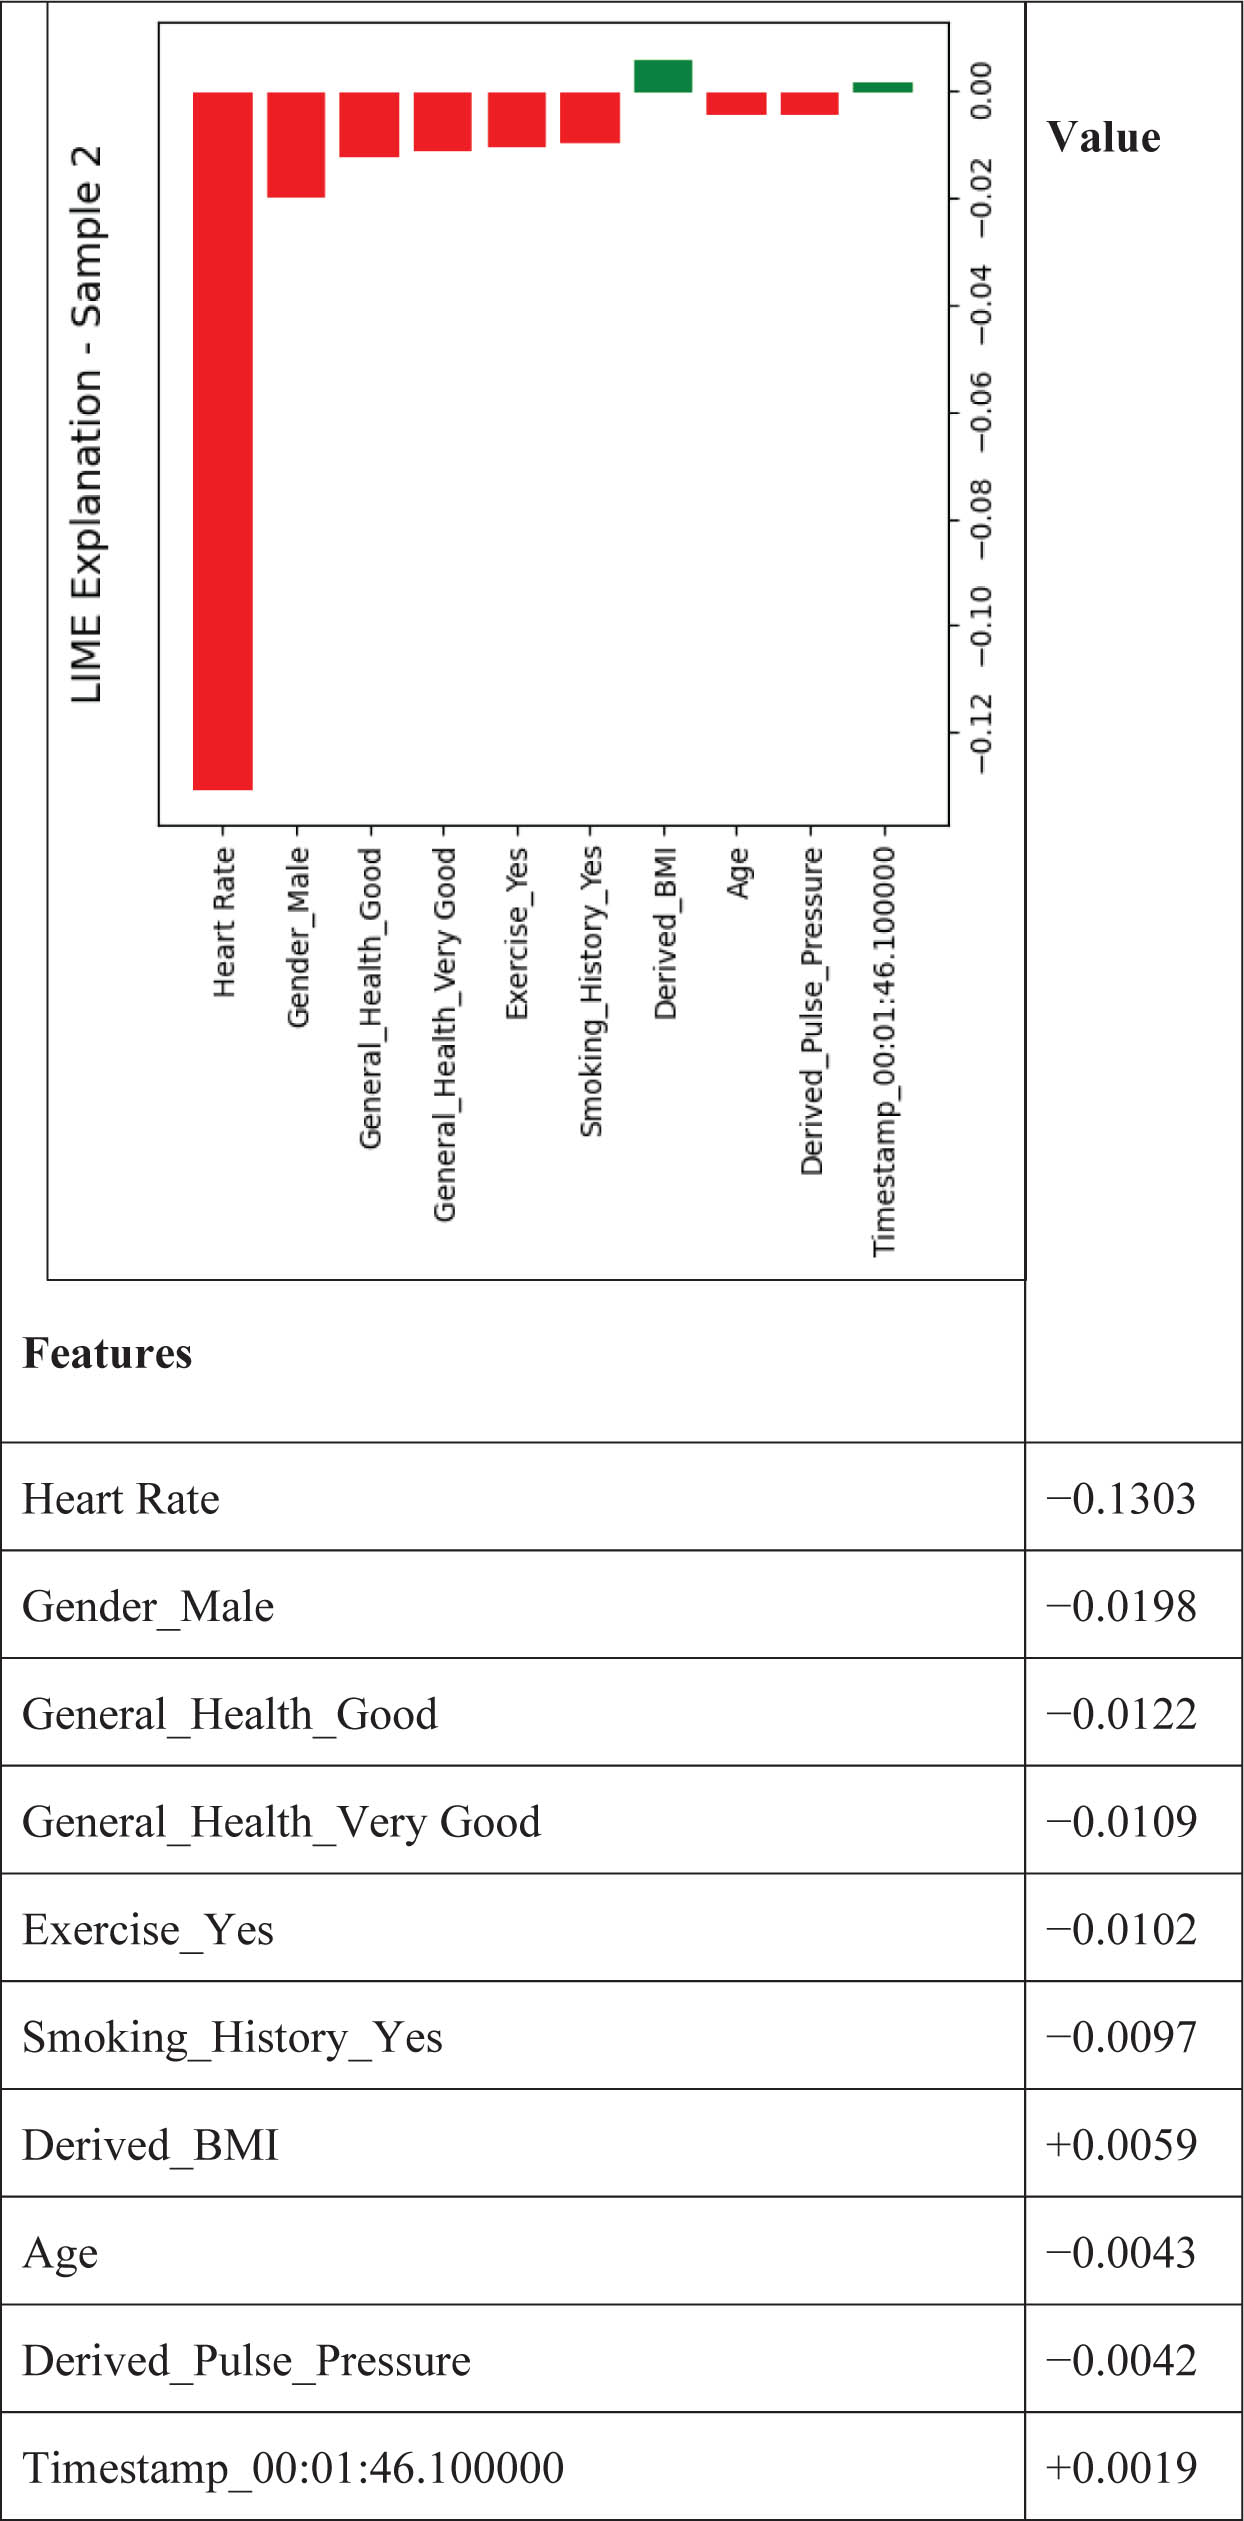
Figure 14:
LIME analysis for sample 2 (Class 0). BMI, body mass index.
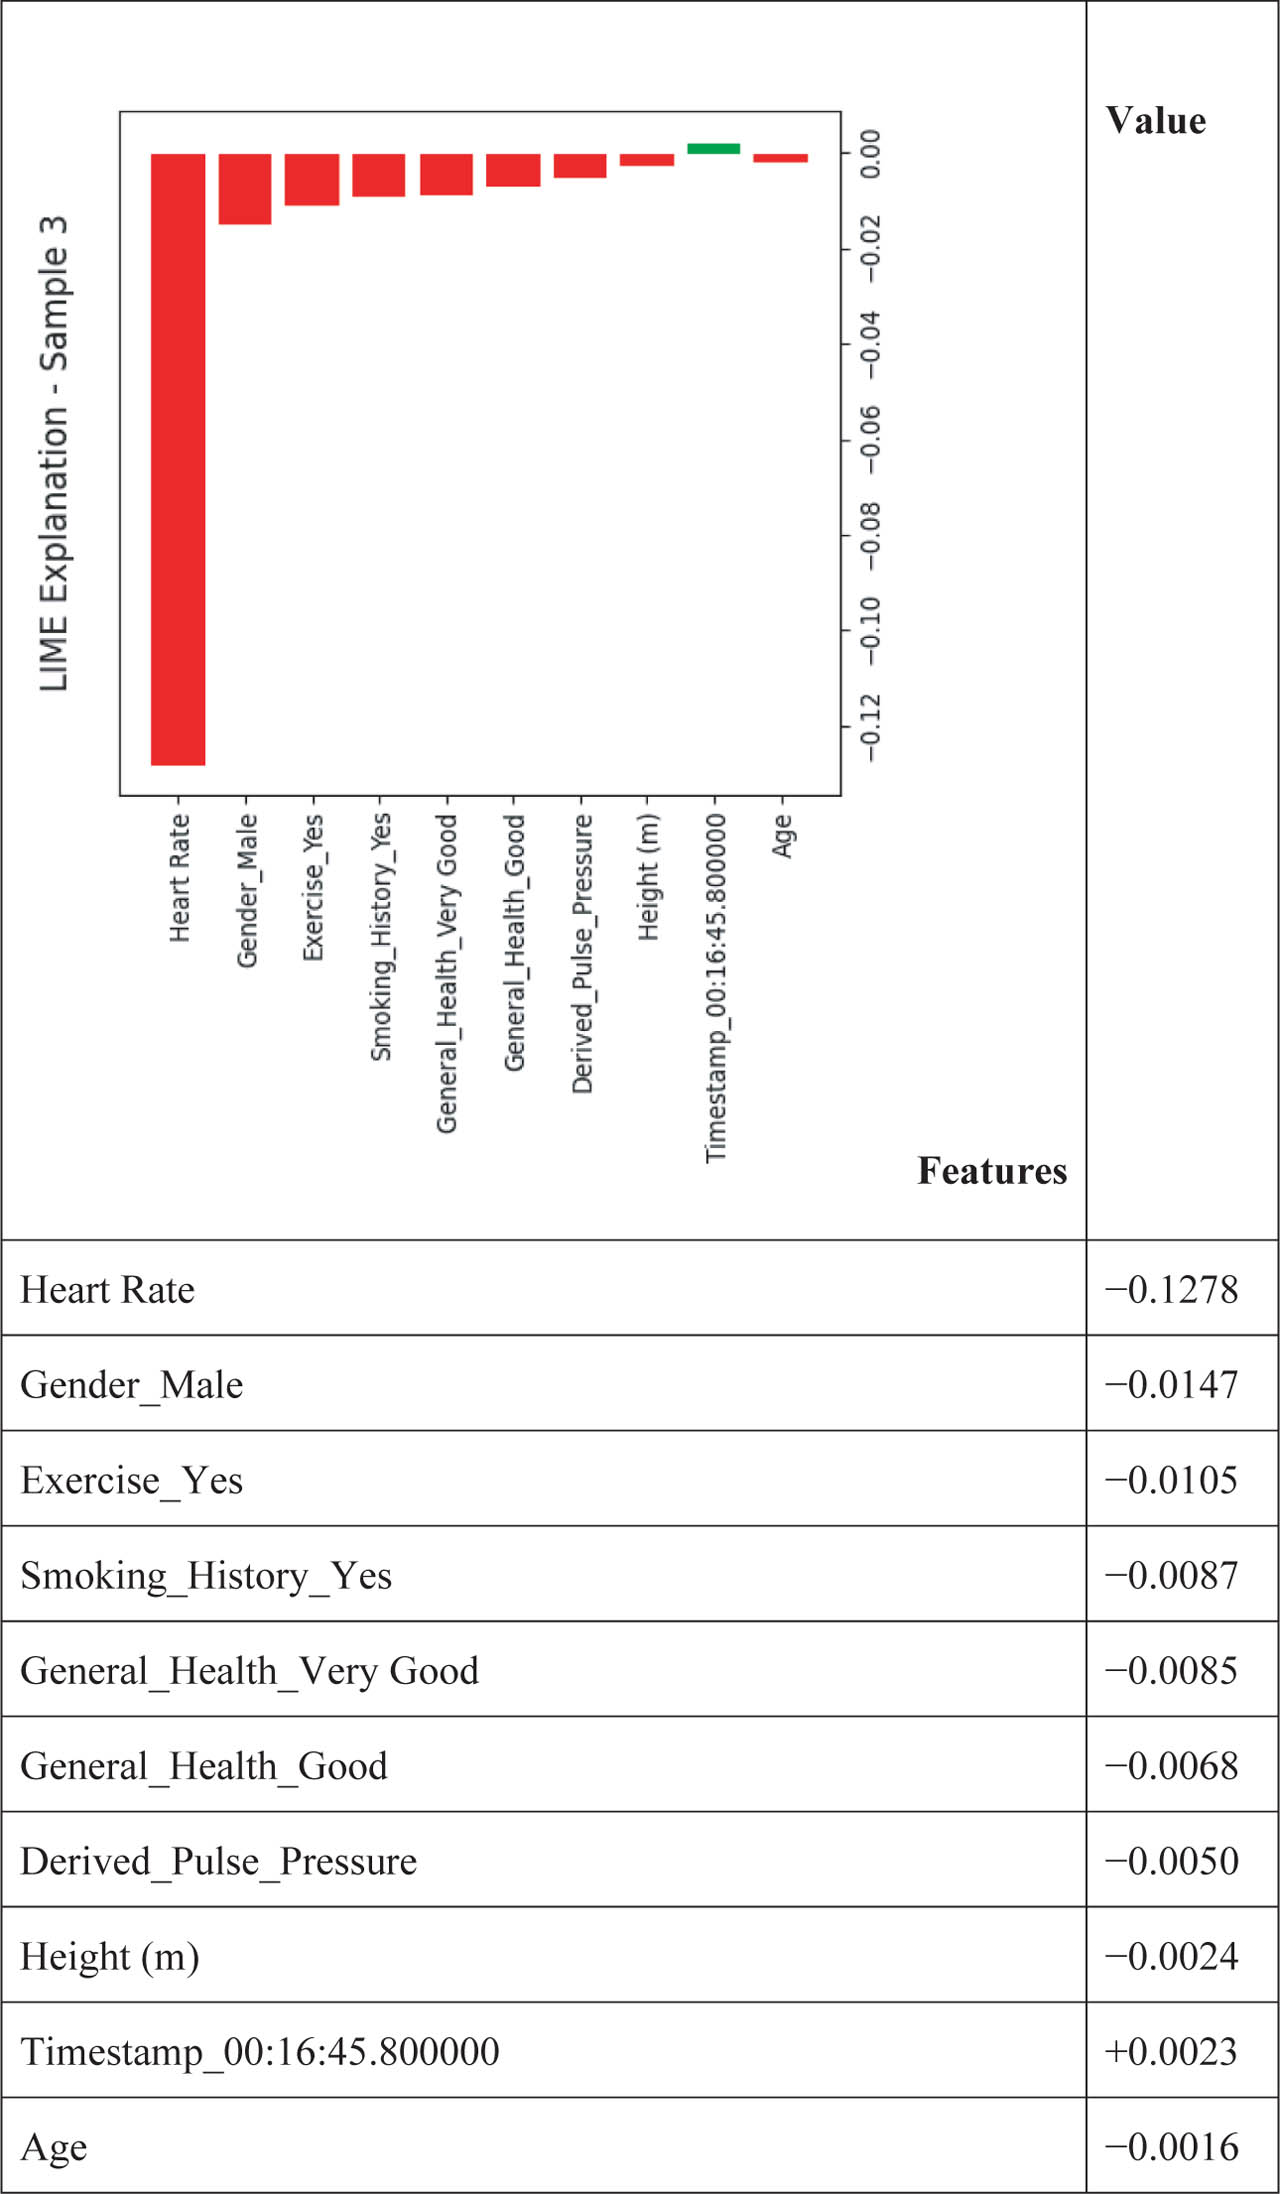
Figure 15:
LIME analysis for sample 3 (Class 0).