

Figure 1:
Workflow of fake data generation.
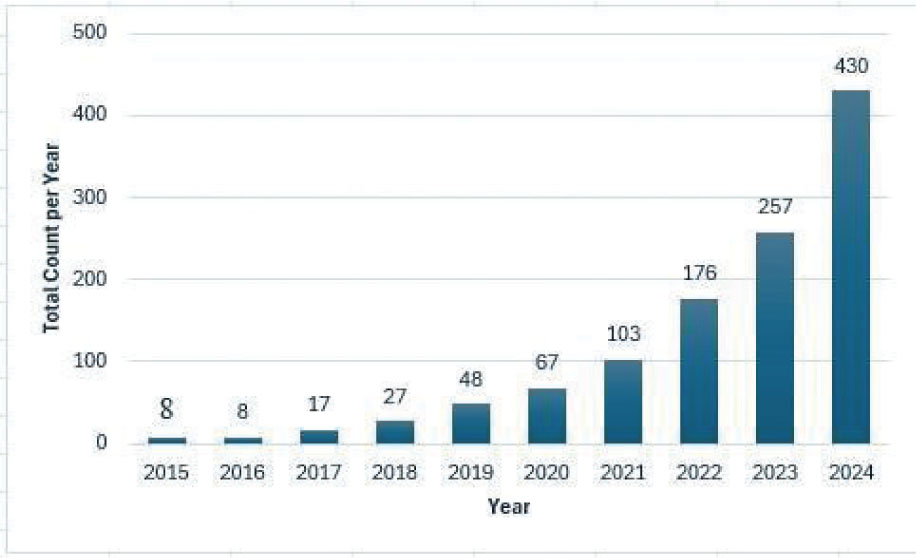
Figure 2:
Total publications per year indexed in the Scopus database from 2015 to 2025.
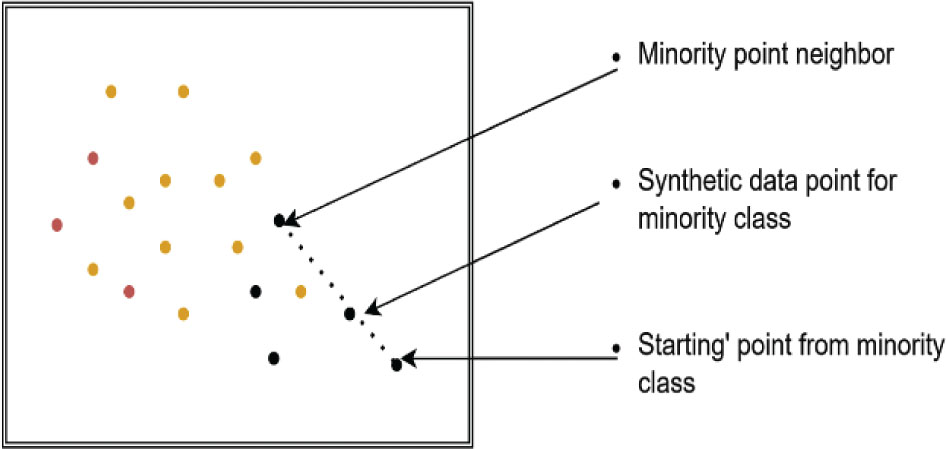
Figure 3:
SMOTE algorithm for a single iteration. SMOTE, synthetic minority oversampling technique.
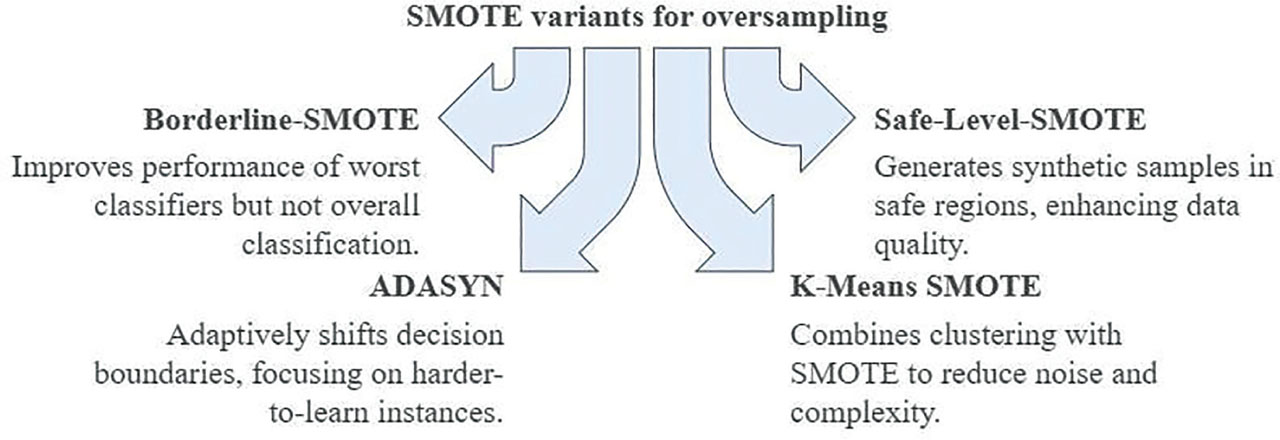
Figure 4:
SMOTE variants. SMOTE, synthetic minority oversampling technique.
Table 1:
Comparative analysis of SDG methods
| Method | Mechanism | Privacy | Evaluation metrics | Pros | Cons |
|---|---|---|---|---|---|
| ROS/RUS | ROS duplicates the minority class, and RUS removes the majority of the samples | No direct privacy guarantees | Classification accuracy, recall, F1 | Simple, ROS keeps the majority intact | RUS discards useful data, ROS risks overfitting |
| SMOTE | Interpolates between minority neighbors | No direct privacy layer | Classifier metrics (F1, recall) | Reduces bias | Ignores the majority class |
| Borderline-SMOTE | Generates samples near the decision boundary | No direct privacy | F-value | Targets hard-to-classify regions | Helps the worst classifier only |
| Safe-Level-SMOTE | Synthesizes only in “safe” neighborhoods (k-NN density) | No direct privacy | Robustness in the classifier metrics | Reduces noise, avoids overlaps | May under-cover rare but valid extremes |
| ADASYN | Adaptive sampling – more for sparse/minority regions | No direct privacy | ML metrics - recall, F1 | Focuses on hard-to-learn samples | Amplifies outliers in sparse areas |
| K-means SMOTE | Cluster data, filters clusters, and then applies SMOTE inside clusters | No direct privacy | Recall, F1 | Reduces noise, good for within and between class imbalance | Sensitive to clustering choice (k value) |
| Cluster-based oversampling | Per-class clustering, then oversample (ROS) each cluster | No direct privacy | Classifier performance | Fixes between and within imbalance, flexible | Uses ROS, not generative |
| AE | Encode–decode; reconstruct input | Indirect privacy via generative process | MSE, ML efficacy | Simple neural generative model | Weak latent representation, poor sample quality |
| VAE | Probabilistic latent space + KL divergence regularization | Improves privacy by sampling latent space | Reconstruct ion loss + KL, utility metrics | Principled latent representation, good quality | May blur/shrink modes, tuning complex |
| GAN | Generator–discriminator adversarial learning | Privacy by design; vulnerable if overfitted | Fidelity (KL, Wasserstein), utility (ML accuracy, F1) | Produces highly realistic samples | Training instability, mode collapse, vanishing gradients |
| TGAN | LSTM generator for continuous/categorical, MLP discriminator w/minibatch diversity | No explicit privacy, but avoids direct data use | Accuracy, F1, correlation metrics | Captures correlations, handles mixed data | Instability, imbalance not directly handled |
| CTGAN | VGM normalization + conditional generator | Same as GAN (synthetic by design) | Likelihood fitness, ML efficacy | Handles non-Gaussian continuous, imbalanced categorical | Complex, still inherits GAN pitfalls |
| TabFairGAN | WGAN-GP with fairness constraint; Gumbel-Softmax for categorical | Adds fairness constraints alongside privacy | Accuracy, F1 | outperforms TGAN/CTGAN for fair data | Possible trade-off: fairness vs. fidelity/utility |
[i] AE, autoencoders; CTGAN, conditional tabular adversarial network; GAN, generative adversarial networks; MSE, mean-squared error; ROS, random oversampling; RUS, random undersampling; SDG, synthetic data generation; SMOTE, synthetic minority oversampling technique; TabFairGAN, fair-tabular data generation with generative adversarial networks; TGAN, tabular generative adversarial networks; VAE, variational autoencoders; VGM, variational Gaussian mixture; WGAN-GP, Wasserstein GAN with Gradient Penalty.
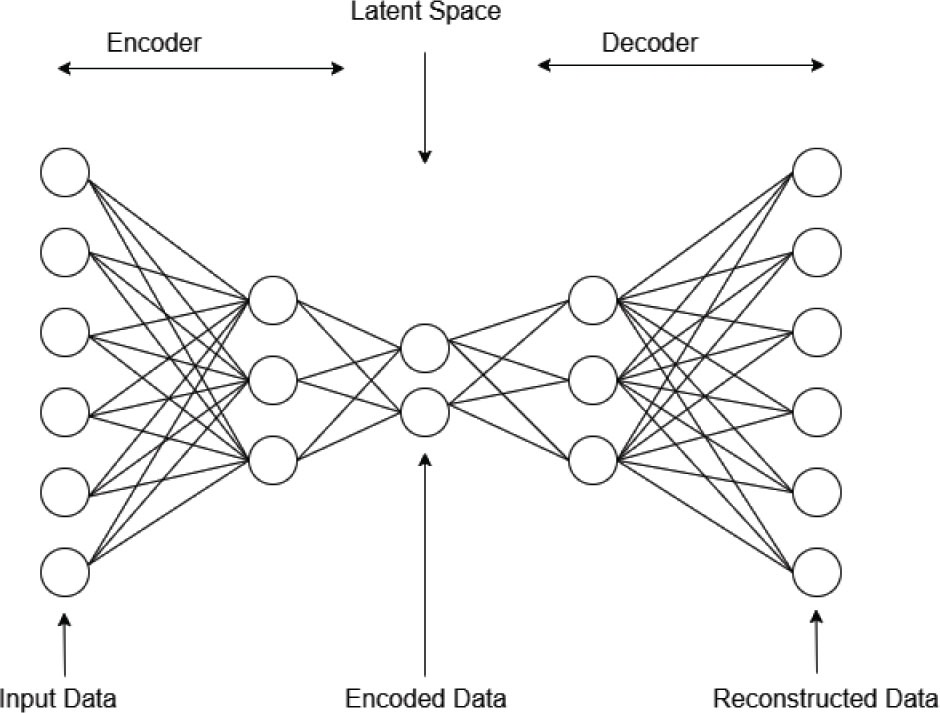
Figure 5:
Basic architecture of AE. AE, autoencoders.
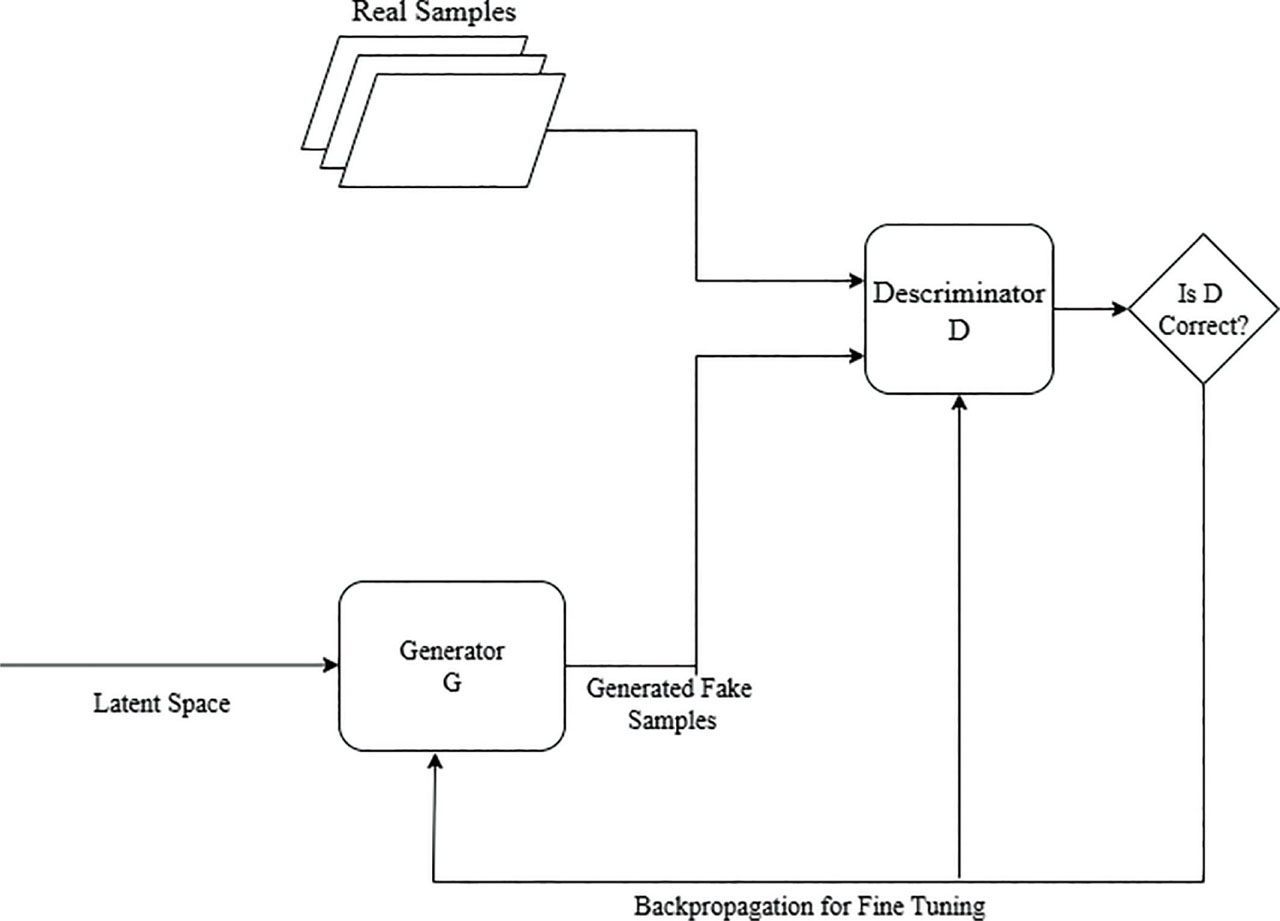
Figure 6:
GAN architecture. GAN, generative adversarial network.
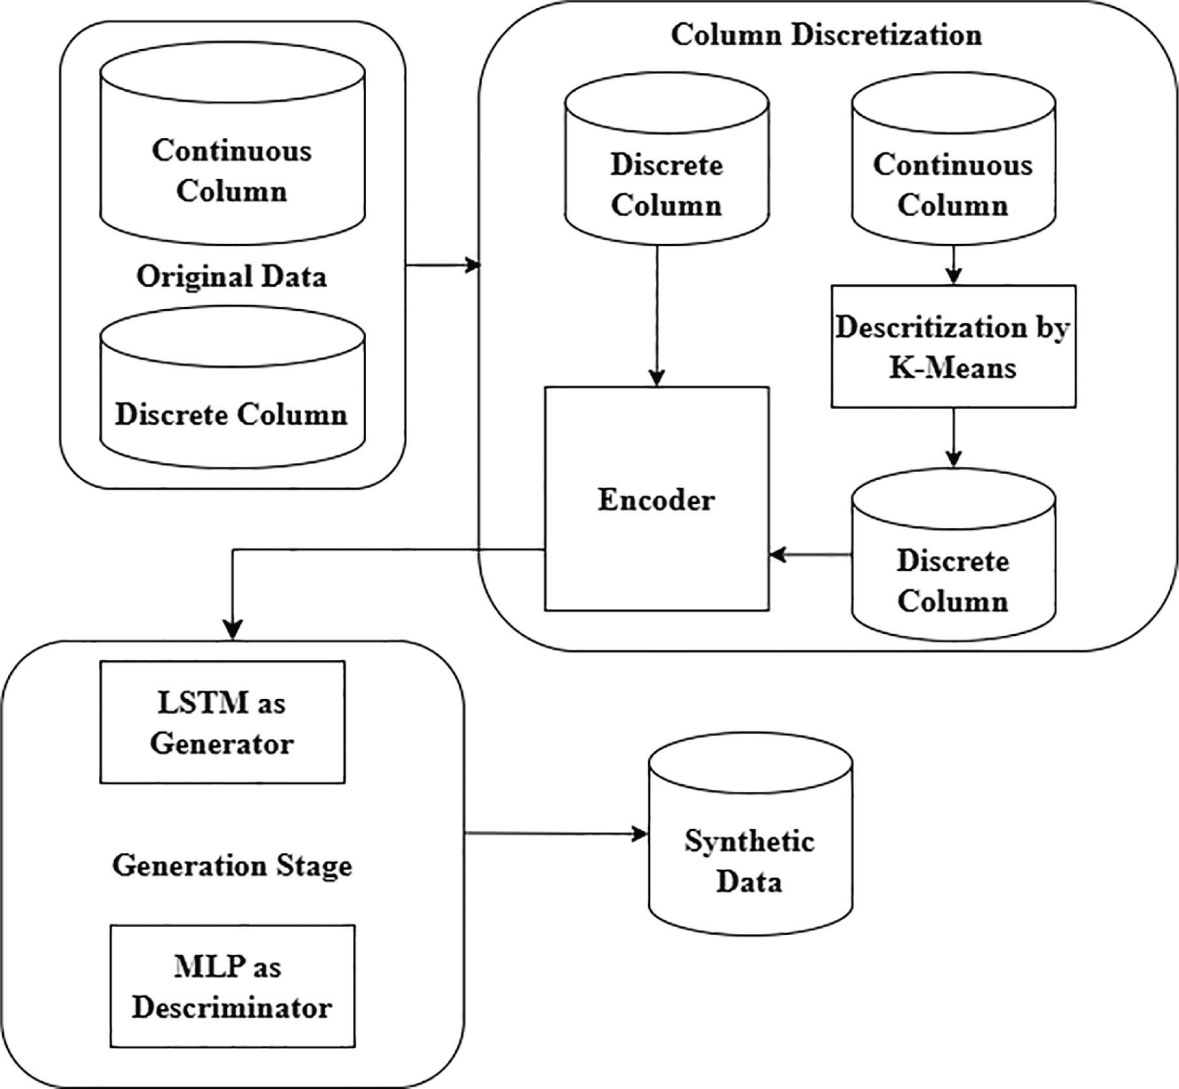
Figure 7:
TGAN for generating two discrete and two continuous variables. LSTM, long short-term memory network; MLP, multilayer perceptron; TGAN, tabular generative adversarial networks.
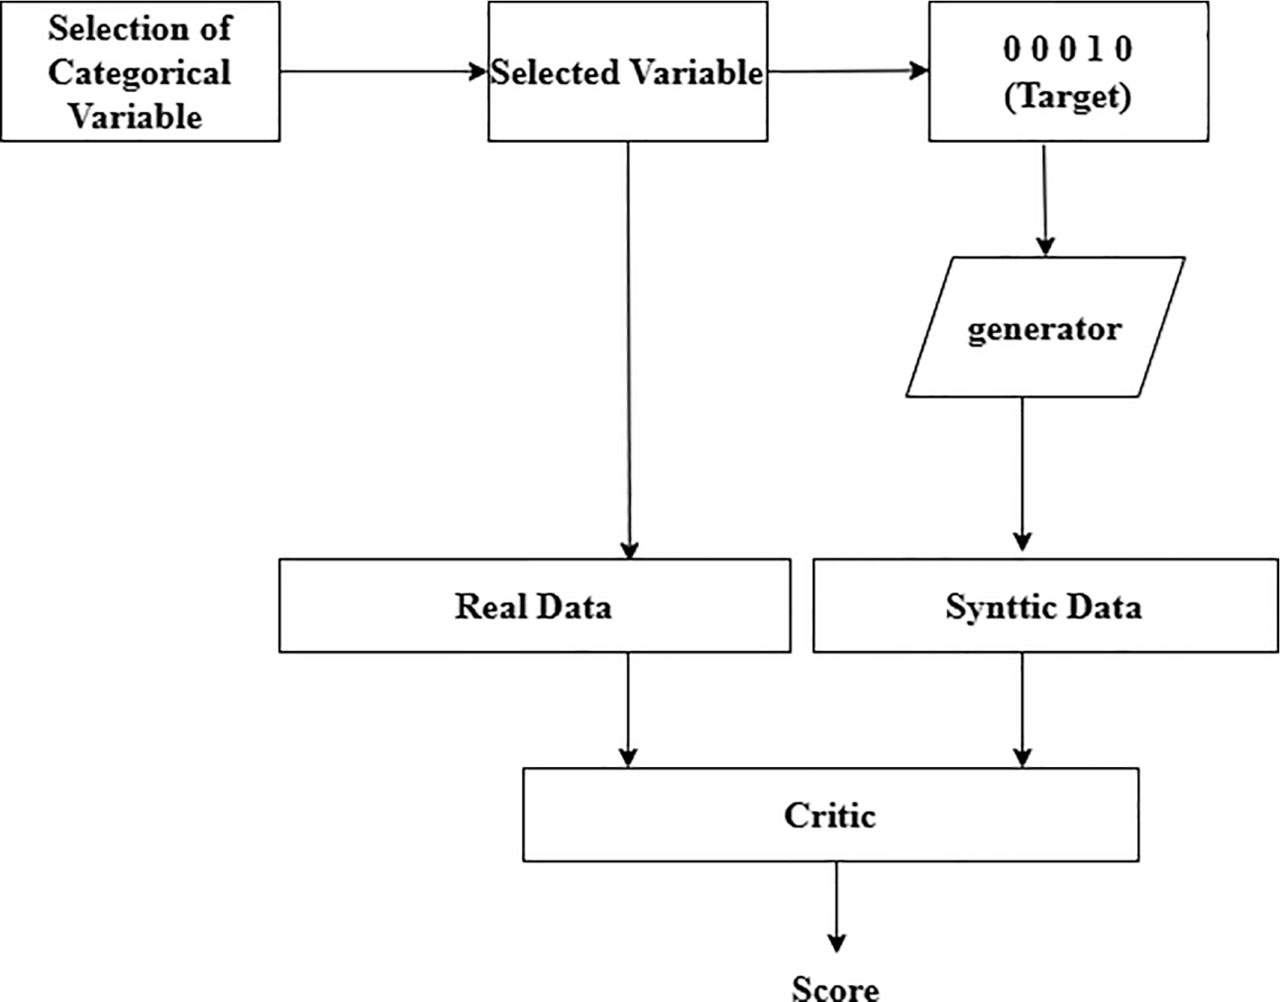
Figure 8:
CTGAN model. CTGAN, conditional tabular adversarial network.
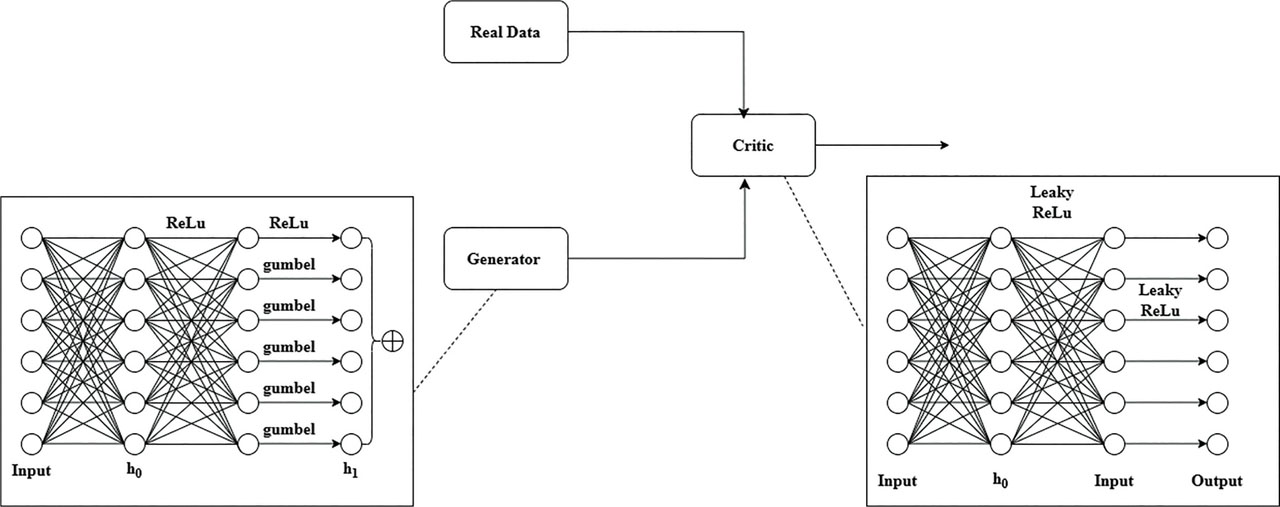
Figure 9:
TabFairGAN Architecture. Image taken from [45]. TabFairGAN, Fair-tabular data generation with generative adversarial network.
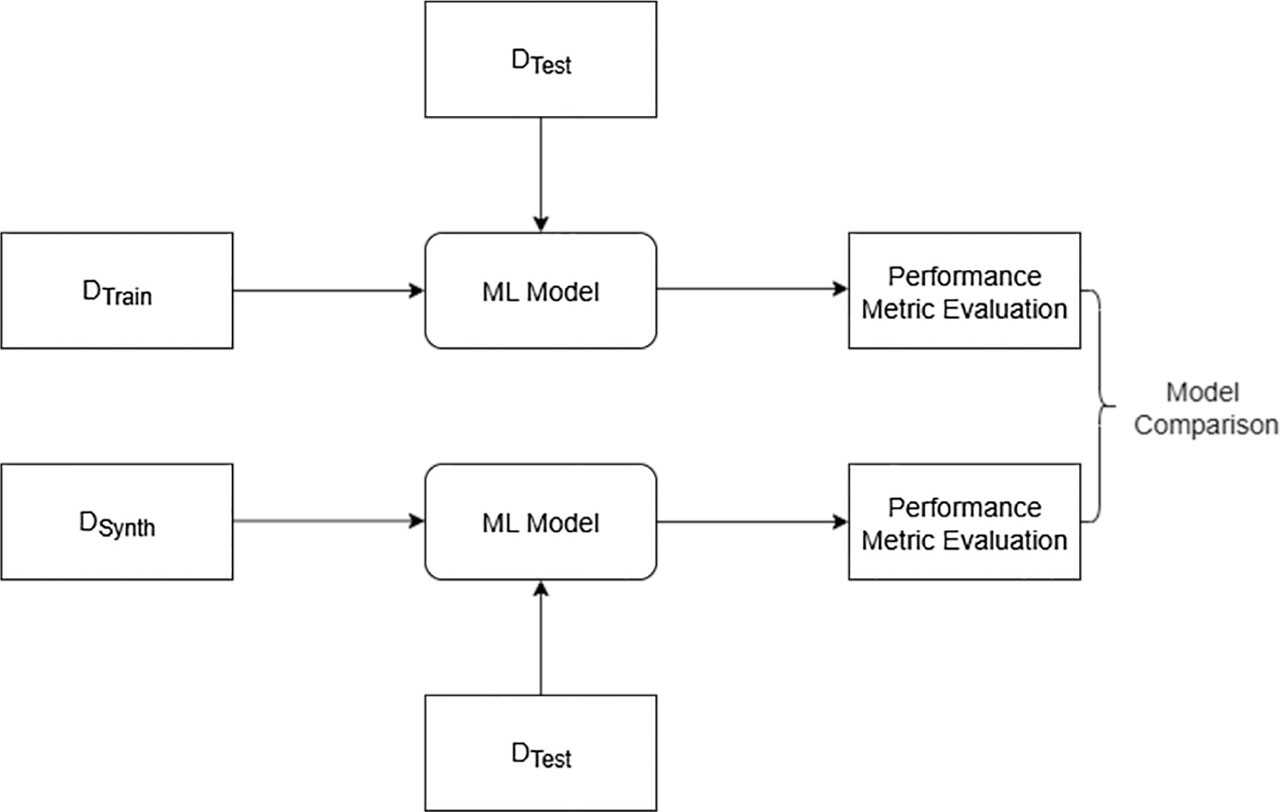
Figure 10:
ML efficacy. ML, machine learning.
Table 2:
Metric combination with SDG methods use cases
| Use case | Synthetic data use | Metric combination used with experimental details |
|---|---|---|
| Generation of synthetic data for medical diagnosis [51] | To preserve rare disease cases without copying patient personal information, as rare disease cases are very few in number and generate a high data imbalance, which negatively affects model performance. | The author generated synthetic data using a GAN and measured statistical similarity between the original and generated data probability for each feature. Results with lower KL divergence proved high similarity, maintaining statistical properties of the original data. Diagnosis performance of the predictive model, trained on both (real and synthetic) data, was tested with accuracy and F1 score. Result shown less variation and minimal risk of individual identification. |
| Data Sharing [52] | Replication of data by maintaining its statistical distribution and no re-identification risk. Use of synthetic data ensured secure data exchange. | Synthetic data was generated using a GAN and the Gaussian Copula Method. Its quality was assessed based on statistical similarity and data distribution with the statistical distribution metric (MMD). It was observed that GAN gave the most satisfactory result by replicating the statistical structure of the original data. |
| To check the quality of generated data on the performance of predictive models, the model was trained with real data first to find basic performance metrics, such as accuracy, precision, and recall. In the second step, the model was trained with synthetic data, and in the final step, training was done with a combination of both. | ||
| Model tested on real test data to assess the overall performance of the model. Results showed that synthetic data better replicates correlations by giving better prediction results. |