
I. Introduction
Alzheimer’s disease (AD) is one of the most prevalent among cognitive impairments, and it comprises almost 70% of cases involving dementia. In AD, cognitive ability is gradually impaired with the progression of age and remains irreversible at the advanced stage. AD is not limited to an area, region, country, or continent but is a global concern today, affecting millions of people. Although advanced treatment options are available, early detection of AD remains a concerning issue [1,2,3]. The condition of AD is symptomatic; it shows signs at least 15–20 years prior, with minute and very mild (VMD) alterations in the brain. The neurons in specific regions concerning the cause are either injured or dead, and the affected subject begins to show indications such as poor memory and speech difficulties after some time. Generally, patients with AD do not complain about the symptoms for many years. However, it is understood that the severity has worsened over time when they find it difficult to carry out their daily tasks. Due to the absence of proper treatment options for AD, existing approaches are focused on slowing the progression of AD. Current therapies only ensure a decent standard of life and effectively manage the patient’s incapability of making decisions [4,5,6,7].
It is projected that in the next 25 years, about 0.6 billion people will be affected with AD worldwide. The consequences of AD not only affect the patients but also their families, who bear the tremendous mental and physical burden of providing care to such patients. There are several lines of action available for diagnosis of AD, using computer-aided systems. The methodologies include various psychological, neurological, and cognitive examinations, in addition to minor and modified assessment and evaluation of the mental state. Diagnostic follow-ups can be done through biological and technical examinations in addition to the tests. In the case of ambiguities, magnetic resonance imaging (MRI), computed tomography (CT) scans, positron emission tomography (PET), and biomarkers in cerebrospinal fluid (CSF) can be used to supplement diagnosis tools to enhance AD detection. Several advanced biomarkers are used with 3D MRI scan images to distinguish patients’ present state and predict AD progression [8]. The most common and powerful tool used today to detect brain-related diseases is MRI; a non-surgical process, it can detect high-resolution structural alterations in the brain and monitor disease progression. Due to these characteristics, MRI is preferred as an invaluable tool for medical practitioners, clinicians, and patients [9].
Machine learning (ML) and deep learning (DL) techniques are currently popular in research studies on imaging. They are found to benefit research, especially in the diagnosis of health-related issues and early diagnosis of AD. They demonstrate extraordinary performance in pattern recognition and classification of images in a variety of applications [10,11,12,13,14]. The literature of the past decade shows intensive use of ML for significant neuroimaging and characterization of AD. ML has also been used to obtain inspiring outputs in AD diagnosis and prediction [15]. Random forest (RF), decision trees (DTs), and support vector machines (SVM) are the most favored ML components that have been used for analyzing AD. On the other hand, DL has proven successful in medical imaging and has obtained excellent success rates for picture categorization [16]. Popular DL models include convolutional and artificial neural networks, transfer-learned networks, and long-term short-memory networks, due to their ability to offer automatic abstraction of image characteristics from a lower to a higher level. This quality of DL approaches is significant for facilitating better feature representation [17]. Several works such as [18,19,20] have used SVM and CNN along with particle swarm intelligence to predict the stages of AD with good performance and enhanced accuracy. Outstanding results in AD diagnosis were obtained using transfer-learned CNN models [20], which were initially trained over the ImageNet dataset and then used as feature extractors over small datasets. The use of various pretrained models for automatic diagnosis of AD in various stages can be seen in [20], wherein the models were able to capture critical structural details in the MRI images.
Early detection of AD helps in using therapies and interventions on time, mitigate the trajectories, and manage symptoms. Thus the quality of life of the patient and his family members is significantly improved. Early diagnosis of AD helps researchers in their clinical experiments and drug improvement activities. They are able to choose the suitable candidate for experimental tests and evaluation purposes, and for lining up treatments and therapies [21].
AD prediction methodologies in AI-based models using MRI datasets can be found on public repositories such as Kaggle; they have shown promising results in using models based on DL and hybrid ML-based frameworks. Nevertheless, multiple constraints are still not accounted for. Existing approaches are often heavily based on deep neural architectures with large computational power overhead, extensive training data, and specialized hardware that often need additional processing resources to compute; these limit the applicability in resource-limited healthcare settings, especially in the context of both rural or low-infrastructure settings. Moreover, most of the existing work is largely binary (dementia vs. non-dementia [ND]) and may not be able to carry out meaningful evaluations among several disease stages, which limits clinical interpretability in order to provide for early intervention. Furthermore, systematic feature interpretability and the incorporation of traditional, handcrafted descriptors, which may record subtle structural and textural changes to MRI scans from early neurodegeneration-related diseases, have not been adequately considered. In addition, limited preprocessing or region-specific enhancement is applied in many papers, potentially disregarding diagnostically relevant anatomical information. Performance benchmarks are often reported without sufficiently capturing class imbalance, reproducibility, or dimensional redundancy of extracted features.
Aimed at addressing these shortcomings, this paper proposes a computationally economical yet effective conventional feature–machine learning (CF-ML) framework for early detection of AD, using Kaggle MRI data, motivated by the need for a low-cost approach to such task. The proposed method combines systematic preprocessing with region-of-interest extraction, resizing, and contrast correction followed by detailed feature extraction with textural, statistical, and filter-based descriptors to better capture discriminative information while keeping it interpretable. Addressing the redundancy and stability of the approach to these two datasets, cleaning, normalization, and dimensionality reduction are offered in this paper. In contrast with previous works, this work deals with performance in both binary and multiclass in ND, VMD, mild, and moderate dementia categories in a manner more consistent with practical diagnostic goals. Hence, the proposed CF-ML framework aims to integrate the accuracy, ease of computation, as well as suitability for real-life screening, particularly in populations where modern diagnostic resources are still scarce.
The novelty of this study lies in the design of a CF-ML framework that integrates a multi-stage preprocessing pipeline with contrast-based enhancement and Beltrami denoising, followed by an extensive conventional feature extraction strategy. In contrast to previous DL efforts or traditional ML that depends on end-to-end feature learning, the proposed framework systematically filters, normalizes, and optimizes handcrafted features by PCA-based dimensionality reduction, resulting in compact but discriminative feature representation. Furthermore, the developed CF-ML model takes a collaborative filtering-based learning approach to improve inter-feature correlation prior to classification, which has not been used in AD MRI analysis. This experimental design—which utilizes real but unaugmented Kaggle AD MRI data with binary and multiclass configurations provides additional evidence that the model shows robustness, generalizability, and superiority over recent DL-based models.
The paper proposes an early AD detection framework (CF-ML framework) and contributes in the following respects:
A new conventional feature and machine learning-based model, named CF-ML, is proposed to diagnose AD in its early stage, as well as binary classification of AD by combining the dementia classes against ND.
The model utilizes a finely tuned filter and contrast-based image enhancement strategy to extract the region of interest (ROI) in the preprocessing stage.
Quality descriptors are adopted to extract textural information, global features, and pattern orientation features for discriminating AD categories to a considerable extent for better classification.
By normalizing and reducing feature dimensions, experiments are conducted to find the interclass distance between each category. Performance assessment metrics are evaluated for binary and multiclass categories and compared with recently published leading techniques involving classification accuracy and others.
The remainder of the paper is organized as follows: Section II discusses the related work from recent articles. The proposed CF-ML model is discussed in section III. Section IV covers the analysis and the experimental results of the introduced CF-ML model, the comparison, and the implications. Finally section V concludes the work with recommendations.
II. Related Work
A comprehensive review was carried out for pertinent research that reflects the pivotal role of ML and DL in medical applications, especially in detection of AD. It includes article reviews incorporating feature extraction methods, biomarker techniques, and automated feature extraction and classification capabilities of various DL models. It also covers commonly used techniques, including the ANN, DNN, and SVM approaches, which are efficiently used in AD classification [22,23,24].
The cerebrum was partitioned into 3D patches using the Automated Anatomical labeling tool, and patches for training DNNs [25]. The task at hand was to distinguish between three classes: Non-converting (NC), AD, and mild cognitive impairment (MCI) subjects. The model accuracy was enhanced using four different predictors called voting algorithms. NC and AD were classified with an accuracy of 90%. Research on the ADNI dataset to predict the AD phases was carried out in [26]. The authors employed CNNs for the brain MRI images. They obtained an average accuracy of above 96%. Such models are of great importance as they assist in creating predictive algorithms that can discriminate AD from normal subjects, as well as determine the AD phases. Another CNN-based AD detection scheme was employed in [27] on the OASIS dataset. The performance was compared with other pretrained models that included prominently the ResNet, Alzheimer’s Disease Network (ADNet), and InceptionV4. Their work focused on binary classification and differentiated between distinct phases of AD in the progressive diagnosis. They obtained superior results with an accuracy of 93%.
A comprehensive study from July 2013 to 2018 regarding the effectiveness of DL (12 studies) and a combination of ML and DL (16 studies) in early AD detection was carried out [28]. The study concentrated on knowing the efficacy in predicting the advancements of AD from the lower to higher states. The studies showed that using a combined network achieved the highest efficiency of 96% and above 84% for predicting lower-stage (MCI) to AD. The study also concluded that the performance can be enhanced or improved by adding neuroimaging and fluid biomarkers. The work introduced in [29] considered three different datasets to evaluate the streamlined CNN model for predicting AD. They focused on the left and right hippocampal regions of the brain MRI. They combined the Gwangju and Related Dementias dataset for 352 scans and the ADNi dataset with 326 scan images to validate their model.
The MiSePyNet network introduced in [30] is characterized by learning from multiple views in the PET images. Making use of traditional CNNs that are complex and resource-intensive, spatial details were maintained using separable convolution to reduce hyper-parameters. They combined CNN and ensemble learning and used MRI data to diagnose AD. They obtained an accuracy of 85% over the ADNI dataset as compared with other competing models that used 3D-SENet and a combination of PCA + SVM. A similar approach was introduced in [31] to classify healthy subjects from AD relative to functional connectivity amidst activity voxels in the cerebrum. They showed and concluded that functional connectivity linking voxels in the pre-frontal lobe and the middle of the parietal and pre-frontal lobes are significant factors in AD prediction that improve classification accuracy. The authors in [32] used MRI images from two separate datasets: one from ADNI and the other acquired from the Seoul National University Bundang Hospital. The MRI images belonged to subjects from different races, age groups, genders, and educational qualifications. They used 195 images from both datasets and obtained about 89% accuracy with a processing time of about 23–24 s.
The authors in [33] used the pretrained model VGG19 to classify longitudinal brain MRI images for discriminating AD stages and obtained an accuracy of 97%. In their other approach, they used CNN on ADNI dataset scans for the 2D and 3D structural images and categorized them at an accuracy above 95% and 93%, respectively, for a multi-stage configuration. The work introduced in [34] used various ML techniques to separate dementia patients with AD and other illnesses. They found that the gradient boost method outperformed the other five techniques when 10-fold cross-validation was adopted over 150 sample images from the OASIS dataset. The classification accuracy with gradient boost was 97.58%, which was more than that of SVM, RF, Ada-Boost, and logistic regression (LR).
Kavitha et al. [35] concentrated on detecting AD in the early stages using the samples from the OASIS dataset. They used several ML classifiers that were included to recognize the best factors for AD prediction. They obtained a mean accuracy of 83% on the test samples with validation. Seifallahi et al. [36] extracted 12 features and used them with an SVM classifier to classify healthy controls from AD. They collected 47 samples of healthy controls and 38 samples of AD from subjects performing the timed up-and-go test. The authors confirmed an average accuracy of 97.75% between the healthy and AD samples. Al Shehri [37] suggested two DL models to classify four AD stages from the Kaggle dataset. The author obtained better performance using the DenseNet-169 DL model as compared with ResNet-50, with an accuracy of 83.82% against 81.92%, respectively.
Khandaker et al. [38] used various ML models to detect AD stages using the OASIS dataset images. They concluded that ML algorithms can significantly lower AD consequences through accurate detection using the voting classifier. They obtained a maximum validation accuracy of 96% for the AD samples. The other ML classifiers used in their research work were the RF, Gaussian Naïve Bayes (NB), XGBoost, Gradient Boost, and DT. The evaluation was conducted on 64 dementia and 72 ND patients. Zhao et al. [39] carried out a brief review of AD diagnosis using various ML and DL techniques. They specifically concentrated their survey on popular conventional ML techniques that included SVM, RF, CNN, DL, Autoencoders, and transformers. They also explored various handcrafted feature extraction techniques provided to the CNNs. Data leakage and data imbalance issues were discussed in their work and suggestions were made regarding the preprocessing steps and their trade-offs. They highlighted the advantages and limitations of various ML and DL techniques with further scope.
Shukla et al. [40] focused on some insightful preprocessing mechanisms to enhance the classification accuracy over the ADNI MRI samples. They converted the 4D formatted samples to 2D samples and preprocessed them. The preprocessing stages involved operations that particularly covered selective clipping of the samples, grayscale conversion, and image enhancement using histogram equalization. The preprocessed images were then fed to three different classifiers that included the CNNs, XGBoost, and the RF. Applying better preprocessing additionally reduced the computational time in training the classifier. They succeeded in distinguishing the AD and non-AD classes with an accuracy of 97.57% for 1,917 AD and 1,775 non-AD samples. Agarwal et al. [41] looked at the transfer learning aspect of CNNs. They presented CNN with transfer learning using a huge dataset for classifying AD and non-AD patients. They concluded that transfer learning can improve classification accuracy and reduce overfitting. They used the four category samples from the Kaggle dataset and extracted features using various pretrained networks that included family members from the DenseNet, VGG, ResNet, MobileNet, InceptionV3, and Xception networks. They concluded that the highest accuracy of 93.91% was obtained using the VGG16 network.
El-Assy et al. [42] used two custom CNN networks for extracting features from MRI samples belonging to the ADNi dataset. The extracted features were then concatenated from the CNN networks and given to a fully connected layer for categorization. Their two network models were constructed using different sets of filter sizes and pooling layers, which showed efficacy in extracting discerning features from the MRI scan images. They evaluated the network performance by addressing multiclass problems with three, four, and five classes. Experimentation over 90%:10% training and test samples showed that the customized network achieved remarkable accuracies above 99% for each of the categories. They concluded that the network architecture influences the hierarchical pattern of layers, resulting in learning and extracting local and global patterns from the input MRI images that fairly discriminate between different AD stages. Sorour et al. [43] worked on an objective to find a suitable AD detection model with the best accuracy. The authors presented five different modules constructed using combinations of DL and ML networks and models with and without augmenting the data samples. The five models were used to distinguish between AD and non-AD samples from the Kaggle repository of 6,400 MRI scan images. The non-augmented images were tried with CNN, while the augmented samples were subjected to CNN, CNN-LSTM, CNN-SVM, and VGG-SVM through the transfer learning approach. They obtained the best results with a CNN-LSTM network with a percentage accuracy of 99.92.
Castellano et al. [44] focused on multimodal models exploiting the 2D MRI scans that had been unexplored. They addressed the gap by evaluating 2D and 3D MRI and PET scan images in single and multimodal models. They demonstrated that the volumetric data better represent learning than the 2D samples. Also, integrating multiple modalities improves the model performance significantly compared with unimodalities. They showed with Grad-CAM that their model efficiently focused on significant AD concerning regions for prediction on the OASIS-3 dataset images. The authors achieved a maximum accuracy of 95% using the 3D MRI + PET fusion. Table 1 highlights the contributions of different researchers with respect to the datasets, models, significant contributions, and model limitations.
Table 1:
Review summary of work on AD by different researchers
| Author and Reference | Dataset used | Model | Significant contribution | Limitations |
|---|---|---|---|---|
| Kishore and Goel [22] | FDG-PET images (ADNI dataset) | Deep neural network with transfer learning | Significant generalization ability | Attributes are limited to a single tomography tool |
| Diogo et al. [23] | ADNI and OASIS | Several ML Classifiers | Generalization ability | MCI patients limited to a single dataset |
| Ortiz et al. [25] | ADNI dataset | Deep belief networks | Determination of discriminative ROIs | Dimensionality problem with SVM |
| Sarraf and Tofighi [26] | ADNI dataset | CNN + LeNet-5 Network | Higher performance compared to SVM | Computational Complexity |
| Islam and Zhang [27] | OASIS dataset | Ensemble of deep CNN | Beneficial in scarce datasets | Limited to the AD dataset |
| Pan et al. [30] | F-FDG-PET images (ADNI) | Multi-view separable pyramid network | Strong generalization ability | Satisfactory performance for pMCI vs sMCI |
| Shi et al. [31] | Resting state f-MRI data (ADNI) | SVM | Potential value for the AD pathogenesis mechanism | Limited functional connectivities between voxels |
| Bae et al. [32] | SNUBH and ADNI | CNN | Generalization ability | Satisfactory AUC values for intra and inter-dataset samples |
| Helaly et al. [33] | ADNI dataset | CNN and VGG19 with transfer learning | Low time and computational complexity | Satisfactory performance |
| Battineni et al. [34] | OASIS dataset | Multimodal ML | Prediction of dementia in older adults | Limited to single omic features |
| Kavitha et al. [35] | OASIS dataset | ML models | Insight into different machine-learning models | Satisfactory performance with minimum features |
| Seifallahi et al. [36] | Self-generated using Kinect V.2 camera (time up and go) | SVM | Low-cost and convenient AD assessment mechanism | Lacks confirmation of clinical diagnosis |
| Al Shehri [37] | AD dataset from Kaggle | DenseNet-169 and ResNet-50 | Higher accuracy using DenseNet-169 | No validation using cross-dataset samples |
| Khandekar et al. [38] | OASIS dataset | ML models | Voting classifier obtained 96% accuracy | Satisfactory performance using minimum features |
| Gargi Pant Shukla et al. [40] | ADNI dataset | CNN, RF, and XGBoost | About 97% accuracy using the CNN | Satisfactory performance |
| Agarwal et al. [41] | AD dataset from Kaggle | CNN | Insight into different pretrained models | Satisfactory performance |
| El-Assy et al. [42] | ADNI dataset | CNN | Eliminate the need for handcrafted features | Limited to a few data modalities |
| Sorour et al. [43] | AD dataset from Kaggle | Multimodal deep learning | 99.92% accuracy with CNN + LSTM | Performance is limited to binary classification |
| Castellano et al. [44] | PET and T1-weighted MRI from OASIS-3 dataset | Fusion model using CNN | Identification of key brain regions associated with AD | Computational complexity, and loss of temporal resolution caused by averaging PET frames |
III. Materials and Methods
In contrast to the commonly used DL-based models for detection of AD that have either a pretrained CNN model or an end-to-end architecture, the CF-ML framework proposes a hybrid feature-engineering pipeline focusing on interpretability, precision, and computational efficiency. The novelty of the proposed AI classifier lies in combining field-of-view (FOV)-guided preprocessing with Beltrami-based denoising and contrast enhancement to greatly boost edge retention and tissue visibility on MRI scans, without requiring heavy training of networks. Moreover, the framework is capable of extracting a mixed collection of handcrafted descriptors to account for both structural and textural characteristics of dementia progression, which include matched filter responses, gradient-based features, GLCM texture metrics, linear binary patterns (LBPs), and a histogram of oriented gradients (HoGs). These heterogeneous features are optimized using zero-column filtering, max-normalization, and PCA-driven dimensionality reduction to provide a compact and highly discriminative feature representation. Another important novelty is the class-balancing and adaptive labeling strategy during the binary and multiclass configurations, which guarantees unbiased learning on the highly imbalanced AD datasets. The framework outperforms DL architectures in accuracy and computational costs by a wide margin, proving that well-designed conventional features together with a trained SVM classifier can achieve similar to even greater accuracy and generalization than deep architectures. Thus, CF-ML brings interpretability and performance closer together: a light, powerful diagnostic tool fit for real-world clinical deployment.
The proposed CF-ML AD detection framework consists of the following phases: preprocessing, feature extraction, filtering, feature normalization, target assignment, dimension reduction, and classification. The foremost unique preprocessing phase includes the FOV or mask generation, followed by the extraction of the ROI, denoising and enhancing the edge details using a Beltrami filter, and overall image enhancement based on contrast measurement and correction. Several brain structures and textures representing conventional features are extracted from the brain MRI in the second phase, which includes features based on matched filter, gradient-based matched filter features, gray-level co-occurrence matrix features, LBP features, and histogram of oriented features.
The conventional features obtained from the brain MRI images are then filtered to eliminate nonsignificant columns with zero values. Filtering is done to reduce the burden on the classifier and avoid overfitting. The features are then normalized using the Max-normalization method to fit the feature values in the range [0, 1]. The AD dataset obtained from the Kaggle repository has four classes: Mild (MD), moderate dementia (ModD), VMD, and ND class. Each class is assigned a numeric label from 0 to 3, respectively. A feature vector of 2,499 elements representing an automatically segmented single brain MRI image is then reduced in dimension using the principal component analysis algorithm to reduce the overhead on the ML classifier. The moderate class contains the minimum number of samples, which is only 52 for training and 12 samples for testing; whereas the non-demented class contains a maximum of 2,560 samples in the training set and 640 for the test. Therefore, for fair evaluation, 20% of the samples were chosen for testing during the binary classification, wherein all the demented classes were combined against the non-demented class. However, for the multiclass configuration, 10% of samples were used to test the SVM classifier. The block diagram in Figure 1 shows the CF-ML AD detection framework listing all the phases.
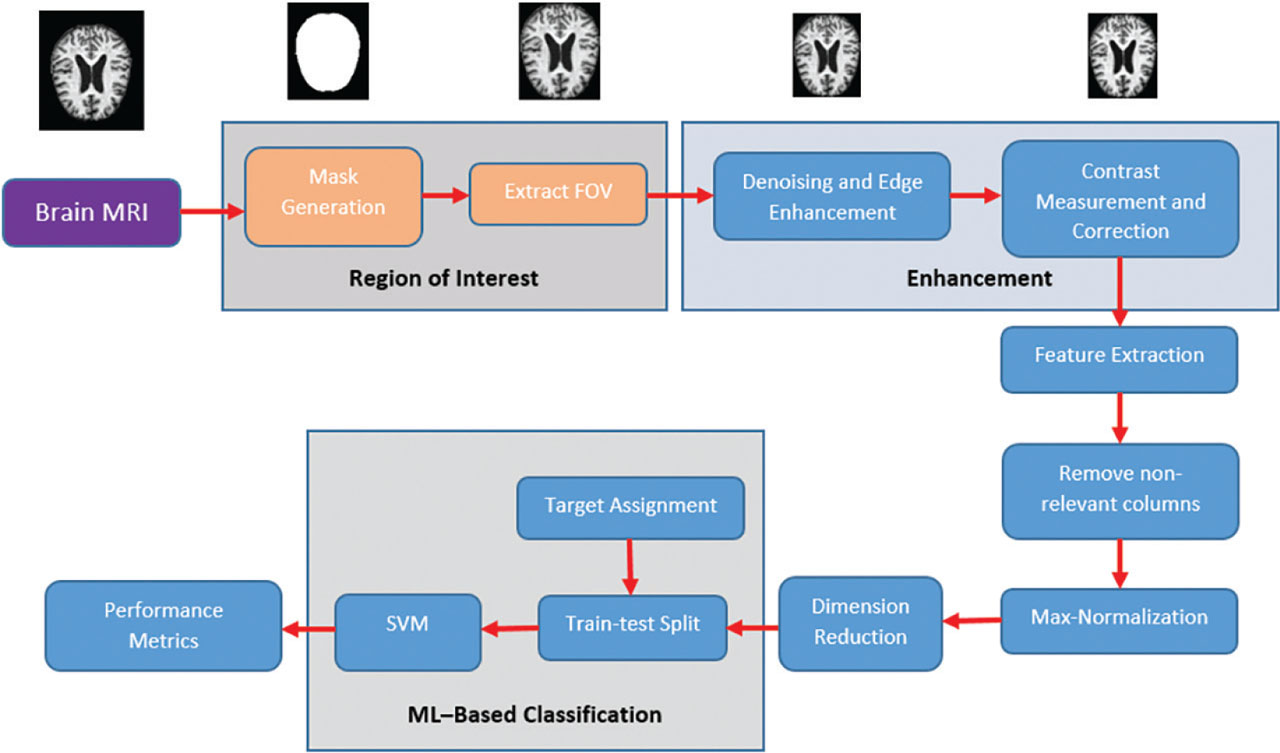
Figure 1:
The proposed CF-ML AD detection framework. AD, Alzheimer’s disease; CF-ML, conventional feature and machine learning; FOV, field-of-view; MRI, magnetic resonance imaging; SVM, support vector machines.
a. Preprocessing
The preprocessing approach we implemented in our work was inspired by previous studies [45] in medical image classification, in which image enhancement is applied to improve input quality for learning models. Specifically, the procedure described in [45], image standardization through resizing, noise suppression using filtering techniques, and contrast enhancement, were all considered as critical tasks that were necessary to maintain structural information and enhance the discriminative feature extraction. These insights informed our preprocessing pipeline framework and were customized to MRI-based stage prediction of AD.
The MRI brain images available with the Kaggle dataset are 2D in jpeg format and the pixel intensities are in the range [0, 255]. For constructing the mask of the FOV region, the intensities are transformed to the range [0, 1] by dividing each pixel by 255. The resultant real-valued image is subjected to an experimentally found threshold value of 0.08. The binary image is then multiplied by the original image to eliminate the isolated pixels. These isolated pixels are not part of the FOV region; however, the thresholding operation is unable to clean all the unwanted pixels outside the FOV region. To remove the remaining pixels outside the FOV region, the image is mean-filtered using a 3 × 3 kernel, followed by a morphological opening operation using a square element. Lastly, the image is binarized and the pixels are transformed in the range [0, 255].
After obtaining the mask of the actual brain MRI region, the FOV or ROI is automatically cropped. The occurrence of extreme non-black pixels (foreground) is found on all sides of the brain MRI. Once they are located, the image is cropped from all sides to obtain the ROI. Figure 2 shows the original image, the FOV, and the ROI.
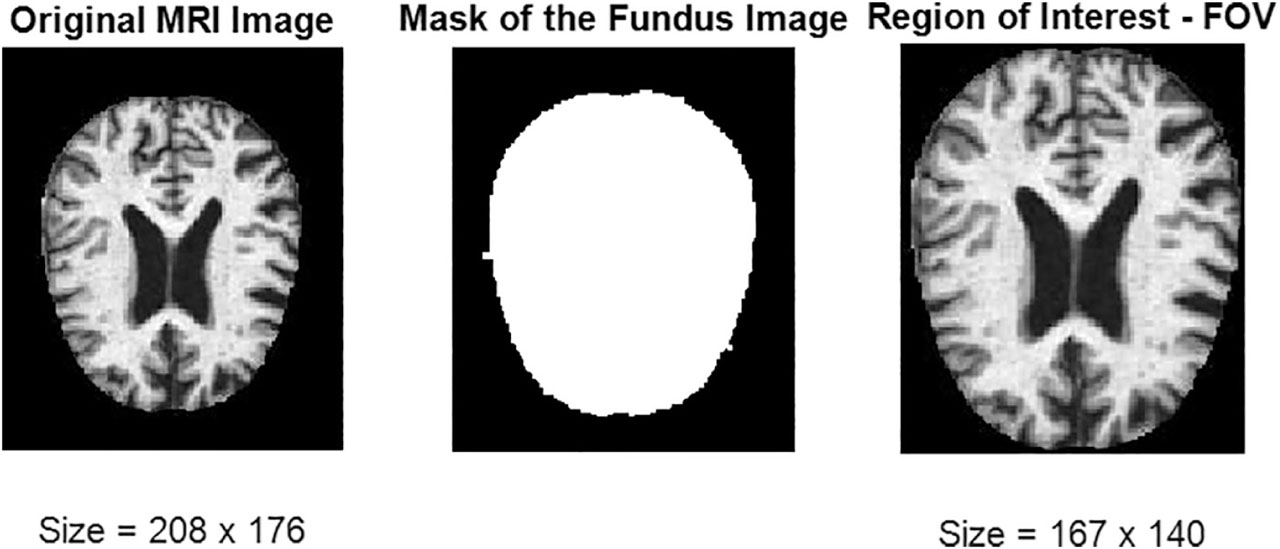
Figure 2:
The preprocessing phase. Original brain MRI image, the extracted FOV, and the region of interest. FOV, field-of-view; MRI, magnetic resonance imaging.
Different MRI images in the dataset result in different mask dimensions and hence different ROIs. Therefore, for equal feature dimensions, the ROI is resized to 160 × 128. The dimension of 160 × 128 is considered from extensive experimentation, ensuring that all the images in the dataset ensure minimum loss due to resizing. The following algorithm describes the sequence of operations carried out to obtain the mask and the ROI.
Algorithm 1 – ROI Extraction
Input – Brain MRI image (A)
Output – ROI of the Brain MRI
B = A./255.0
C = B>0.08
D = C.*A
E = meanfilter(D, 3)
F = imopen(E, ‘square’)
Mask = F > 0
FOV = Mask * 255
C1 = Find the extreme non-zero pixel column from the left of FOV
C2 = Find the extreme non-zero pixel column from the right of FOV
R1 = Find the extreme non-zero pixel row from the top of FOV
R2 = Find the extreme non-zero pixel row from the bottom of FOV
Ab = crop the original image A using C1, C2, R1, R2
b. Denoising and contrast enhancement
A patch-level image enhancement technique was suggested as an extension to the work proposed in [46]. The authors suggested an efficient edge preservation and noise-removing filter for grayscale and color images called the Beltrami filter. A 3D image is represented in 5D space using hybrid special-spectra {x, y, R, G, B} which includes the spatial coordinates, followed by the color component values. The edge-preserving and image-enhancing filter make use of time steps and epochs as tuning parameters. The filter is capable of removing weak textures and aliasing effects and preserves the object’s edges with a fine structure. Experiments conducted using several combinations of factors (time step and iterations) on brain MRI showed that five iterations with 0.005-time step value produce good results for the brain image.
Humans usually perceive image contrast which is governed by positional views and spatial positioning of the image. Measuring such image contrast is difficult. Different factors influence the image contrast such as intensity, chroma, contents of the image, distance of the viewer, and resolution. Simply, the contrast measure is the distance separated between the lowest intensity and the highest intensity pixel in the image [47]. Many fine and coarse contrast measuring schemes are found in the literature. Tadmor and Tolhurst’s [48] global approach is one of the methods to measure the contrast of images. The concept is modified and adapted to the difference of Gaussian (DoG) model. Figure 3 shows the output of Beltrami filtering and modified DoG filtering followed by contrast correction.
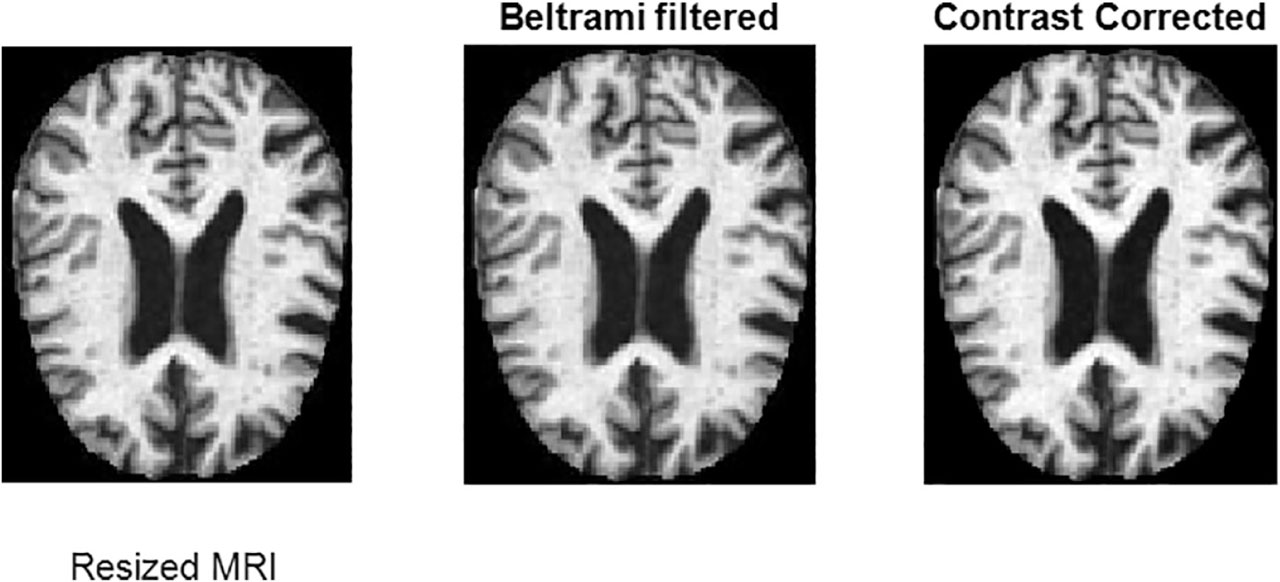
Figure 3:
The effect of denoising using Beltrami filter and enhancement using contrast measurement followed by correction. MRI, magnetic resonance imaging.
The following contrast correction technique (expressions 1, 2, and 3) was used over the brain MRI image to enhance the image quality for extracting quality features.
Where x is the contrast measure of the brain MRI scan image, Bt is the Beltrami-filtered image, and G is the contrast-corrected image.
c. Conventional features
The efficacy of the classifier depends on the features fed to it. The descriptors used to extract the textural and structural aspects of the brain region are responsible for the classifier’s performance. The extracted features should be discriminative to distinguish clearly between two different classes and their intra-class distance should be minimum. Visual perception of the brain MRI shows that the inter-class difference between demented and non-demented classes is unclear in early-stage AD. Thus, it becomes a difficult task to concentrate particularly in some specific regions of the brain. The descriptors should concentrate on every fine region and provide sufficient details. Figure 4 shows a sample from all the classes.
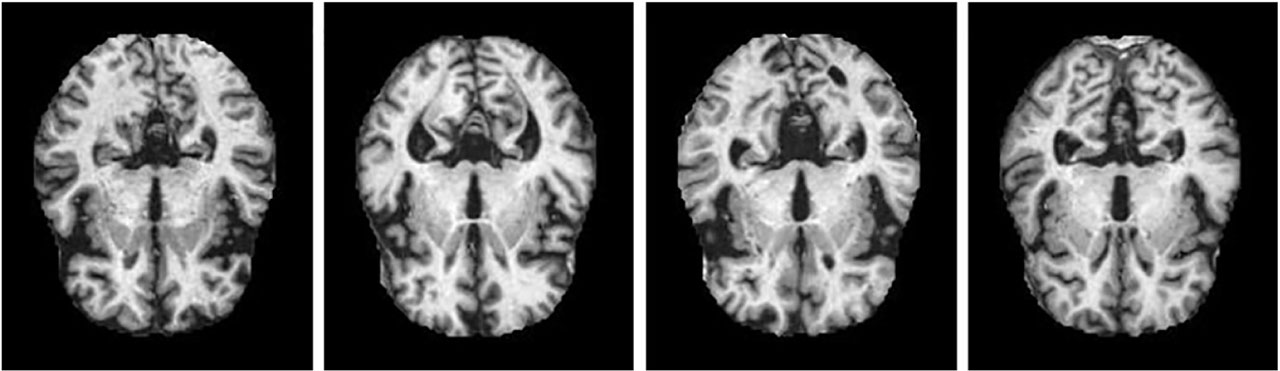
Figure 4:
Dataset samples from MD, ModD, ND, and VMD classes. MD, mild; ModD, moderate dementia; ND, non-dementia; VMD, very mild.
For a predictive model, feature selection is crucial as it is concerned with choosing relevant features that will represent the brain region and reduce the dimensionality of the input. Extensive experimentation using various descriptors was carried out on the brain MRI and the most significant descriptors were then added to the conventional feature phase. The authors of this paper believe that inter- and intra-edges of fine regions of the brain carry significant textural details concerning dementia. Patch-level information using binary patterns is a great source of textural details. Also, the gradient along multiple directions is sufficient to catch relevant information about the structure of the brain region. Global features concerning the overall contrast, correlation, characteristics of the regions, and energy are also added to the feature set. Figure 5 shows various descriptors with dimensions used in this work to extract relevant information from the brain region.
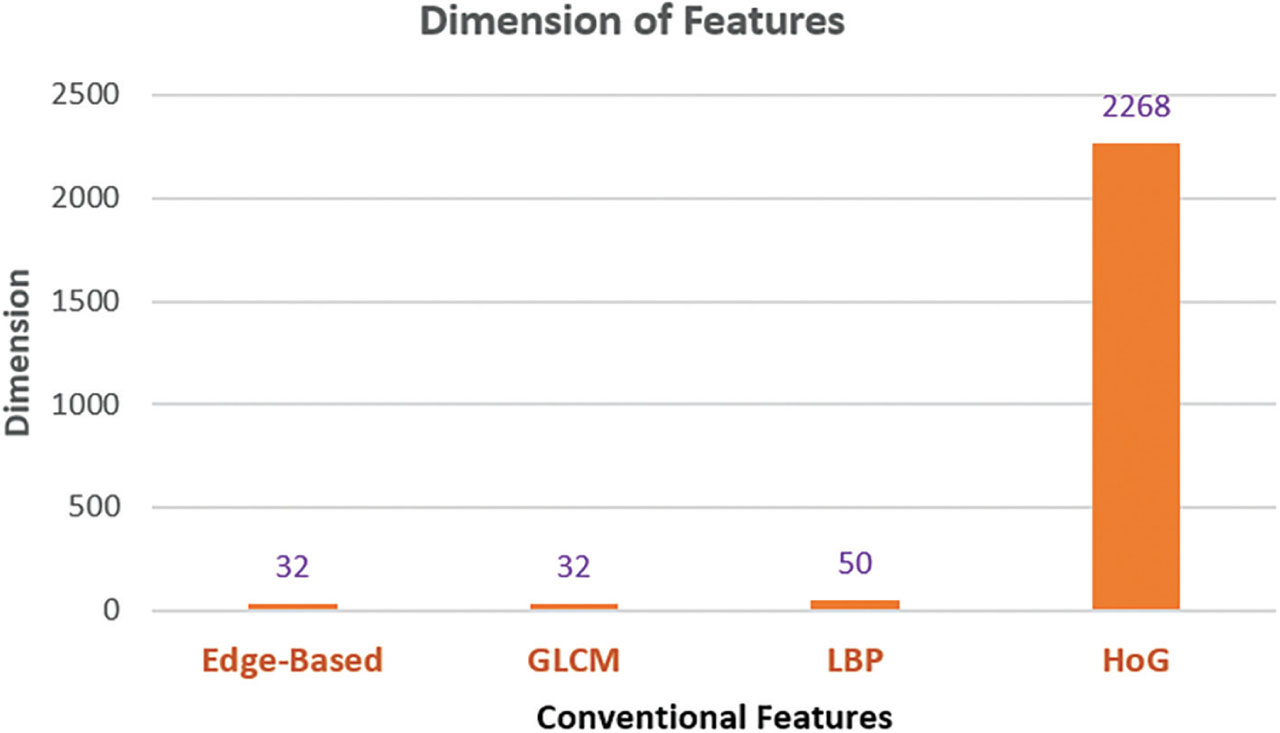
Figure 5:
Conventional features and their dimension. HoG, histogram of oriented gradient; LBP, linear binary pattern.
An edge informative filter using the “Sobel” operator was used with the value of sigma=[0.5, 1, 1.5, 2], length of the filter L=[9, 11, 13, 15] (length in Y-direction), and 12 orientations from [0 to 165 at an offset of 15) to obtain 32 elements in the features. Minimum loss due to edge miss was ensured using two such edge operators. The image-based measures which include energy, correlation, intensity, and homogeneity were captured using the GLCM-based descriptors. The patches in the cerebrum were considered in all eight directions for GLCM features for 64 intensity bins. The features computed in all eight directions were averaged and four features corresponding to four attributes were considered to represent the image.
LBP-based features were extracted directly from the segmented brain MRI and its first-order wavelet components using the “haar” mother wavelet. Ten such features are obtained from the brain MRI image and its four wavelet components. The LBP features were then concatenated to carry textural details using a 50-element vector. HoG-based features were extracted from the brain image using a cell size as that of [16]. The brain image was represented by a 2,268-element vector to represent the edge details in a more precise manner.
For instance, the three common feature descriptors of GLCM, LBP, and HoG were chosen in the present study due to their complementary capability to depict diverse image properties consistent with the pathology of AD. GLCM measures second-order texture statistics indicating tissue homogeneity and intensity correlation; LBP encodes local micro-texture variations that signify structural degeneration; and HoG highlights directional edge and gradient patterns corresponding to cortical boundary distortions. Incorporating these features gives a balanced manner and interpretability, which improve the discriminative ability of the ML classifier, while maintaining computational efficiency.
d. Feature processing
Manual inspection showed that out of 2,499 feature elements, 40 columns of the complete feature set were filled with null values. The empty or zero-valued columns were dropped down from the HoG feature set. The feature set was reduced to 2,599 dimensions after the removal of zero-valued columns. This was necessary to reduce the classifier burden and improve the classification accuracy while decreasing the false detection rate. The features were then normalized using the Max-normalization technique, which computes the maximum along all columns of the feature set and divides all values in the columns by the respective maximum value. The feature set is normalized in the range of [0, 1]. Furthermore, more significant features were considered by transforming the feature matrix to new coordinates using the PCA. Experimentation showed that the first few columns of the PCA matrix were capable of distinguishing the AD classes with higher accuracy.
e. The ML classifier
For the first time, SVM was used to classify between the demented and non-demented classes of AD. All the demented classes were grouped against the non-demented class while in the latter configuration, multiclass classification was performed with all four categories with the same SVM characteristics. The classifier was used with radial basis kernel function and “L1QP” solver in the case of binary configuration and “ISDA” for multiclass configuration.
f. The Kaggle AD dataset description
To evaluate the proposed CF-ML AD detection model in comparison to other competing models, data sourced from ADNI 1 were downloaded from the publicly available Kaggle data store (https://www.kaggle.com/datasets/tourist55/alzheimers-dataset-4-classof-Images). The dataset includes 6,400 brain MRI scan images partitioned into four different categories (MD, ModD, VMD, and ND). The classwise distribution is shown in Table 2. From input to the CF-ML AD detection model till the feature extraction process, the images in the dataset were maintained concerning the uniformity in dimensions, color, and quality. The dataset sample features (training and test samples) were shuffled to put them classwise for being appropriately labeled for binary and multiclass configurations. Finally, the features resulted in a division of 80% and 20% for training and testing purposes.
g. Experimentation and results
The proposed CF-ML AD detection framework is evaluated for two different configurations: binary and multiclass configuration. The binary configuration is constructed to balance the dataset consisting of two classes: one with no dementia and the other with demented classes. The analysis gives a clear picture of whether a subject is affected by AD or not. On the other hand, multiclass configuration considers all the AD stages differently concerning the ND class.
h. Binary classification
The dataset samples were divided into two categories: demented and ND. Table 3 shows the two classes formed using the four classes for binary classification. The demented classes including the MD, VMD, and ModD classes were grouped into a single class against the non-demented class. Binary labels 1 and 0 were assigned to the two classes, respectively, for the demented and non-demented classes. All the train and test sample features were aggregated, reduced using the PCA, and partitioned into a training and testing set with an 80:20 ratio (5,120:1,280 samples). Experiments showed that the first 25 PCA components were sufficient to distinguish the two classes with remarkable accuracy. Table 4 shows the training and test sample accuracy for various PCA components.
Table 3:
Kaggle dataset for binary classification
| Category | New class | Total samples |
|---|---|---|
| MD | Demented | 3,200 |
| ModD | ||
| VMD | ||
| ND | Non-demented | 3,200 |
Using the SVM classifier and an L1QP solver, varying the number of retained PCA components was performed to evaluate performance. As shown in Table 4, with 10 components, the model showed 99.55% training accuracy and an average test accuracy level of 93.30% over 20 iterations. By expanding the dimensionality to 15 components, we increased our performance again to 100% training accuracy and 98.82% mean test accuracy. More advanced performance gains were seen for 20 components as well—100% training accuracy and 99.29% mean test accuracy. The best performance was obtained with 25 components, resulting in 100% training accuracy and a mean test accuracy of 99.76%. All these results show that a greater proportion of the principal components retained through the L1QP-based SVM ensured overall improvement in classification accuracy.
i. Multiclass classification
The dataset samples for the multiclass configuration were used with their original categories. That is, all four classes were considered for the classification exploiting only the training and test set samples that were initially put together and then partitioned in an 80:20 ratio. Table 5 shows the numeric labels used for the classes before they were fed to the classifier.
Table 5:
Dataset categories and their numeric labels for multiclass configuration
| Category | Labels |
| MD | 1 |
| ModD | 2 |
| VMD | 3 |
| ND | 0 |
For multiclass configurations, the classifier parameters were kept constant. However, due to the scarcity of samples for MD and ModD, the test samples were reduced to 10%. Due to an unbalanced dataset, where the non-demented samples are in the majority, there is a possibility that during testing the lower classes may be misclassified. Increasing the training samples improves the classifier training and eventually enhances the classification accuracy. Table 6 shows SVM performance for a multiclass configuration. The number of optimum PCA components for the binary class was 25. However, increasing the number of PCA components in the binary case degraded the classifier performance. For multiclass, the number of PCA components was reduced to 13 to mitigate the chances of redundancy. The CF for one of the test sample combinations for the multiclass classification is shown in Figure 6. Here, SVM with an “ISDA” solver was used.
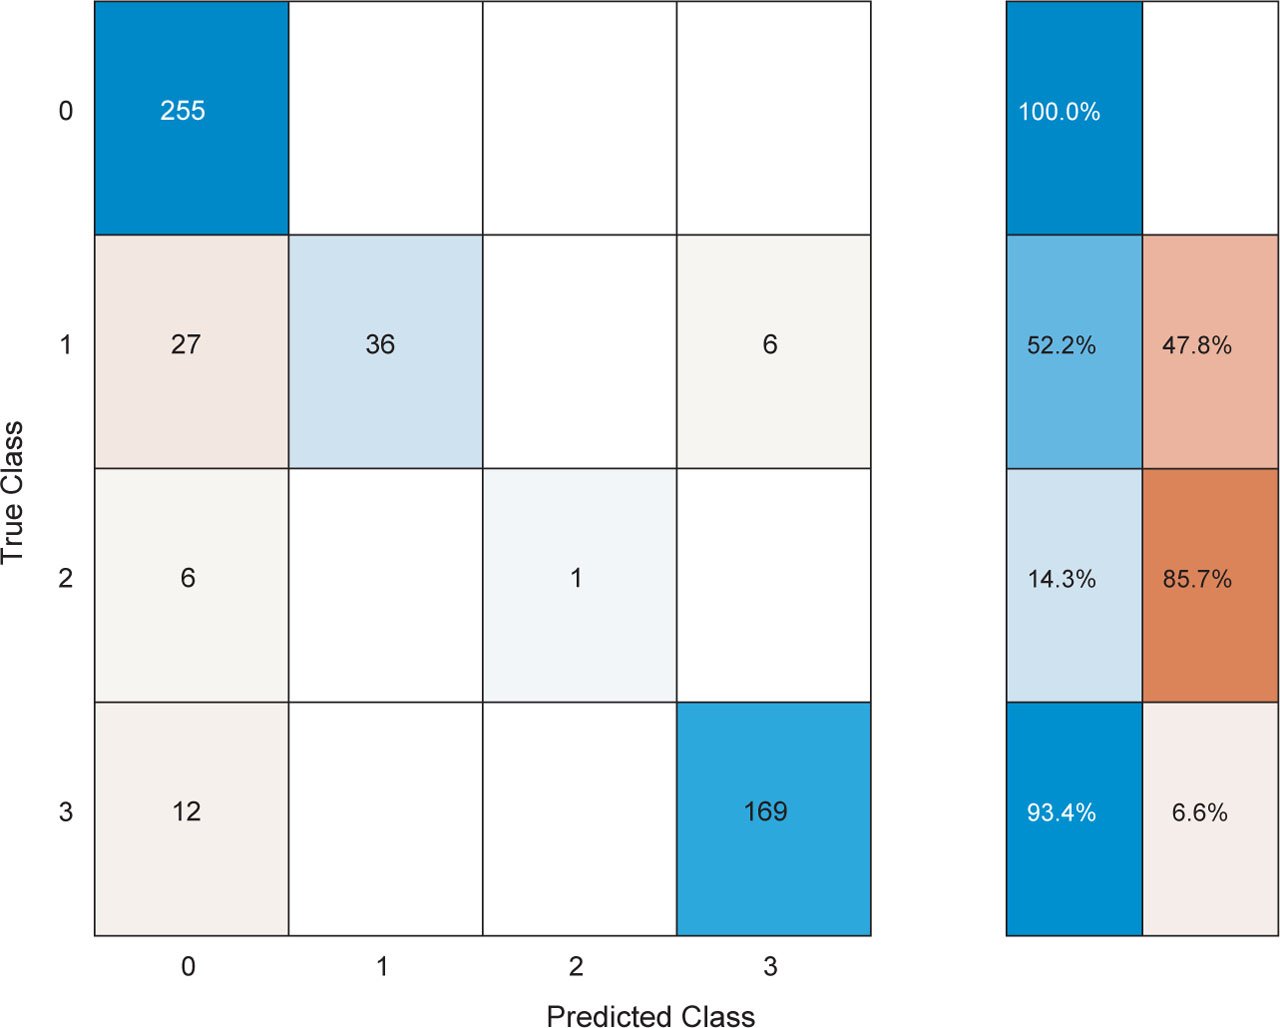
Figure 6:
CF for multiclass configuration. CF, conventional feature.
Table 6:
Accuracies over the train and test samples concerning the number of PCA components
| Number of PCA components | Accuracy over the training set (%) | Accuracy over the test set (%) |
|---|---|---|
| 10 | 99.22 | 88.75 |
| 11 | 99.64 | 88.75 |
| 12 | 99.91 | 90.78 |
| 13 | 99.97 | 98.82 |
The works [49] and [50] analyzed ML techniques as prediction frameworks, which served as a critical referent for the methodological design within this research. Showing how ML algorithms work in modeling complex and non-linear structured data, this paper shows us the potential of data-driven predictive modeling beyond classical statistical models. In the context of AD stage prediction using MRI data, this discovery prompted exploring different ML techniques in a traditional feature-based approach for capturing subtle discriminative patterns linked with neurodegenerative decline. Thus, this study broadens the predictive modeling approach based on the work cited to medical imaging data, which improves the reliability of dementia stage classification while still being computationally efficient and interpretable.
The work further verifies the robustness and comparative performance of the proposed CF-ML model, and compares it with a few well-known ML algorithms, such as LR, NB, DT, k-nearest neighbors, and RF. We conducted a comparative study with several well-established ML algorithms. All models were trained and tested on the same dataset, preprocessing process, and parameter arrangement, with a view to the fair and reproducible evaluation. Taken at a higher scale, Table 7 shows that the CF-ML model achieves superior performance on all evaluation metrics compared with conventional classifiers. It hits a stunning 98.82% accuracy along with an impressive F1-score—97.77%—demonstrating impressive balancing between the precision and recall. That is a performance improvement of ∼9%–15% compared with the most excellent baseline (RF). The better performance and success are the result of a hybrid learning mechanism and the enhanced feature integration strategies applied within CF-ML, which add discriminative strength and generalization effectiveness. Such results verified that our model gives not only high prediction accuracy but is also computationally profitable and scalable.
j. Comparison with other competing research
Table 8 compares the proposed model to the most binary configuration of recent state-of-the-art models using different datasets. The suggested CF-ML AD detection model for binary configuration ranked best in all the classification accuracy, while the same model when used for multiclass configuration results in encouraging performance.
Table 8:
Performance of the suggested CF-ML AD detection model versus different recent competing models (binary class configuration)
| Reference | Year | Dataset | Classifier model | Accuracy (%) |
|---|---|---|---|---|
| Sun et al. [51] | 2022 | OASIS | CNN | 99.68 |
| Tuvshinjargal and Hwang [52] | 2022 | Kaggle | Pretrained models | 77.40 |
| Sethuraman et al. [53] | 2023 | ADNI | Pretrained models | 96.61 |
| Balaji et al. [54] | 2023 | Kaggle | CNN-LSTM | 98.50 |
| El-Latif et al. [55] | 2023 | Kaggle | Lightweight CNN | 99.22 |
| Shojaei et al. [56] | 2023 | ADNI | 3D-CNN | 96.60 |
| Salehi et al. [57] | 2023 | Kaggle | LSTM | 98.62 |
| Sorour et al. [58] | 2024 | Kaggle | CNN-LSTM | 99.92 |
| Sener et al. [59] | 2024 | ADNI | Pretrained models | 99.58 |
| Zhang and Wang [60] | 2024 | ADNI | Pretrained models | 98.87 |
| Proposed CF-ML Model | 2024 | Kaggle | SVM | 99.76 |
Because of the quality discerning features over the ROI and selection of sufficient PCA components, the CF-ML AD detection model benefited from AD early prediction using the MRI scan brain images. The suggested CF-ML AD detection model outperformed other competing models regarding classification accuracy in the case of the binary configuration. Although researchers have adopted different methodologies, especially data augmentation and type of dataset, the CF-ML AD detection scheme outperformed in the binary classification case. The dataset samples were used in their original form without augmentation.
Table 9 presents an evaluation of the proposed CF-ML model using the same Kaggle dataset along with previous approaches published in the literature. The studies list includes well-known ML models, which are used for data analytics, as well as more advanced DL architectures, like VGG-16, ResNet-18, Inception v1, DenseNet variants, and hybrid convolutional architectures. Earlier ML models and simple CNN models obtained accuracies of 83%–94%; however, new hybrid DL approaches (e.g., Raj et al., 2025) attained a performance of up to 97.88% as well. It has been found that the CF-ML model has the highest accuracy (98.82%) among the existing methods. This performance shows that combining both collaborative filtering-based feature learning with ML optimization results in higher accuracy and generalizations as compared with both pure ML and DL models. The ratio of training and test samples was common and was set to 90%:10%.
Table 9:
Performance of the suggested CF-ML AD detection model versus different recent competing models (multiclass configuration)
| Reference | Year | Dataset | Classifier model | Accuracy (%) |
|---|---|---|---|---|
| Wang et al. [61] | 2016 | Kaggle | ML | 93.05 |
| Beheshti et al. [62] | 2017 | Kaggle | FR-GA-ML | 84.17 |
| Altaf et al. [63] | 2017 | Kaggle | Pretrained network | 92.48 |
| Srivastava et al. [64] | 2021 | Kaggle | VGG-16 | 96.20 |
| ResNet-18 | 87.50 | |||
| AlexNet | 91.40 | |||
| Inception v1 | 88.60 | |||
| Custom CNN | 96.20 | |||
| Nagarathna and Kusuma [65] | 2022 | Kaggle | CNN | 83.53 |
| HCNN | 95.52 | |||
| Sharma et al. [66] | 2022 | Kaggle | Hybrid DenseNet121 | 89.89 |
| Hybrid DenseNet201 | 91.75 | |||
| Saleh et al. [67] | 2023 | Kaggle | Pretrained network | 96.05 |
| Balasundram et al. [68] | 2023 | Kaggle | CNN | 94.10 |
| Tripathy et al. [69] | 2024 | Kaggle | CNN | 96.25 |
| Raj et al. [70] | 2025 | Kaggle | Hybrid DL | 97.88 |
| Proposed CF-ML Model | 2025 | Kaggle | CF-ML | 98.82 |
IV. Discussion
This work emphasizes efficient preprocessing for the ML perspective in medical imaging and the respective contribution to future AD detection mechanisms. Table 6 depicts a comparison between the proposed CF-ML model and the datasets used by different authors for evaluating the performance. Additionally, the processing time for learning and testing is computed in the case of the CNN-LSTM approach suggested in [56], for different models with and without augmentation. Their best performance of 99.92% accuracy was obtained using the CNN-LSTM model with augmented data and executed in a Python environment. Their model consumed a training time of 360 s while 9 ms was required to test the samples. The system was unable to perform at its best due to low samples in two categories: namely, the MD and ModD. However, a few samples in the Normal categories are ambiguous when checked manually. Therefore, 15 samples were misclassified, where five samples belonged to Normal, seven belonged to ModD, and the remaining three were from the MD category. For binary classification, since the samples from all other categories with respect to the Normal class were considered in a single class, the proposed system obtained 99.76% accuracy. The efficient preprocessing stage and the effective representation using quality features helped the networks to perform better in both binary and multiclass classifications.
Excluding the time required to extract the features in the proposed CF-ML model, the SVM required just 6.87 s with 25 PCA components to train over 80% of samples, while the SVM classified 20% of the samples in just 0.03 s. The training and testing time with the CF-ML approach for multiclass configuration with 13 PCA components on 90% of data samples was 2.03 s and 0.03 s, respectively. The proposed CF-ML model was implemented using MATLAB 2019 b on a Windows 11 environment, INTEL i5 CPU (2.84 GHz), 16 GB RAM, and 512 GB SSD.
For real-time scenarios, data samples without augmentation are favored for immediate response in categorizing the AD samples. Also, augmentation increases the chances of redundancy and eventually increases the chances of overfitting in the case of CNNs. On the other hand, an increase in the sample size increases the computational time and complexity. The proposed model considers the data in its original form without augmenting it.
V. Conclusion
Overall, the novelty presented in this work is clear in the form of a hybrid methodological study model that combines classical ML with collaborative feature learning, a customized preprocessing process that enables higher quality and better region extraction, as well as a generalizable evaluation framework that is validated on both the binary and multiclass contexts without any data augmentation. In addition, the proposed CF-ML framework obtains an impressive accuracy of 98.82% on the Kaggle AD dataset and sets a new paradigm of interpretable and efficient detection of AD from MRI scans. As a further methodological and experimental departure from available DL-based methods, this work strikes a balance between accuracy, interpretability, and computational efficiency.
Early and prevalent AD indications can be diagnosed from prominent clinical impairments, disorientations, and memory deficits. The early symptoms deteriorate with time and adversely affect the subject’s wellbeing. Despite the remedies and cures for AD remaining elusive, timely diagnosis and preventive measures can improve the patient’s quality of life and slow down the negative progression. As compared with other medical sources, MRIs are more accurate in diagnosing and detecting the presence of AD. What is required in the case of AD is timely, fast, and accurate detection of AD progression. Without using large layer networks, the work focuses on efficient preprocessing of the MRI scan images to extract quality-relevant features to represent the AD stages correctly and discriminately. The objective is to reduce the classifier burden of handling large data and to improve the response time to AD detection.
The work achieved the highest classification accuracy ever on AD for the binary class category detecting non-demented and demented classes. The conventional descriptors employed to extract features especially concentrate on the edge details, texture information, and overall image-based values. However, the CF-ML approach needs improvement for multiclass configuration. More textural and structural aspects of the brain MRI can be concentrated upon to improve the inter-class difference typically for the MD and VMD categories. Also, DL models can be incorporated to obtain more efficient and reliable findings to have a favorable effect on the classification.
In future work, the CF-ML framework can be extended by incorporating clinical metadata such as age, gender, and cognitive assessment scores alongside MRI-derived features. This multimodal integration has the potential to further enhance diagnostic performance and provide a more holistic understanding of AD progression. Future work will investigate supervised dimensionality reduction and regularized approaches to further ensure the clinical relevance of retained features. We will incorporate systematic selection strategies to ensure statistically grounded component determination. Also, incorporating cost-sensitive learning strategies or data-level balancing methods represents an important direction for future work and may further enhance robustness in multiclass dementia-stage prediction. By combining imaging biomarkers with patient-specific clinical information, the proposed approach could achieve greater predictive accuracy, improved interpretability, and stronger clinical applicability, paving the way for a more personalized and comprehensive diagnostic system. Future work will extend the framework to volumetric MRI data to exploit 3D anatomical context and minimize compression-related distortions for improved clinical relevance. Also, broader external validation across multiple public neuroimaging datasets will be incorporated to further strengthen generalization claims.