
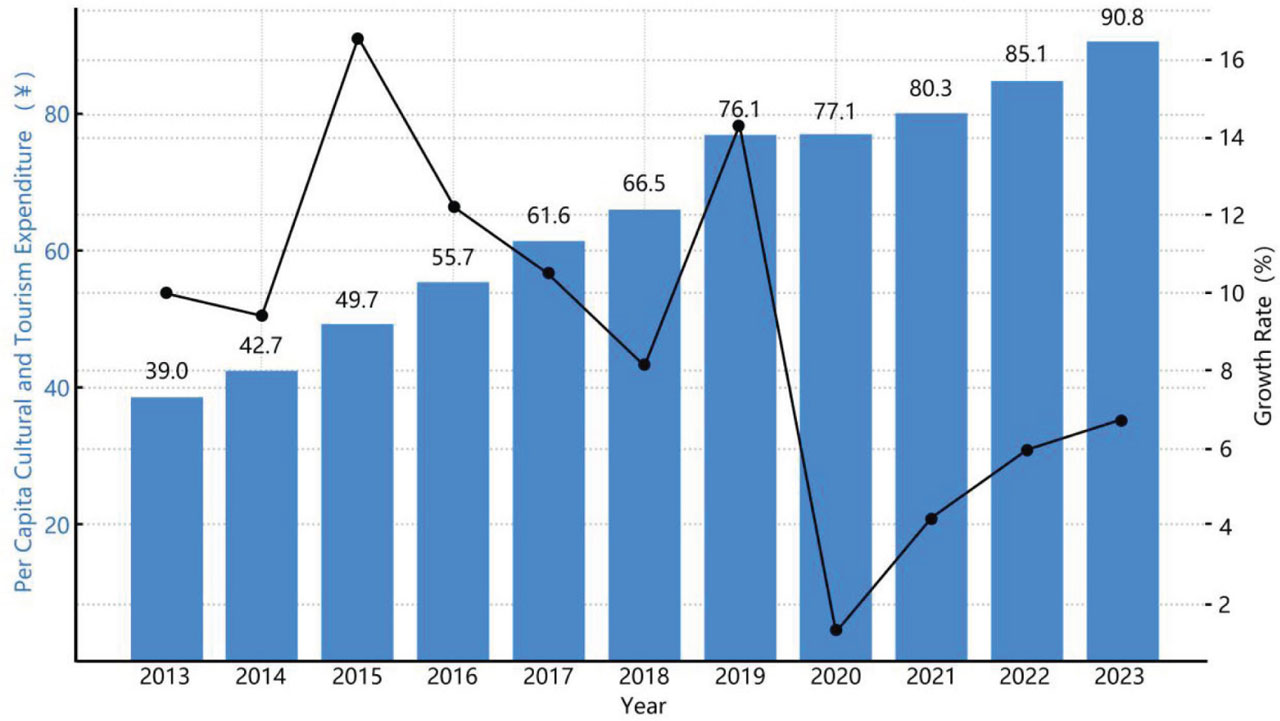
Figure 1:
Per capita expenditure on culture and tourism and growth rate, 2013–2023
Source: Ministry of Culture and Tourism of the People’s Republic of China, 2024.
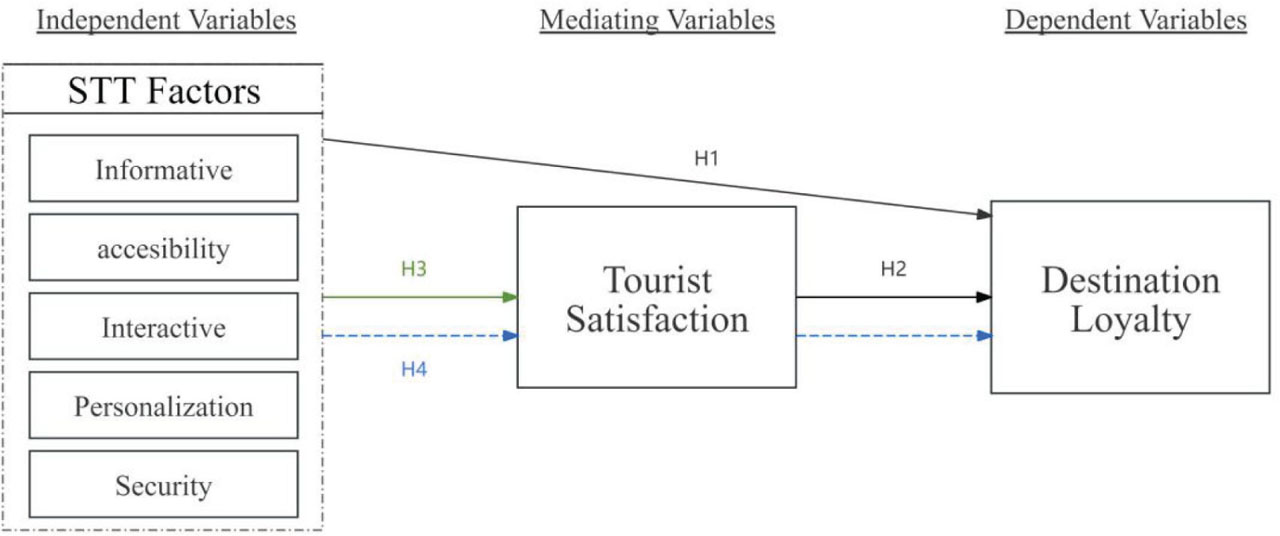
Figure 2:
Conceptual framework. STT, Smart Tourism Technology.
Table 1:
Sample profile
| Characteristic | Category | N | Percentage (%) |
|---|---|---|---|
| Gender | Female | 285 | 51.8 |
| Male | 265 | 48.2 | |
| Total | 550 | 100.0 | |
| Age | 18–25 years | 126 | 22.9 |
| 26–35 years | 145 | 26.4 | |
| 36–45 years | 118 | 21.5 | |
| 46–55 years | 97 | 17.6 | |
| Over 55 years | 64 | 11.6 | |
| Total | 550 | 100.0 | |
| Marital status | Single | 132 | 24.0 |
| Married | 126 | 22.9 | |
| Widowed | 131 | 23.8 | |
| Divorced | 123 | 22.4 | |
| (Other/unknown) | 38 | 6.9 | |
| Total | 550 | 100.0 | |
| Education level | Diploma/A-level | 88 | 16.0 |
| High school graduate | 87 | 15.8 | |
| Master’s degree | 86 | 15.6 | |
| Bachelor’s degree | 82 | 14.9 | |
| Ph.D/Doctoral | 73 | 13.3 | |
| Some college, no degree | 69 | 12.6 | |
| Less than high school | 65 | 11.8 | |
| Total | 550 | 100.0 |
Table 2:
Measurement model
| Construct | CA | AVE | CR |
|---|---|---|---|
| STT - INF | 0.815 | 0.732 | 0.891 |
| STT - ACC | 0.829 | 0.662 | 0.886 |
| STT - INTER | 0.811 | 0.638 | 0.876 |
| STT - PERS | 0.820 | 0.650 | 0.881 |
| STT - SECUR | 0.734 | 0.653 | 0.849 |
| TS | 0.929 | 0.612 | 0.940 |
| DL | 0.894 | 0.612 | 0.917 |
Table 3:
Discriminant validity (HTMT ratios)
| ACC | DL | INCL | INF | INTER | PERS | SECUR | TS | ||
|---|---|---|---|---|---|---|---|---|---|
| 1 | ACC | ||||||||
| 2 | DL | 0.625 | |||||||
| 3 | INCL | 0.309 | 0.385 | ||||||
| 4 | INF | 0.485 | 0.668 | 0.317 | |||||
| 5 | INTER | 0.477 | 0.662 | 0.268 | 0.541 | ||||
| 6 | PERS | 0.391 | 0.574 | 0.186 | 0.389 | 0.359 | |||
| 7 | SECUR | 0.465 | 0.668 | 0.230 | 0.480 | 0.526 | 0.423 | ||
| 8 | TS | 0.600 | 0.796 | 0.377 | 0.628 | 0.635 | 0.552 | 0.608 |
Table 4:
Summary of direct effects
| Hypothesis | Path | Path coefficient | t-value | p-value | Result |
|---|---|---|---|---|---|
| H1a | INF → DL | 0.090 | 2.682** | 0.007 | Supported |
| H1b | ACC → DL | 0.102 | 2.791** | 0.005 | Supported |
| H1c | INTER → DL | 0.084 | 2.426* | 0.015 | Supported |
| H1d | PERS → DL | 0.087 | 2.824** | 0.005 | Supported |
| H1e | SECUR → DL | 0.115 | 3.509*** | 0.000 | Supported |
| H2 | TS → DL | 0.188 | 3.549*** | 0.001 | Supported |
| H3a | INF → TS | 0.106 | 2.979** | 0.003 | Supported |
| H3b | ACC → TS | 0.139 | 3.746*** | 0.000 | Supported |
| H3c | INTER → TS | 0.121 | 3.447** | 0.001 | Supported |
| H3d | PERS → TS | 0.122 | 3.488*** | 0.000 | Supported |
| H3e | SECUR →TS | 0.096 | 2.616** | 0.009 | Supported |
Table 5:
Summary of mediation effects through TS
| Hypothesis | Path | Direct effect | Indirect effect | Total effect | p-value | Mediation type |
|---|---|---|---|---|---|---|
| H4a | INF → TS → DL | 0.090** | 0.020* | 0.110 | 0.020 | Partial |
| H4b | ACC → TS → DL | 0.102** | 0.026* | 0.128 | 0.024 | Partial |
| H4c | INTER → TS → DL | 0.084* | 0.023* | 0.107 | 0.011 | Partial |
| H4d | PERS → TS → DL | 0.087** | 0.023* | 0.110 | 0.013 | Partial |
| H4e | SECUR → TS → DL | 0.115*** | 0.018* | 0.133 | 0.029 | Partial |