
I. Introduction
Tourism is a vital component of China’s economic and commercial fabric, significantly contributing to GDP, employment, and regional development (United Nations World Tourism Organization, 2023). The country has solidified its position as a top international travel destination, drawing in visitors from nations including Thailand, Japan, South Korea, Russia, and the United Kingdom. Official data from China’s Ministry of Culture and Tourism reports that the country received about 64.88 million international tourist arrivals in 2024. This figure represents a substantial year-on-year surge of 82.9%, fueled in part by 20.11 million visa-free entries, which alone saw a remarkable 112.3% increase (The State Council of the People’s Republic of China, 2024). This robust growth signals a powerful rebound for China’s inbound tourism sector in the post-pandemic era.
Domestic tourism has also demonstrated exceptional expansion. Statistics from China’ Ministry of Culture and Tourism (2024) reveal a significant upward trend in per capita spending on cultural and tourism activities, which climbed steadily from 39 yuan (US$5.43) in 2013 to 90.8 yuan (US$12.65) in 2024, even accounting for the disruption caused by the COVID-19 pandemic in 2020. This consistent growth trajectory highlights sustained consumer confidence and points to the resilience and increasing economic importance of the domestic tourism market. As illustrated in Figure 1, the steady rise in per capita expenditure underscores the sector’s durability and its expanding role in the national economy. Given this robust growth, understanding the factors that sustain it, such as destination loyalty, becomes critically important (Ministry of Culture and Tourism of the People’s Republic of China, 2024).
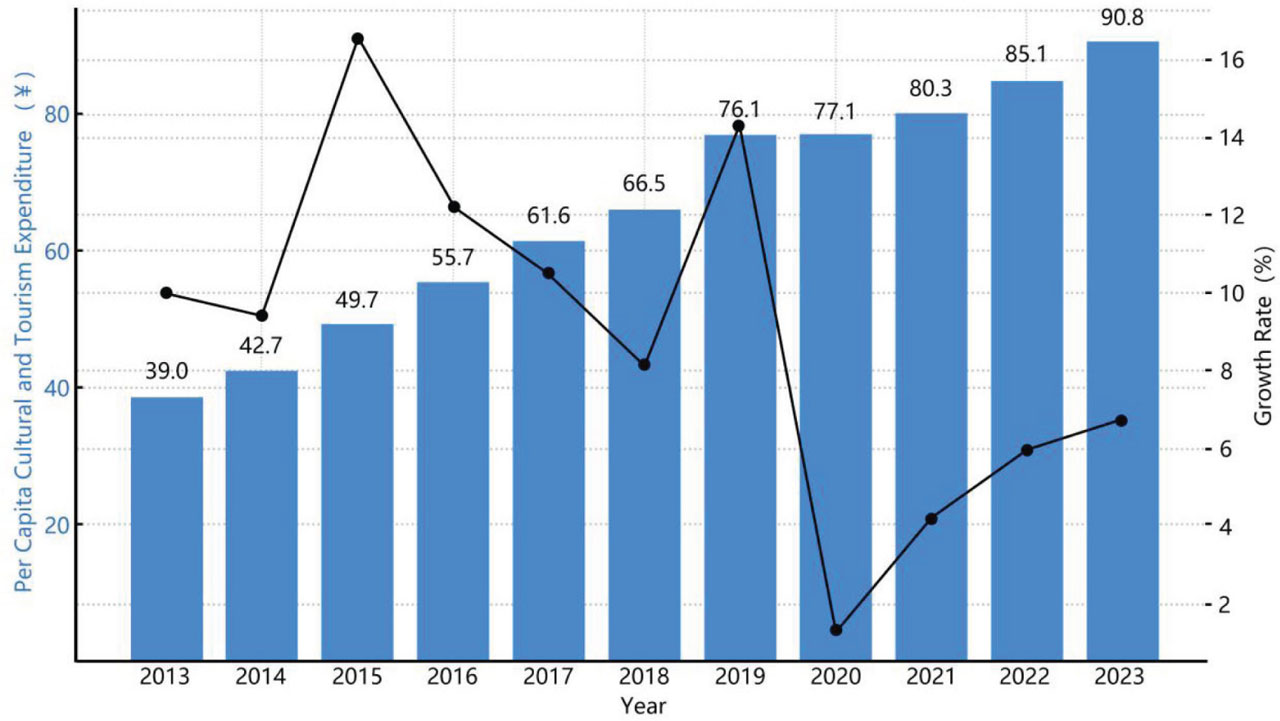
Figure 1:
Per capita expenditure on culture and tourism and growth rate, 2013–2023
Source: Ministry of Culture and Tourism of the People’s Republic of China, 2024.
Destination loyalty (DL) is greatly recognized as a pivotal key role influencing the sustainability and economic prosperity of tourist destinations. Defined as tourists’ intention to revisit a destination and recommend it to others based on their overall satisfaction, DL directly impacts a destination’s economic growth, reputation, and long-term viability (Oppermann, 2000; Yoon & Uysal, 2005). This can be seen as a mirror reflection of tourists in terms of their emotional attachment, positive perception, and satisfaction through their experience during traveling. Loyal tourists serve as valuable informal ambassadors, sharing positive experiences and encouraging further visitation through word-of-mouth marketing, thereby significantly enhancing the destination’s competitive advantage and economic resilience.
A recent systematic review by Singh et al. (2022), have synthesized and acknowledged the existing literature on destination loyalty, suggesting that there are still many facets of the topic that need exploration, including the impact of new variables and the changing dynamics of tourist behavior. Recent studies on DL in tourism have advanced our understanding of what influences a tourist’s likelihood to revisit and recommend a place. DL is no longer a one-piece concept; however, DL has become a construct with multiple dimensions or interconnections. Williamson and Hassanli (2022) categorize DL into four types, namely homogeneous, horizontal, vertical, and experiential, indicating a more deeply, extensive understanding of loyalty beyond just repeat visitation.
Yet, with the rise of digital and virtual experiences, the definition of DL is changing, presenting a contemporary challenge for researchers (Almeuda and Moreno, 2017). This is where Smart Tourism Technology (STT) becomes relevant. STT refers to an interconnected system of technologies, including mobile apps, QR codes, IoT sensors, and big data analytics that enhances the tourism experience by providing real-time information, personalized services, and interactive platforms (Lin & Zhong, 2026). It becomes “smart” by leveraging data to create a seamless, integrated, and value-added experience for tourists before, during, and after their trip. Smart tourism represents a contemporary phenomenon in the travel and tourism sector. It consists of three elements and layers: smart destination, smart business ecosystem, and smart experience, all of which are based on data gathering, sharing, and processing (Li et al., 2017; Kim et al., 2012). According to Li et al. (2017), the omnipresent tour with information service and allowing tourists to access it freely comprise the essence of smart tourism. It is a mobile information system that combines data and actual infrastructure to provide tourists with a novel experience (Yoo et al., 2017). Another aspect worth considering is the impact of technological advancements on tourist experiences and loyalty. In the digital era, the ease of accessing information and the role of online reviews have become increasingly influential. Shariffuddin et al. (2023) emphasized how digital platforms shape tourists’ perceptions and choices, potentially affecting their loyalty to a destination through a study in Kuala Lumpur, Malaysia. Authenticity remains important for destination loyalty, yet digital platforms and virtual experiences are reshaping tourist perceptions, requiring further exploration of technology influence.
Despite the growing body of research on STT and loyalty, a significant gap remains. Most studies treat STT as a monolithic construct or focus on its general impact. There is limited understanding of how the specific, individual attributes of STT, such as information quality, accessibility (ACC), and security (SECUR), differentially influence loyalty, particularly in the unique context of cultural heritage cities. Furthermore, the psychological mechanism through which these technical attributes translate into emotional loyalty is not fully unpacked.
A growing body of research underscores a significant positive relationship between the use of STT and destination loyalty, which can be explained through multiple experiential pathways. Specifically, STT enhances DL by enriching the overall travel experience, facilitating more profound and memorable impressions (Yoon & Uysal, 2005). Furthermore, the provision of personalized and interactive experiences through STT has been identified as a key mechanism fostering loyalty (Zhan, 2019). Similarly, Zhang (2023) emphasizes the role of STT in delivering relevant and accurate information, which aids tourists in making informed decisions and helps build sustained emotional connections with a destination.
Against this theoretical backdrop, Luoyang City presents a compelling empirical context for examining these relationships. As an ancient Chinese capital and a UNESCO World Heritage site, it attracts substantial domestic and international visitors (The People’s Government of Henan Province, 2023). More importantly, the city’s ongoing integration of STT within its rich cultural heritage offers a unique setting to investigate how modern technology interfaces with traditional tourism resources. Despite its clear tourism significance, the role of STT in shaping DL in Luoyang remains underexplored. Therefore, the primary motivation of this research is to fill this gap by empirically testing a multi-dimensional model of STT in a heritage context, thereby providing a nuanced understanding of technology-driven loyalty formation. This research gap underscores the dual contribution of the present study: it not only extends the theoretical discourse on technology-driven loyalty but also provides actionable insights for managing heritage tourism destinations in the digital age.
II. Literature Review and Research Hypotheses
The attributes of STT, as conceptualized by Buhalis (2020), include information, ACC, interactivity, personalization, and SECUR. These attributes form a valuable theoretical basis for understanding the impact of STT on tourist satisfaction (TS). The inclusion of these five specific factors is grounded in the Technology Acceptance Model (TAM) and Service Quality literature, which posits that perceived ease of use (ACC, interactivity) and perceived usefulness (information, personalization, SECUR) are fundamental drivers of user satisfaction and subsequent behavioral intentions (Davis, 1989; Parasuraman et al., 1988).
Information is a crucial attribute of Perceived STT that significantly influences destination loyalty. The quality, credibility, and accuracy of information provided by STT play a vital role in shaping tourists’ perceptions and attitudes toward a destination (Li et al., 2017; Qian et al., 2023). Tourists rely on information to make informed decisions about their travel plans, and the availability of accurate and reliable information enhances their likelihood of returning to a destination (Yang et al., 2020).
ACC refers to the ease with which tourists can access and use tourism information provided by STT. This includes the availability of Wi-Fi, mobile applications, and other digital platforms that allow tourists to access information and services conveniently (Masri et al., 2017; Setiawan et al., 2024). High-quality ACC enhances the perceived ease of use of STT and improves tourists’ relationship with the destination (Wang & Li., 2020). When STT is easily accessible and user-friendly, tourists are more likely to use these technologies to obtain information at all stages of their trip, thereby enhancing their bond with the destination and increasing the likelihood of return visits (Huang, 2020).
Interactivity is a crucial attribute of STT that facilitates two-way communication between stakeholders and enhances the tourist-destination relationship. The interactivity of STT allows for timely and active communication between tourists, tourism operators, and other stakeholders, thereby facilitating deeper engagement with the destination (Yoo et al., 2017). High-level interactivity encourages active use of STT and contributes to stronger DL by allowing tourists to engage with the destination in a more meaningful way (Cai & Zhang, 2015).
Personalization is an important attribute of STT that involves tailoring services to meet the specific needs and preferences of tourists, thereby maximizing their connection to the destination. Customized services reduce the opportunity cost and duration of information searching, thereby improving tourists’ overall experience and their loyalty to the destination (Schaupp & Bélanger, 2005; Ng et al., 2023).
SECUR is a critical attribute of STT that involves protecting tourists’ personal information and ensuring the safety and SECUR of their online transactions (Dziurakh et al., 2024). A study by Buhalis et al. (2020) found that SECUR significantly influenced tourists’ loyalty toward a destination. The study concluded that high-quality SECUR measures are essential for building trust and confidence among tourists, thereby enhancing their relationship with the destination. Another study by Singh (2018) found that SECUR is a valuable dimension of STT that contributes to destination loyalty.
Based on the literature review, the aims of this research is to investigate the interplay of STT on TS and DL within Luoyang City. The conceptual framework of this study is shown in Figure 2. With that, research hypotheses of this work are outlined below into subsets based on these categorizations as per the research objectives:
H1: The STT factors (comprising Informative, ACC, Interactive, Personalization, and SECUR) have a positive effect on destination loyalty.
H2: TS has a positive effect on destination loyalty.
H3: The STT factors (comprising Informative, ACC, Interactive, Personalization, and SECUR) have a positive effect on TS.
H4: TS mediates the relationship between STT factors (Informative, ACC, Interactive, Personalization, and SECUR) and destination loyalty.
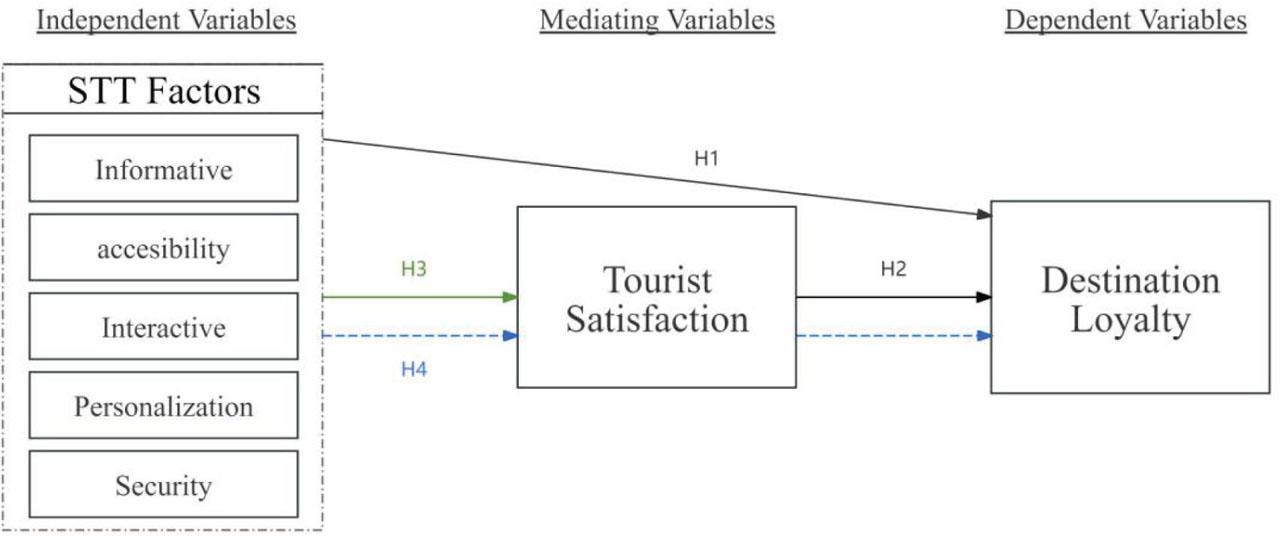
Figure 2:
Conceptual framework. STT, Smart Tourism Technology.
III. Methodology
a. Measurement instrument
This study employed a quantitative approach using a survey questionnaire to measure each construct. All measurement items were taken from previous research. The development process began with an extensive literature review to identify validated measurement scales for each construct. This step was essential to ensure conceptual clarity and measurement consistency with existing studies, thereby facilitating both reliability and comparability across different tourism research contexts (Zheng, 2024). Following Churchill’s (1979) paradigm for questionnaire development, the instrument progressed through three sequential phases: item generation, scale refinement, and instrument finalization. In the item generation phase, measurement items were adapted from previously validated scales, including Zhang et al. (2021) and Nasir et al. (2020) for TS, Zhang et al. (2022) and Pai et al. (2020) for STT perceptions, and Jia and Lin (2016) and Chen et al. (2024) for destination loyalty. In order to refine the survey instrument and ensure the validity of the data, a preliminary pre-test was administered to a limited sample of respondents before the full-scale study was launched. This pilot phase allowed us to assess the clarity of questions, estimate the average completion time, and identify any ambiguities in the instructions or response options.
b. Study sites and data collection
For this research, the designated sampling area encompassed key tourist attractions within Luoyang City, China, including the Longmen Grottoes, White Horse Temple (Baima Temple), and Luoyang City Museum. These locations were selected based on their prominence in official tourism guides and their high visitor numbers (Luoyang Municipal Tourism Bureau, 2023). Data collection was conducted over a 5-month period, coinciding with the peak tourism season to maximize respondent diversity and participation. To mitigate seasonal bias inherent in cross-sectional data, data collection spanned both weekdays and weekends across the summer period, capturing a mix of visitor types. This study employed three complementary data collection methods: collaboration with travel agencies, on-site questionnaire distribution, and online surveys.
The multi-method approach was adopted to minimize coverage error and reach a broader spectrum of tourists (Wang et al., 2026). On-site distribution captured immediate post-experience feedback, while online surveys allowed for participation from those who might prefer digital channels, and travel agency collaboration helped reach package tourists.
All questionnaires, regardless of distribution method, were available in both Chinese and English to accommodate domestic and international tourists. The combined data collection effort across all three methods yielded a total of 550 valid questionnaires, exceeding the minimum sample size requirements established for this study. This multi-method approach enabled the research to capture a diverse and representative sample of tourists visiting Luoyang City, enhancing the validity and generalizability of the findings regarding factors influencing TS and destination loyalty.
c. Common method variance
The possibility of common method variance (CMV) was evaluated, given that all data originated from a single source. In line with recommendations for PLS-SEM, two methods were utilized. According to Kock (2015), a full collinearity assessment confirmed no significant bias, with all variance inflation factors (VIFs) deriving from a regression on a common variable being ≤3.3. Additionally, per the correlation matrix procedure, the fact that all construct correlations were under 0.9 provided further evidence against the presence of CMV. The VIFs for all constructs in this study were 1.222–2.234. The correlations among constructs in both groups were less than 0.9. CMV was therefore not a problem.
d. Sample profile
The sample profile of the 550 valid respondents are presented in Table 1. The gender distribution was relatively balanced, with females representing 51.8% and males 48.2% of the sample. The age distribution ranged from 18 to over 55 years old, with the largest segment between 26 and 35 years. This was followed by 18–25, 36–45, 46–55, and the smallest group being over 55. Marital status categories were also evenly distributed: 24.0% were single, 22.9% married, 23.8% widowed, 22.4% divorced, and 6.9% selected other or preferred not to answer.
Table 1:
Sample profile
| Characteristic | Category | N | Percentage (%) |
|---|---|---|---|
| Gender | Female | 285 | 51.8 |
| Male | 265 | 48.2 | |
| Total | 550 | 100.0 | |
| Age | 18–25 years | 126 | 22.9 |
| 26–35 years | 145 | 26.4 | |
| 36–45 years | 118 | 21.5 | |
| 46–55 years | 97 | 17.6 | |
| Over 55 years | 64 | 11.6 | |
| Total | 550 | 100.0 | |
| Marital status | Single | 132 | 24.0 |
| Married | 126 | 22.9 | |
| Widowed | 131 | 23.8 | |
| Divorced | 123 | 22.4 | |
| (Other/unknown) | 38 | 6.9 | |
| Total | 550 | 100.0 | |
| Education level | Diploma/A-level | 88 | 16.0 |
| High school graduate | 87 | 15.8 | |
| Master’s degree | 86 | 15.6 | |
| Bachelor’s degree | 82 | 14.9 | |
| Ph.D/Doctoral | 73 | 13.3 | |
| Some college, no degree | 69 | 12.6 | |
| Less than high school | 65 | 11.8 | |
| Total | 550 | 100.0 |
In terms of education, the sample included respondents across a broad range of qualifications, providing a diverse and representative educational profile. The largest group (16.0%) held a Diploma or A-level, followed closely by high school graduates (15.8%), Master’s degree holders (15.6%), Bachelor’s degree holders (14.9%), and Doctorate holders (13.3%). Additionally, 12.6% had attended some college without earning a degree, and 11.8% reported less than a high school education, reflecting a balanced spread of educational attainment across the sample.
e. Statistical analysis
This study employs Partial Least Squares Structural Equation Modeling (PLS-SEM) as the primary analytical approach, implemented through SmartPLS version 4.0 software (Ringle et al., 2022). SmartPLS is a widely used software application for variance-based SEM, and its reference is included to ensure methodological transparency (Ringle et al., 2022; Hair et al., 2019). PLS-SEM was selected for several compelling reasons. First, it is particularly well-suited for complex predictive models with multiple constructs and path relationships (Hair et al., 2019), aligning with this study’s conceptual framework that encompasses STT dimensions. Second, PLS-SEM offers advantages in handling both reflective and formative measurement models with greater flexibility than covariance-based approaches (Sarstedt et al., 2022). Third, its prediction-oriented nature aligns with this study’s objective of examining factors influencing TS and DL (Rigdon, 2016). Fourth, PLS-SEM demonstrates robustness with non-normal data distributions, which is common in tourism research where responses often exhibit skewness or kurtosis (Hair et al., 2017).
IV. Results and Findings
a. Evaluating the measurement model
To assess the measurement model, the reliability and convergent validity for the Luoyang dataset were examined against the standards of Hair et al. (2019, 2022), which provide comprehensive guidelines for PLS-SEM, recommending that factor loadings and average variance extracted (AVE) should be at least 0.5 to establish convergent validity, and composite reliability (CR) should be no less than 0.7 to confirm internal consistency reliability. As outlined in Table 2, all measured values for the Luoyang sample met these criteria, thus demonstrating adequate construct validity.
Table 2:
Measurement model
| Construct | CA | AVE | CR |
|---|---|---|---|
| STT - INF | 0.815 | 0.732 | 0.891 |
| STT - ACC | 0.829 | 0.662 | 0.886 |
| STT - INTER | 0.811 | 0.638 | 0.876 |
| STT - PERS | 0.820 | 0.650 | 0.881 |
| STT - SECUR | 0.734 | 0.653 | 0.849 |
| TS | 0.929 | 0.612 | 0.940 |
| DL | 0.894 | 0.612 | 0.917 |
For discriminant validity, the Heterotrait-Monotrait (HTMT) ratio was employed. This method, proposed by Henseler et al. (2015), is a more stringent and reliable criterion compared to the traditional Fornell–Larcker criterion for detecting discriminant validity issues in variance-based SEM. Discriminant validity was confirmed for the Luoyang City data by applying the HTMT ratio with a strict threshold of 0.85, as per Henseler et al. (2015). As shown in Table 3, all HTMT values were below this limit, demonstrating adequate discriminant validity. The HTMT values indicate that each construct is empirically distinct from the others, which is crucial for ensuring that the measured concepts are not overlapping. For instance, the highest correlation observed is between TS and DL at 0.796, which is below the 0.85 threshold, confirming that while closely related, they are conceptually different constructs.
b. Evaluating the structural model
As reflected in Table 4, all five STT dimensions had significant positive effects on destination loyalty. SECUR emerged as the strongest contributor (β = 0.115, p < 0.001), followed by ACC at β = 0.102. Other dimensions, such as Informativeness (β = 0.090), Personalization (β = 0.087), and Interactivity (β = 0.084), also contributed significantly to SECUR and ACC for reinforcing the multidimensional impact of technology on loyalty formation. TS demonstrated a strong positive effect on DL (β = 0.188, t = 3.549, p < 0.001) among all tested variables.
Table 4:
Summary of direct effects
| Hypothesis | Path | Path coefficient | t-value | p-value | Result |
|---|---|---|---|---|---|
| H1a | INF → DL | 0.090 | 2.682** | 0.007 | Supported |
| H1b | ACC → DL | 0.102 | 2.791** | 0.005 | Supported |
| H1c | INTER → DL | 0.084 | 2.426* | 0.015 | Supported |
| H1d | PERS → DL | 0.087 | 2.824** | 0.005 | Supported |
| H1e | SECUR → DL | 0.115 | 3.509*** | 0.000 | Supported |
| H2 | TS → DL | 0.188 | 3.549*** | 0.001 | Supported |
| H3a | INF → TS | 0.106 | 2.979** | 0.003 | Supported |
| H3b | ACC → TS | 0.139 | 3.746*** | 0.000 | Supported |
| H3c | INTER → TS | 0.121 | 3.447** | 0.001 | Supported |
| H3d | PERS → TS | 0.122 | 3.488*** | 0.000 | Supported |
| H3e | SECUR →TS | 0.096 | 2.616** | 0.009 | Supported |
The analysis of Perceived STT factors revealed significant positive effects across all dimensions. Among the STT factors, ACC showed the strongest effect (β = 0.139, p < 0.001), followed by Personalization (β = 0.122, p < 0.001) and Interactivity (β = 0.121, p < 0.001). These three factors demonstrated highly significant relationships with substantial effect sizes. Both Informativeness (β = 0.106, p < 0.01) and SECUR (β = 0.096, p < 0.01) also showed significant positive effects on TS, though with slightly smaller magnitudes. Therefore, both H1, H2, and H3 were supported, indicating that the STT factor has a positive influence on both DL and TS.
Table 5 also demonstrated consistent mediating effects of the Perceived STT through satisfaction. All STT factors demonstrated significant indirect effects through satisfaction: Informativeness showed a significant mediation effect (β = 0.020, t = 2.332, p < 0.05), while ACC demonstrated the strongest indirect effect (β = 0.026, t = 2.260, p < 0.05). Interactivity exhibited a significant mediation (β = 0.023, t = 2.542, p < 0.05), and Personalization showed consistent mediation (β = 0.023, t = 2.185, p < 0.05). SECUR demonstrated significant mediation (β = 0.018, t = 2.185, p < 0.05). These results support hypotheses H4, indicating that TS partially mediates the relationships between all STT factors and destination loyalty. The confidence intervals all exclude zero, confirming the significance of these indirect effects.
Table 5:
Summary of mediation effects through TS
| Hypothesis | Path | Direct effect | Indirect effect | Total effect | p-value | Mediation type |
|---|---|---|---|---|---|---|
| H4a | INF → TS → DL | 0.090** | 0.020* | 0.110 | 0.020 | Partial |
| H4b | ACC → TS → DL | 0.102** | 0.026* | 0.128 | 0.024 | Partial |
| H4c | INTER → TS → DL | 0.084* | 0.023* | 0.107 | 0.011 | Partial |
| H4d | PERS → TS → DL | 0.087** | 0.023* | 0.110 | 0.013 | Partial |
| H4e | SECUR → TS → DL | 0.115*** | 0.018* | 0.133 | 0.029 | Partial |
V. Discussion and Conclusion
a. Findings
Antecedents of DL constitute an emerging issue in tourism research, particularly in relation to the role of STT and underlying psychological mechanisms such as TS. A clearer understanding of how STT fosters loyalty can significantly advance both theoretical and practical knowledge of contemporary tourist–destination relationships. To address this research gap, this study develops and tests an integrated framework in which TS serves as a mediator between STT and destination loyalty. The present findings align with those of several earlier studies. For instance, a number of scholars have identified satisfaction as a key mediating variable in technology-driven tourism contexts, highlighting its role in shaping subsequent behavioral outcomes (Peng, 2025; Qian, 2025).
The results reveal a nuanced picture. Notably, “Security” exhibited the strongest direct effect on destination loyalty. This suggests that in the context of a heritage city like Luoyang, where tourists may be concerned about payment safety and data privacy when using digital guides or booking platforms, trust is a primary and direct driver of their commitment to return. A secure technological environment builds confidence, directly translating into loyalty without the need for an intervening satisfying experience (Wang et al., 2026).
Conversely, “Accessibility” was the strongest predictor of TS. This finding aligns with the TAM, which posits that perceived ease of use is a fundamental driver of user satisfaction. In a heritage setting, tourists highly value the convenience of easily accessible Wi-Fi, clear QR codes at historical sites, and user-friendly apps that simplify navigation and information retrieval. When technology is seamlessly integrated and easy to use, it significantly enhances the overall quality of the visitor experience, leading to greater satisfaction (Huai, 2026).
STT attributes, including SECUR, ACC, informativeness, interactivity, and personalization, also contribute positively to destination loyalty. This technological dimension receives support from Neuhofer et al. (2015), who emphasized that smart technologies enhance loyalty through improved trust, ACC, and visitor engagement.
In the context of STT factors, satisfaction partially mediated the effect of all five attributes on destination loyalty. This strengthens and reinforces the study of Gretzel et al. (2015), who claimed that TS plays a key role where behavioral intentions are influenced through smart technologies. In short, TS is the most important driver and mediator of destination loyalty.
b. Theoretical contributions
The contribution’s novelty lies in demonstrating destination loyalty’s multi-dimensional nature in cultural heritage destinations. Affective bonds with functional evaluations of digital services (from TAM) work together through TS to shape DL outcomes. This integration of theories provides a deeper understanding of contemporary DL formation. By unpacking STT into its constituent attributes, this study moves beyond treating technology as a monolithic entity and provides a granular analysis of how each specific feature uniquely contributes to loyalty, both directly and indirectly via satisfaction. This addresses a critical gap identified in the literature.
c. Practical implications
This study provides a series of empirically grounded practical contributions that are directly applicable to tourism policy-making, destination management, and smart tourism innovation, particularly within heritage-rich urban contexts such as Luoyang City. This research introduces an integrated model capturing the interplay between STT variables in shaping TS and destination loyalty. These contributions offer evidence-based directions for tourism stakeholders seeking to enhance experiential quality and foster sustainable loyalty.
For destination managers in Luoyang and similar heritage cities, the findings provide clear, targeted guidance. Given that SECUR has the strongest direct link to loyalty, managers must invest in robust, secure payment gateways for online bookings and clearly communicate data privacy policies to tourists, thereby promoting the destination as a safe digital space. As ACC is the primary driver of satisfaction, efforts should focus on providing free, high-speed Wi-Fi in all major tourist zones, developing multilingual user-friendly mobile applications with offline functionality, and ensuring that digital touchpoints such as QR codes at heritage sites are intuitive and reliable. To further enhance satisfaction, destinations should leverage personalization and interactivity by using data analytics to offer personalized recommendations for tours, restaurants, or events, while interactive features like augmented reality experiences at historical ruins or chatbots for instant query resolution can deepen visitor engagement. Ultimately, while all STT factors are important, resource allocation should be guided by these findings, prioritizing SECUR for immediate impact on loyalty and emphasizing ACC and personalization for enhancing immediate visitor satisfaction.
This study provides significant practical contributions regarding the application and impact of Perceived STT in enhancing tourist experiences and satisfaction. In this era of modern technology, the ease of accessing information is getting more influential as mobile phones have become a necessity in our daily lives. The work of Liang (2025) revealed the approach of digital platforms such as social media in promoting tourists’ perceptions as well as their choices in impacting the destination loyalty. Neuhofer et al. (2012) also showed that STT enhances the tourist experience, leading to increment in destination loyalty. Hence, in terms of the third practical contribution, this study serves as evidence in enhancing tourist access to technology in the context of Luoyang City.
In summary, this research underscores the transformative potential of STT in shaping modern tourism landscapes, providing practical guidance for leveraging technology to enhance TS, foster loyalty, and achieve sustainable destination development. By bridging the gap between technological possibilities and practical implementation, this study supports the creation of smarter, more responsive, and more competitive tourism offerings both in Luoyang City and beyond.
VI. Limitations and Future Research
This research has several limitations that open avenues for future inquiry. First, the cross-sectional design captures perceptions at a single point in time. Future studies could employ a longitudinal approach to track how STT perceptions and loyalty evolve over multiple visits. Second, the sample is confined to one cultural city (Luoyang City), which may limit the generalizability of the findings. While the conceptual model is robust, its application to other types of destinations (e.g., beach resorts, rural tourism spots) should be tested. Third, while PLS-SEM is suitable for prediction, future research could complement it with other mathematical models, such as Artificial Neural Networks, to capture complex, nonlinear relationships between STT attributes and loyalty. Fourth, the “performance factor” of specific STT applications (e.g., the loading speed of an app, the accuracy of a recommendation engine) was not measured. Future work could incorporate objective performance metrics alongside perceptual data. Finally, this model could be extended by incorporating moderating variables such as tourist age, tech-savviness, or travel party composition to provide an even more comprehensive understanding of technology-driven loyalty formation.