
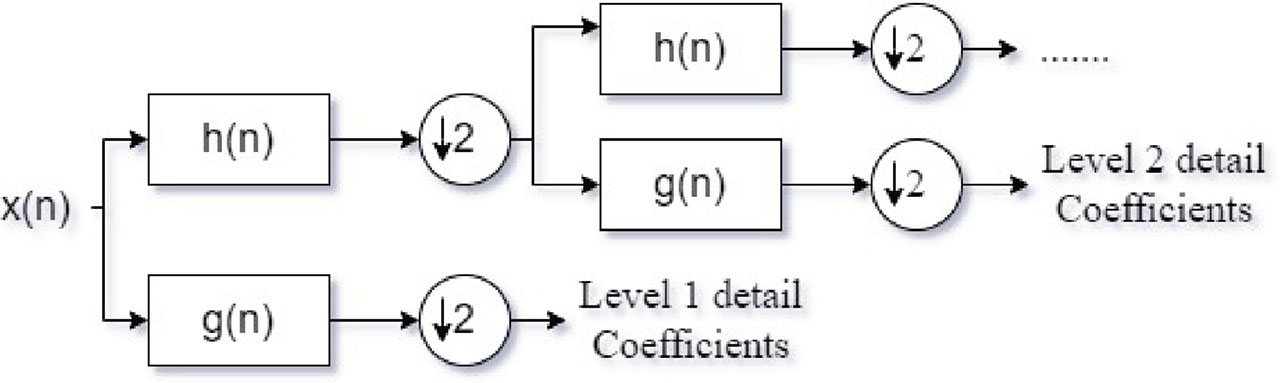
Figure 1:
Second level of coefficients.
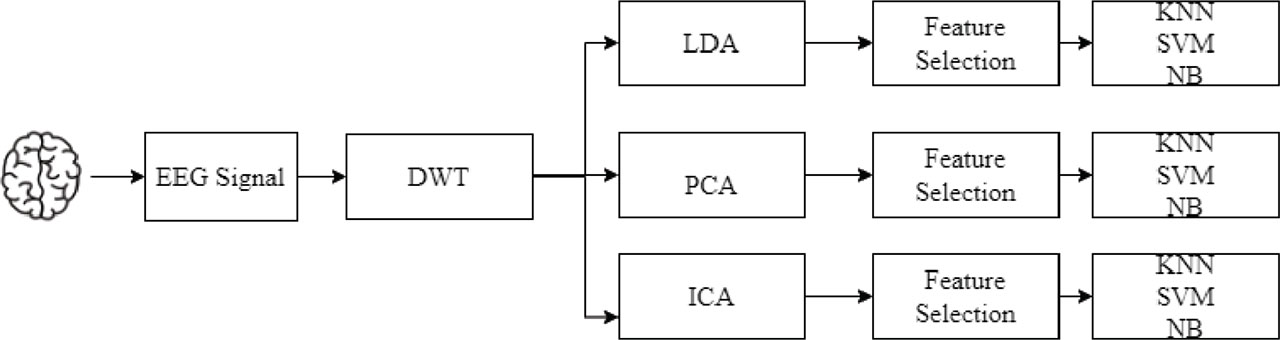
Figure 2:
Block diagram of the proposed method. DWT, discrete wavelet transform; ICA, independent component analysis; KNN, K-nearest neighbor; LDA, linear discriminant analysis; NB, Naive Bayes; PCA, principal component analysis; SVM, support vector machine.
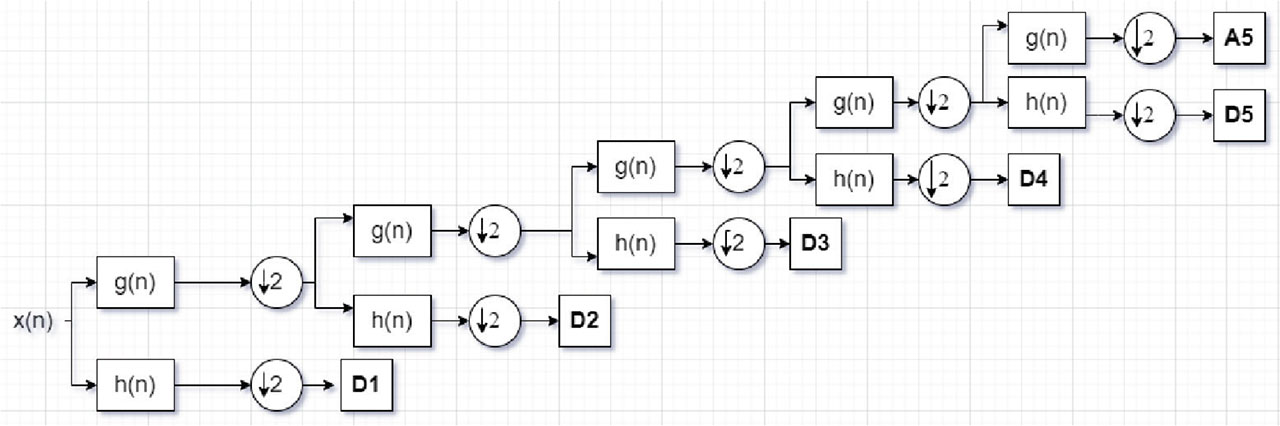
Figure 3:
Block diagram of fifth level decomposition of the EEG signal. EEG, electroencephalogram.
Table 1:
Samples of data in normal and seizure cases
| Set name | Annotation of data | Size (KB) | Acquisition circumstances |
|---|---|---|---|
| Set A | Z000.txt—Z100.txt | 564 | Five healthy subjects with open eyes |
| Set B | O000.txt—O100.txt | 611 | Five healthy subjects with closed eyes |
| Set C | N000.txt—N100.txt | 560 | Five people with epilepsy with seizure-free status |
| Set D | F000.txt—F100.txt | 569 | Five people with epilepsy with seizure-free status inside five epileptogenic zones |
| Set E | S000.txt—S100.txt | 747 | Five subjects during seizure activity |
Table 2:
Performance metrics for ICA with KNN
| Case | Accuracy (%) | Sensitivity (%) | Specificity (%) | Precision (%) | Recall (%) | F-measure |
|---|---|---|---|---|---|---|
| A–C | 88.50 | 93.99 | 81.14 | 85.24 | 93.99 | 0.89 |
| A–D | 83.50 | 82.65 | 83.87 | 83.99 | 82.65 | 0.82 |
| A–E | 93.00 | 100.00 | 86.01 | 88.36 | 100.00 | 0.94 |
| B–C | 91.50 | 93.33 | 89.83 | 90.47 | 93.33 | 0.92 |
| B–D | 91.50 | 93.31 | 90.37 | 90.12 | 93.31 | 0.91 |
| B–E | 92.00 | 100.00 | 84.07 | 86.32 | 100.00 | 0.92 |
Table 3:
Performance metrics for ICA with SVM
| Case | Accuracy (%) | Sensitivity (%) | Specificity (%) | Precision (%) | Recall (%) | F-measure |
|---|---|---|---|---|---|---|
| A–C | 88.00 | 92.68 | 83.67 | 86.33 | 92.68 | 0.89 |
| A–D | 85.50 | 96.03 | 75.96 | 79.14 | 96.03 | 0.86 |
| A–E | 97.50 | 100.00 | 94.96 | 95.55 | 100.00 | 0.98 |
| B–C | 86.50 | 83.63 | 89.65 | 91.07 | 83.63 | 0.87 |
| B–D | 90.50 | 89.63 | 92.59 | 91.72 | 89.63 | 0.90 |
| B–E | 94.50 | 100.00 | 88.78 | 90.69 | 100.00 | 0.95 |
Table 4:
Performance metrics for ICA with NB
| Case | Accuracy (%) | Sensitivity (%) | Specificity (%) | Precision (%) | Recall (%) | F-measure |
|---|---|---|---|---|---|---|
| A–C | 72.00 | 82.65 | 61.52 | 67.89 | 82.65 | 0.74 |
| A–D | 72.50 | 97.03 | 47.76 | 65.55 | 97.03 | 0.78 |
| A–E | 100.00 | 100.00 | 100.00 | 100.00 | 100.00 | 1.00 |
| B–C | 82.00 | 67.22 | 95.48 | 95.60 | 67.22 | 0.78 |
| B–D | 68.00 | 91.43 | 45.27 | 62.48 | 91.42 | 0.74 |
| B–E | 99.50 | 99.23 | 100.00 | 100.00 | 99.23 | 0.99 |
Table 5:
Results of PCA with KNN algorithm
| Case | Accuracy (%) | Sensitivity (%) | Specificity (%) | Precision (%) | Recall (%) | F-measure |
|---|---|---|---|---|---|---|
| A–C | 81.00 | 88.47 | 71.87 | 78.36 | 88.47 | 0.83 |
| A–D | 90.50 | 93.20 | 89.28 | 89.34 | 93.20 | 0.91 |
| A–E | 58.00 | 100.00 | 18.18 | 57.18 | 100.00 | 0.71 |
| B–C | 81.00 | 82.32 | 77.93 | 79.39 | 82.32 | 0.81 |
| B–D | 83.50 | 83.09 | 81.94 | 83.12 | 83.09 | 0.89 |
| B–E | 88.50 | 100.00 | 75.07 | 86.68 | 100.00 | 0.92 |
Table 6:
Results of PCA with SVM algorithm
| Case | Accuracy (%) | Sensitivity (%) | Specificity (%) | Precision (%) | Recall (%) | F-measure |
|---|---|---|---|---|---|---|
| A–C | 77.50 | 96.87 | 55.57 | 71.09 | 96.87 | 0.81 |
| A–D | 84.50 | 97.07 | 71.43 | 77.77 | 97.07 | 0.86 |
| A–E | 93.50 | 100.00 | 86.87 | 89.34 | 100.00 | 0.94 |
| B–C | 83.00 | 93.65 | 71.89 | 77.89 | 93.65 | 0.85 |
| B–D | 85.00 | 93.85 | 74.36 | 80.27 | 93.85 | 0.86 |
| B–E | 90.00 | 100.00 | 80.09 | 83.98 | 100.00 | 0.91 |
Table 7:
Results of PCA with NB algorithm
| Case | Accuracy (%) | Sensitivity (%) | Specificity (%) | Precision (%) | Recall (%) | F-measure |
|---|---|---|---|---|---|---|
| A–C | 80.50 | 94.45 | 67.12 | 74.17 | 94.45 | 0.83 |
| A–D | 80.00 | 96.26 | 63.67 | 72.64 | 96.26 | 0.82 |
| A–E | 100.00 | 100.00 | 100.00 | 100.00 | 100.00 | 1.00 |
| B–C | 90.50 | 84.28 | 95.71 | 97.50 | 84.28 | 0.90 |
| B–D | 89.00 | 90.31 | 88.38 | 87.95 | 90.31 | 0.89 |
| B–E | 99.50 | 99.00 | 100.00 | 100.00 | 99.00 | 0.99 |
Table 8:
Results of proposed model LDA with KNN algorithm
| Case | Accuracy (%) | Sensitivity (%) | Specificity (%) | Precision (%) | Recall (%) | F-measure |
|---|---|---|---|---|---|---|
| A–C | 77.50 | 82.95 | 70.30 | 76.89 | 82.95 | 0.78 |
| A–D | 66.50 | 64.45 | 67.84 | 69.40 | 64.45 | 0.66 |
| A–E | 92.00 | 100.00 | 84.65 | 86.49 | 100.00 | 0.92 |
| B–C | 76.50 | 64.08 | 87.32 | 82.89 | 64.08 | 0.72 |
| B–D | 80.00 | 73.44 | 82.98 | 85.54 | 73.44 | 0.77 |
| B–E | 90.00 | 100.00 | 79.61 | 84.92 | 100.00 | 0.91 |
Table 9:
Results of proposed model LDA with SVM algorithm
| Case | Accuracy (%) | Sensitivity (%) | Specificity (%) | Precision (%) | Recall (%) | F-measure |
|---|---|---|---|---|---|---|
| A–C | 100.00 | 100.00 | 100.00 | 100.00 | 100.00 | 1.00 |
| A–D | 72.00 | 72.48 | 73.36 | 72.75 | 72.48 | 0.71 |
| A–E | 96.00 | 99.09 | 90.63 | 95.56 | 99.09 | 0.97 |
| B–C | 91.00 | 86.70 | 94.02 | 93.57 | 86.70 | 0.90 |
| B–D | 100.00 | 100.00 | 100.00 | 100.00 | 100.00 | 1.00 |
| B–E | 76.00 | 88.38 | 63.88 | 74.31 | 88.38 | 0.80 |
Table 10:
Results of proposed model LDA with NB algorithm
| Case | Accuracy (%) | Sensitivity (%) | Specificity (%) | Precision (%) | Recall (%) | F-measure |
|---|---|---|---|---|---|---|
| A–C | 100.00 | 100.00 | 100.00 | 100.00 | 100.00 | 1.00 |
| A–D | 100.00 | 100.00 | 100.00 | 100.00 | 100.00 | 1.00 |
| A–E | 100.00 | 100.00 | 100.00 | 100.00 | 100.00 | 1.00 |
| B–C | 100.00 | 100.00 | 100.00 | 100.00 | 100.00 | 1.00 |
| B–D | 100.00 | 100.00 | 100.00 | 100.00 | 100.00 | 1.00 |
| B–E | 100.00 | 100.00 | 100.00 | 100.00 | 100.00 | 1.00 |
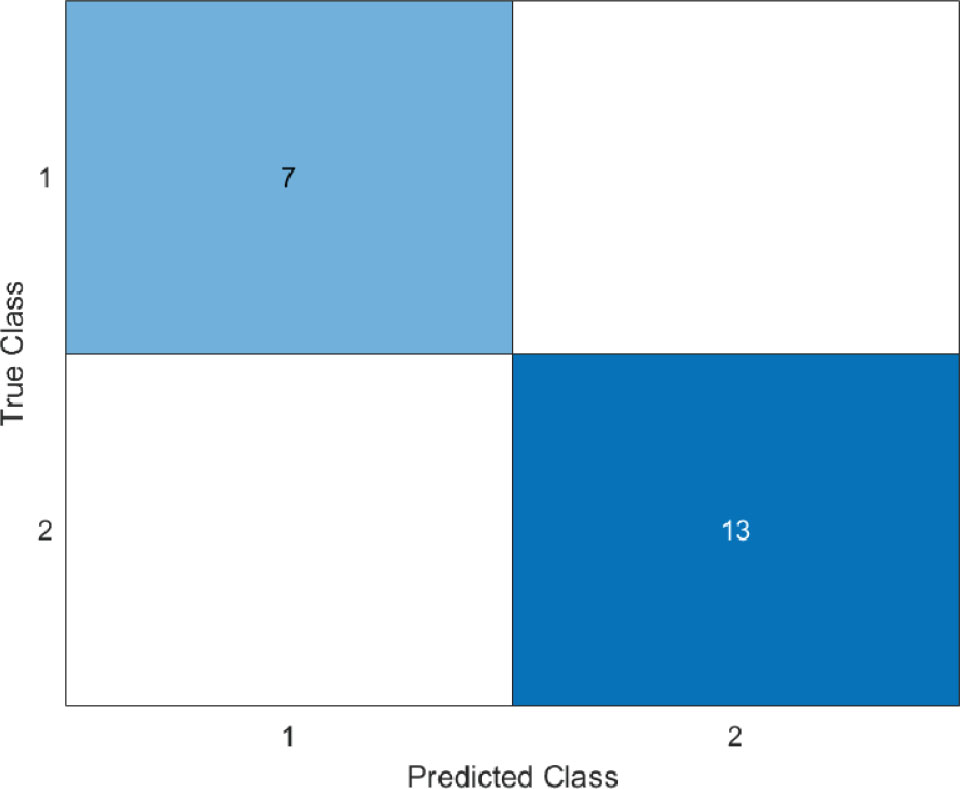
Figure 4:
Confusion matrix for PCA with KNN algorithm. KNN, K-nearest neighbors; PCA, principal component analysis.
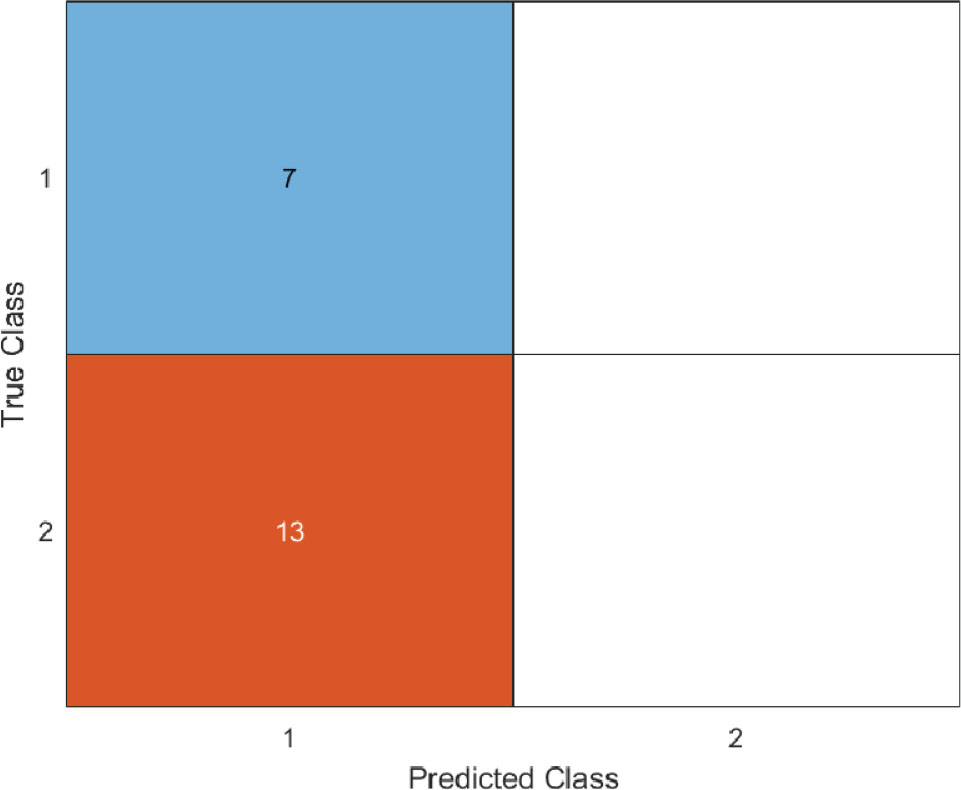
Figure 5:
Confusion matrix for PCA with SVM algorithm. PCA, principal component analysis; SVM, support vector machine.
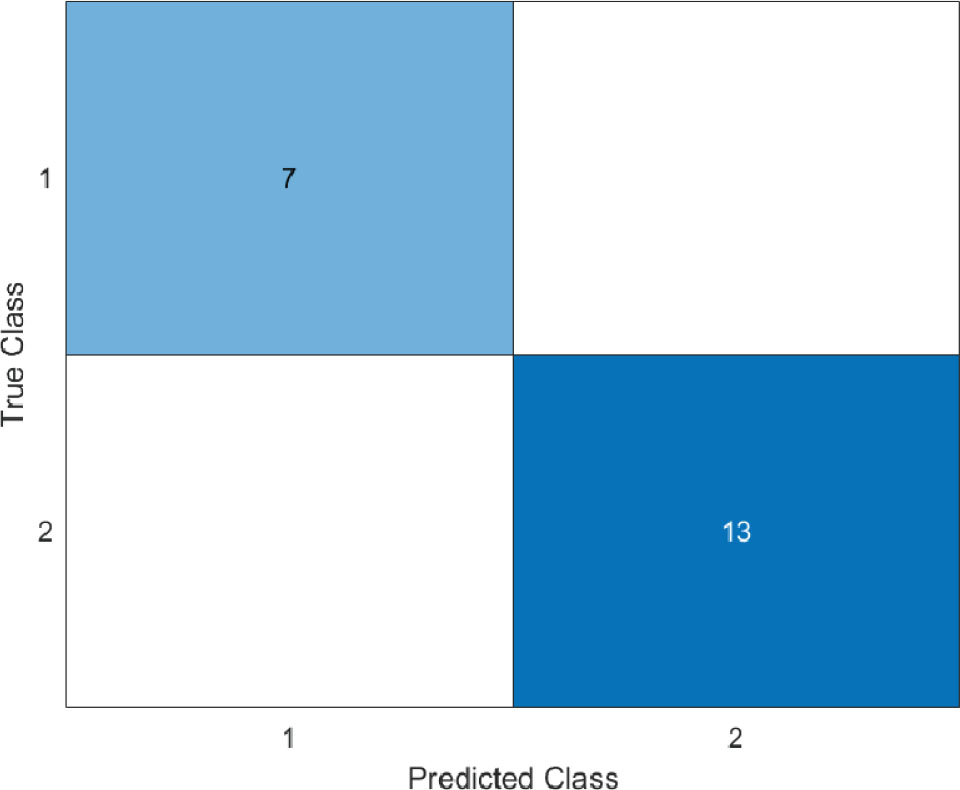
Figure 6:
Confusion matrix for PCA with NB algorithm. NB, Naive Bayes; PCA, principal component analysis.
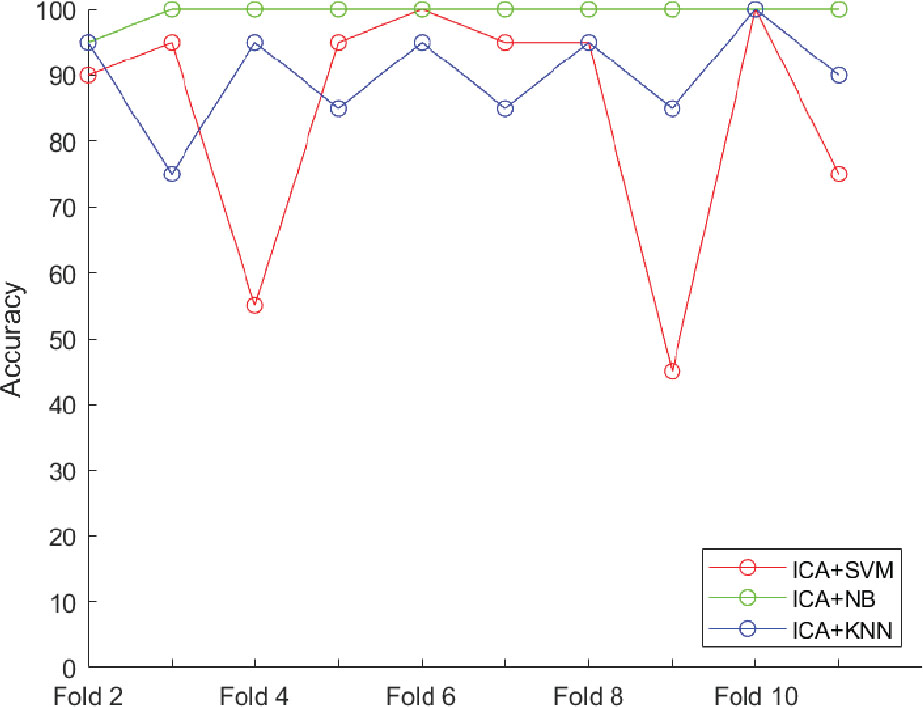
Figure 7:
Fold-wise accuracy using ICA and SVM, NB, KNN. ICA, independent component analysis; KNN, K-nearest neighbors; NB, Naive Bayes; SVM, support vector machine.
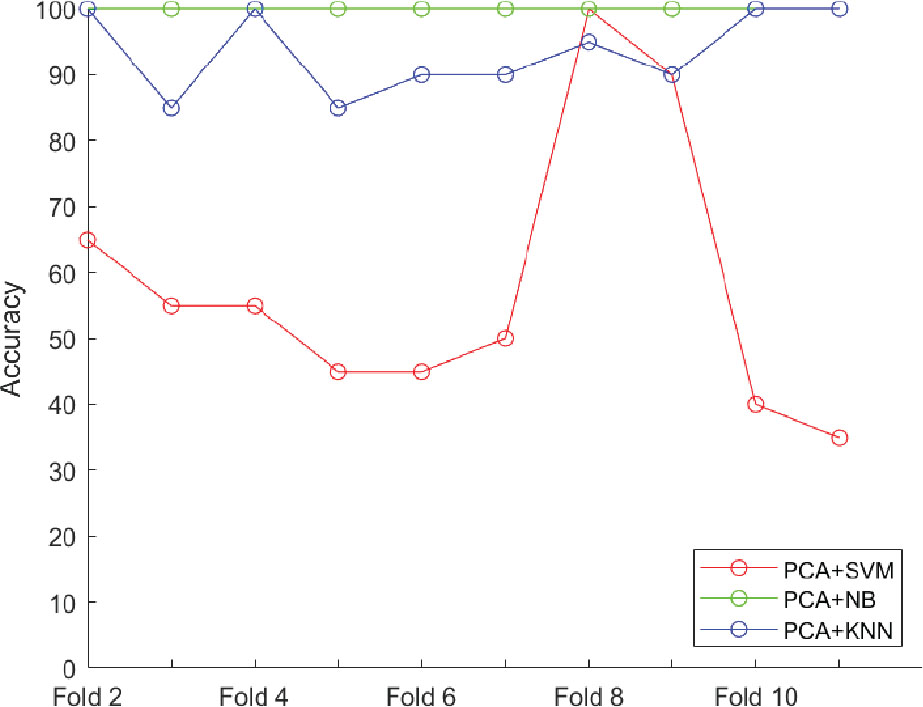
Figure 8:
Fold-wise accuracy using PCA and SVM, NB, KNN. KNN, K-nearest neighbors; NB, Naive Bayes; PCA, principal component analysis; SVM, support vector machine.
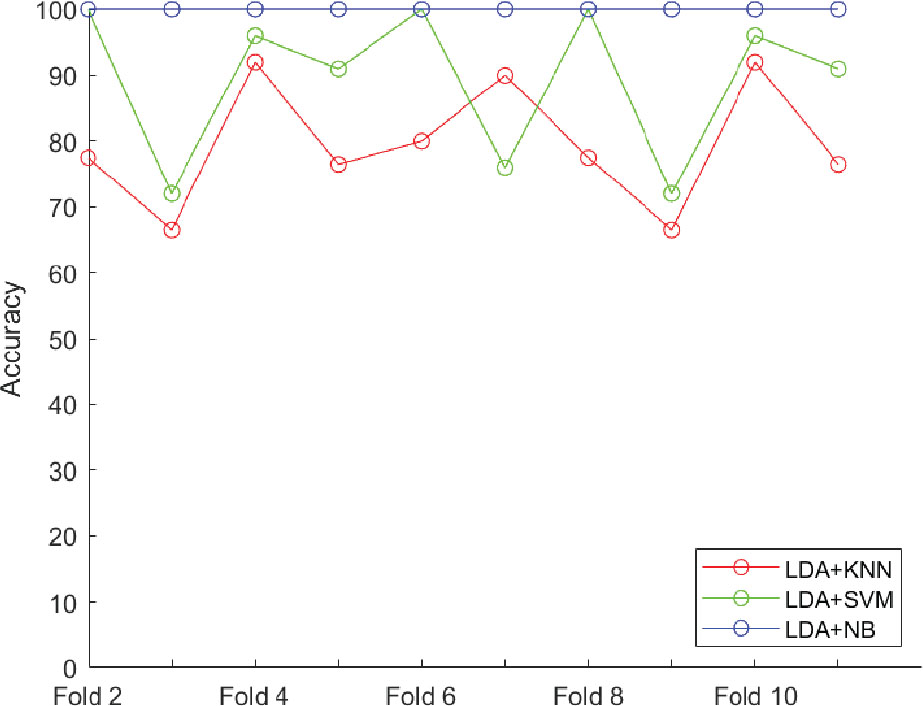
Figure 9:
Fold-wise accuracy using LDA and SVM, NB, KNN. KNN, K-nearest neighbors; LDA, linear discriminant analysis; NB, Naive Bayes; SVM, support vector machine.
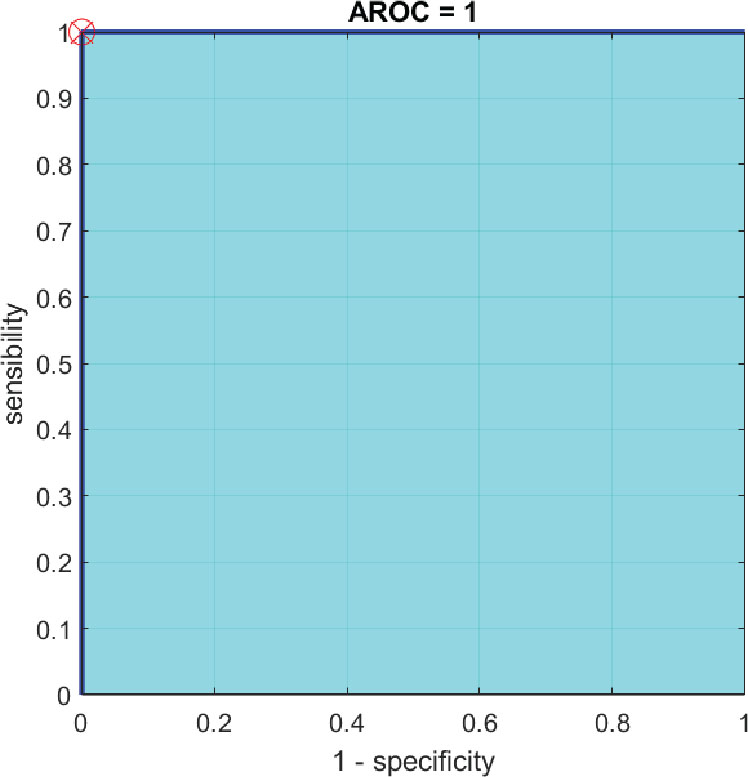
Figure 10:
ROC plot for PCA, ICA, LDA and SVM, NB, KNN. ICA, independent component analysis; KNN, K-nearest neighbors; LDA, linear discriminant analysis; NB, Naive Bayes; PCA, principal component analysis; SVM, support vector machine.