
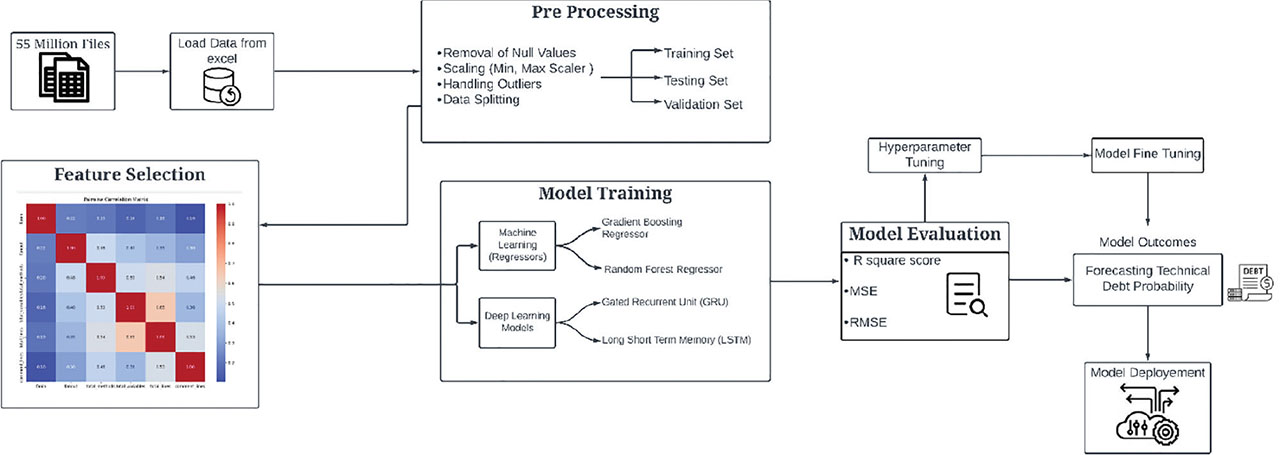
Figure 1:
TD prediction workflow. TD, technical debt.
Table 1:
Comparison of validation metrics
| Model | MSE | RMSE |
|---|---|---|
| LSTM | 0.003357 | 0.057947 |
| GRU | 0.005403 | 0.073505 |
| RF regressor | 0.006093 | 0.078061 |
| GB regressor | 0.007900 | 0.08888 |
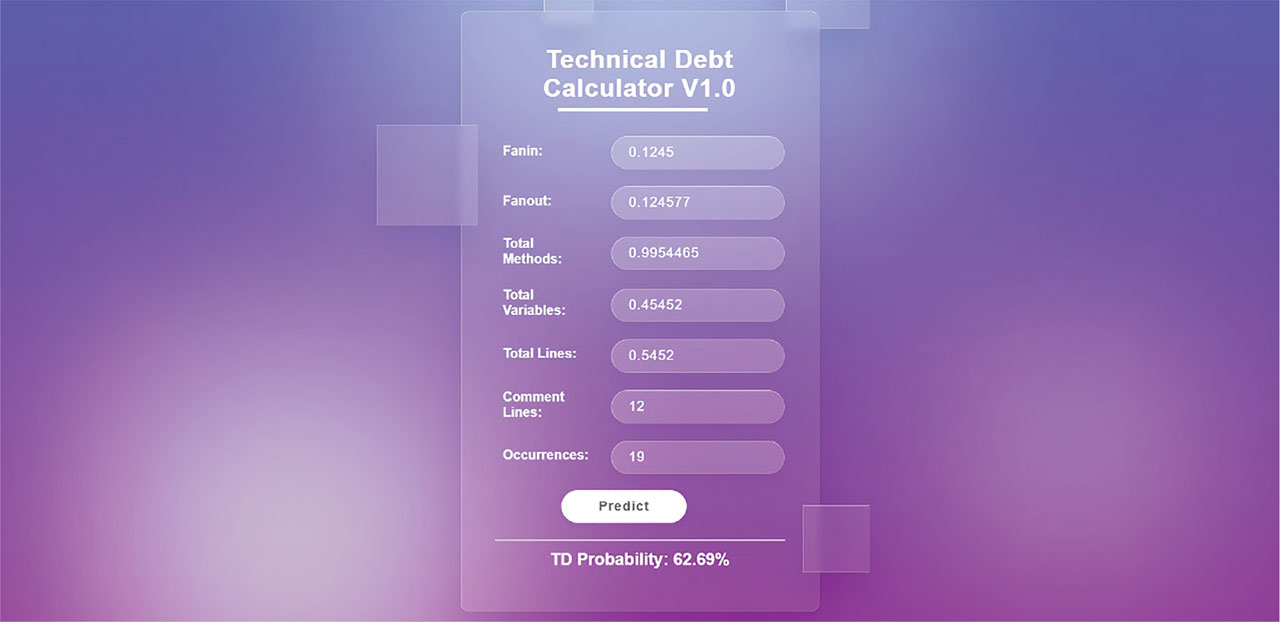
Figure 2:
Frontend interface of the project. TD, technical debt.