
Table 1
Sputtering parameters used for deposition of SnO2 thin film.
| Technique | RF diode sputtering |
| Target | Tin (99.99%) |
| Gas | 50% Ar + 50% O2 |
| Sputtering pressure | 14 mTorr |
| Power | 150 W |
| Substrate-to-target distance | 7.5 cm |
| Substrate temperature | 25°C (no heating) |
| Rate of deposition: | 60 nm/h |
[i] The surface morphology of SnO2 thin films of varying thicknesses was studied over an area of 2 × 2 μm2 in the noncontact mode using an atomic force microscope (MultiModeTM SPM; Manufacturer: Digital Instrument, Veeco Metrology Group, NY, USA).
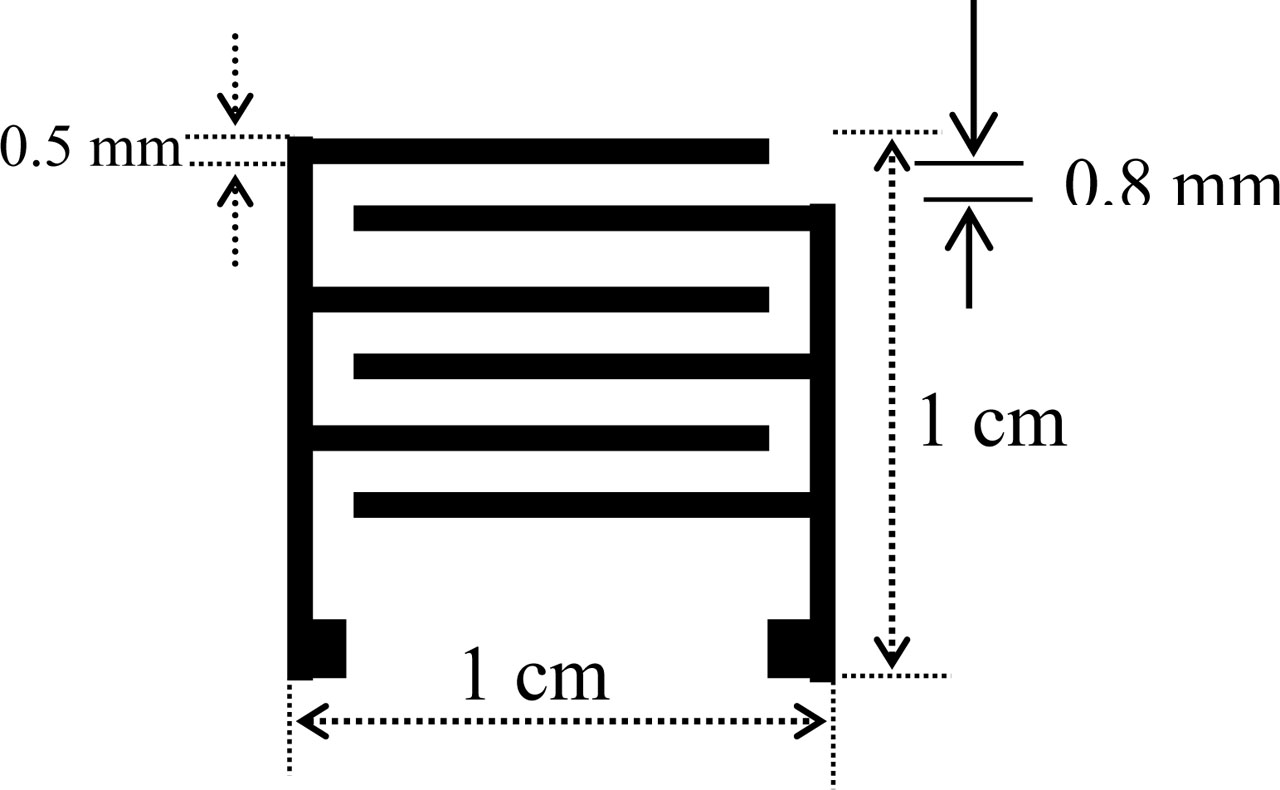
Figure 1
Structure of the SnO2 thin film sensor.
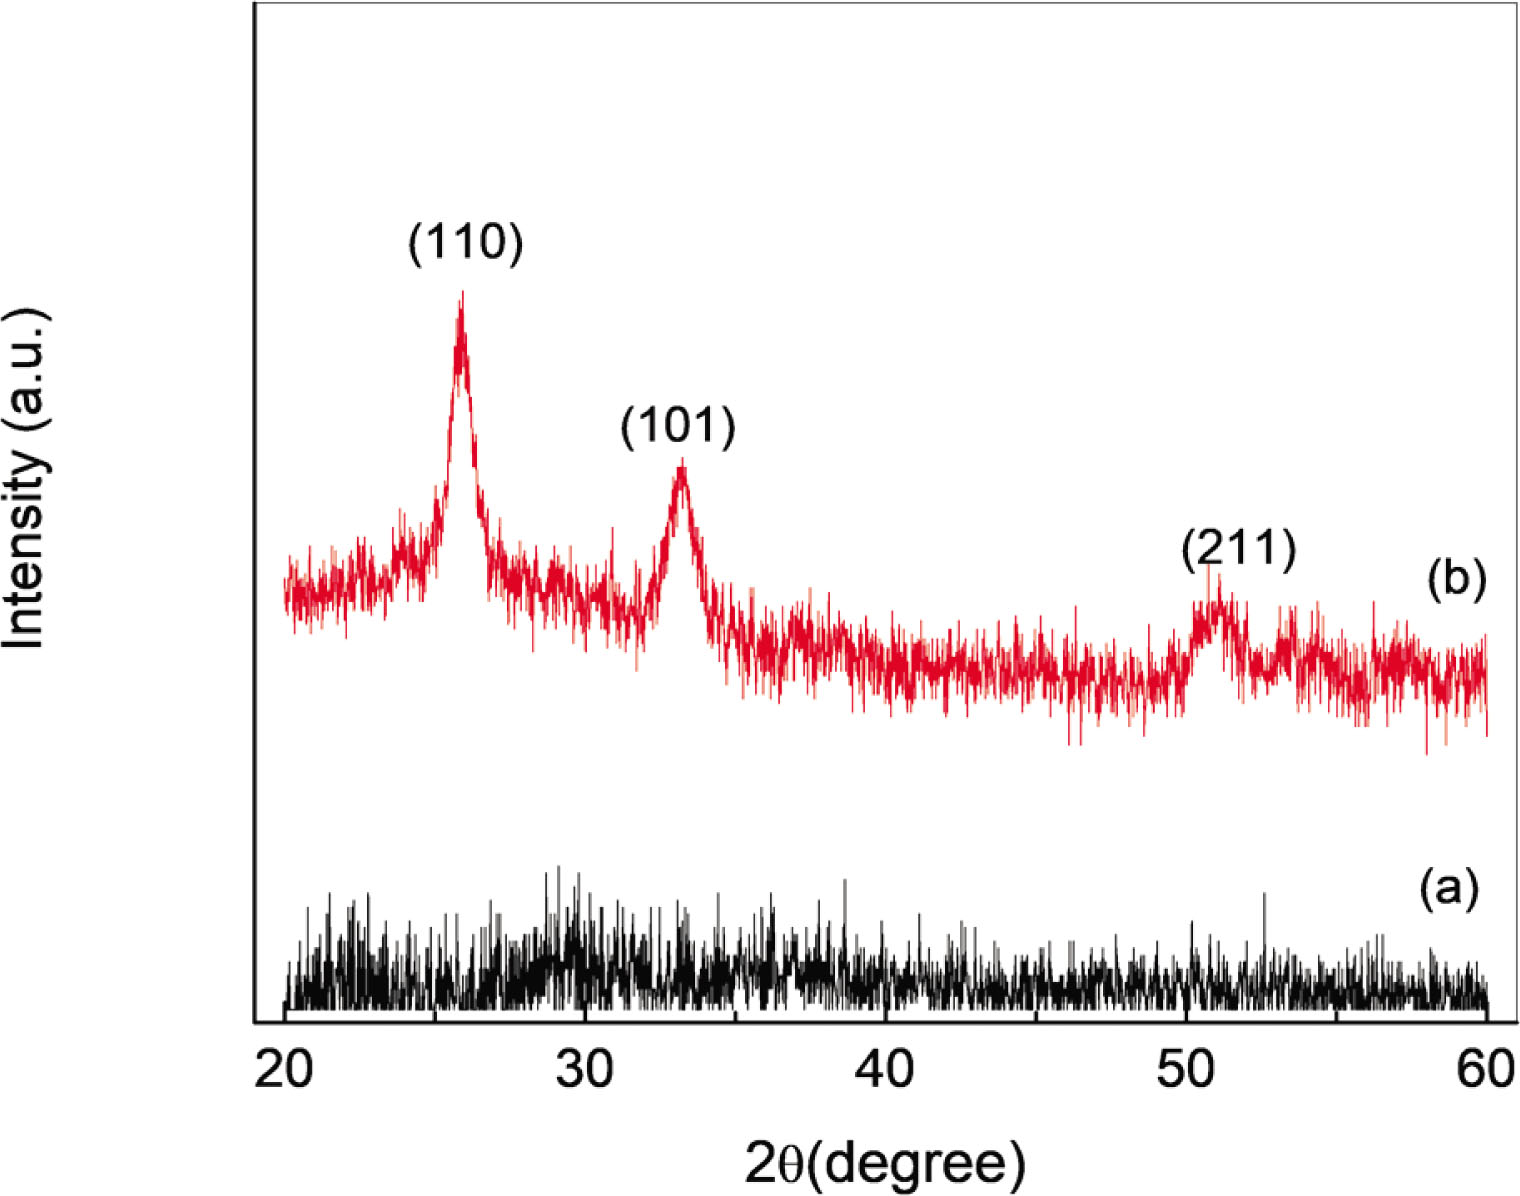
Figure 2
XRD of the as-grown SnO2 thin film (graph a) and the SnO2 thin film annealed in air at 300°C for 2 h (graph b). XRD, X-ray diffraction.
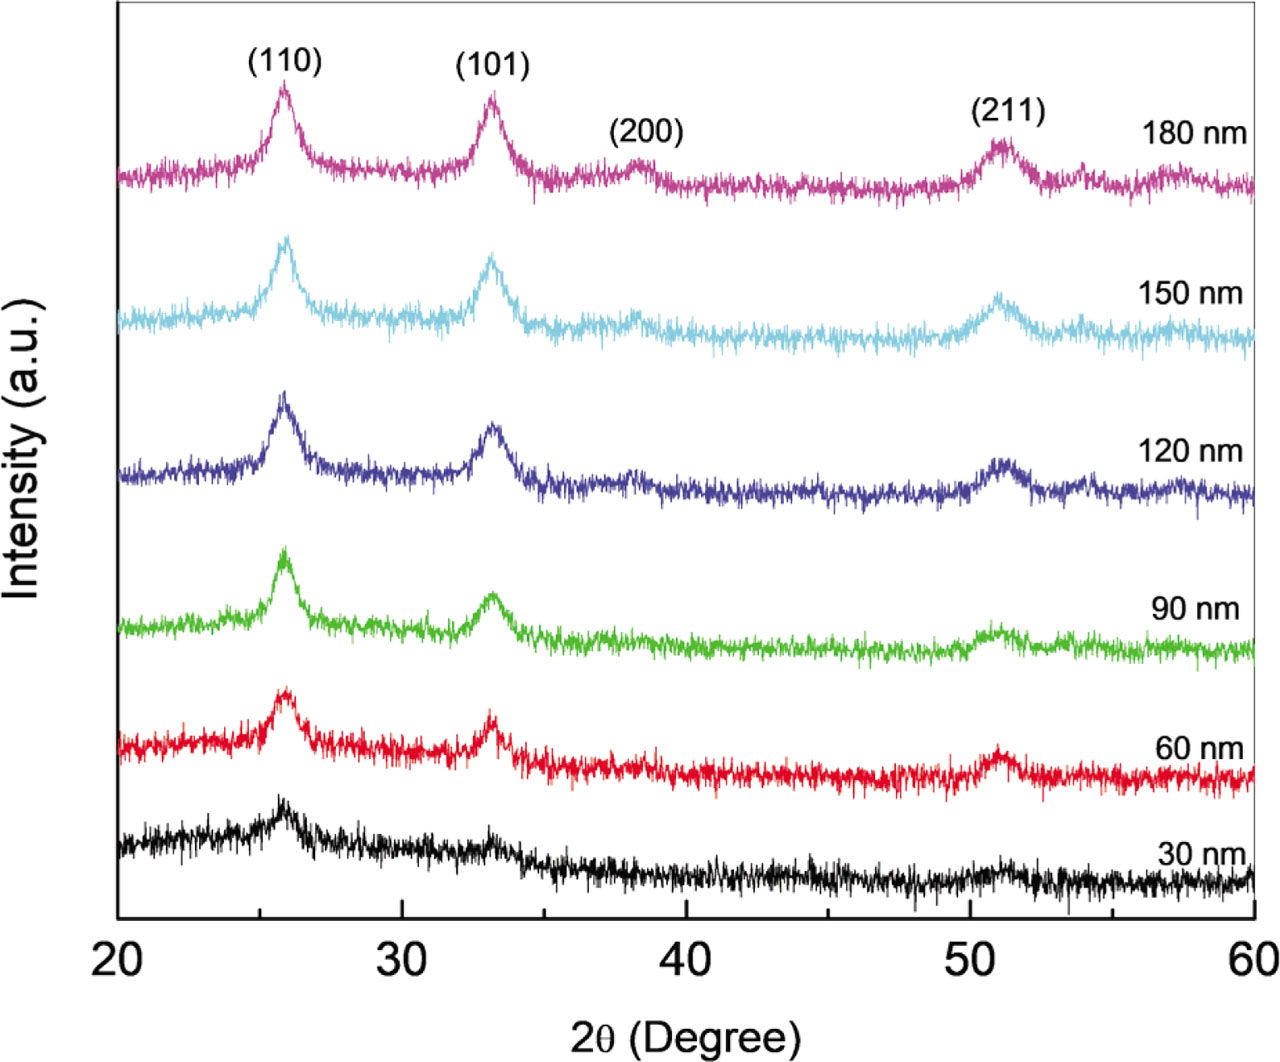
Figure 3
XRD pattern of the annealed SnO2 thin film of varying thicknesses. XRD, X-ray diffraction.
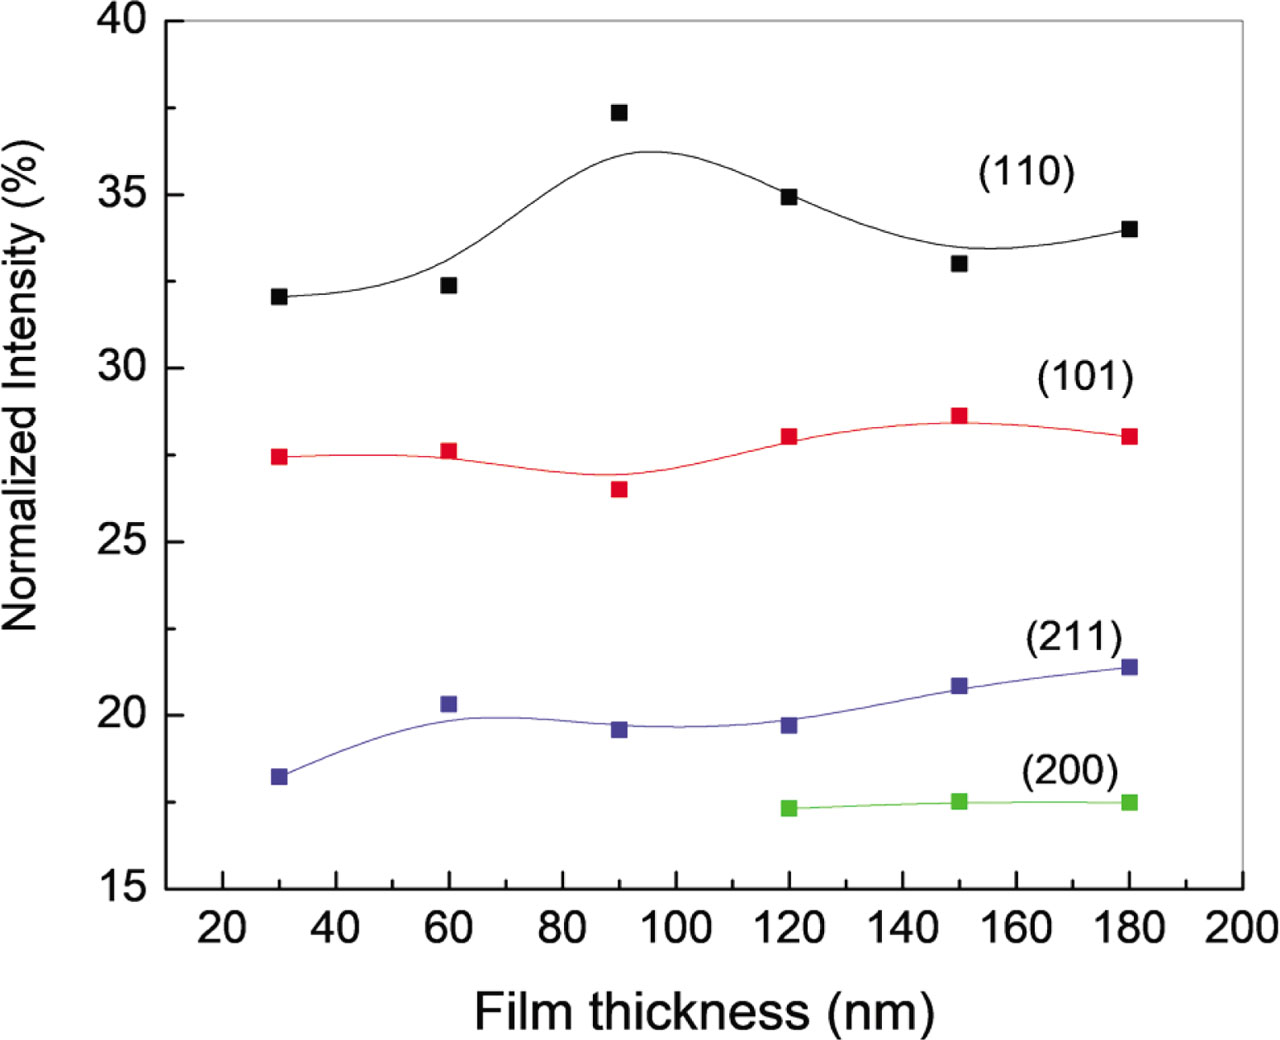
Figure 4
Influence of the thickness of the SnO2 thin film on the normalized intensities of various XRD peaks. XRD, X-ray diffraction.
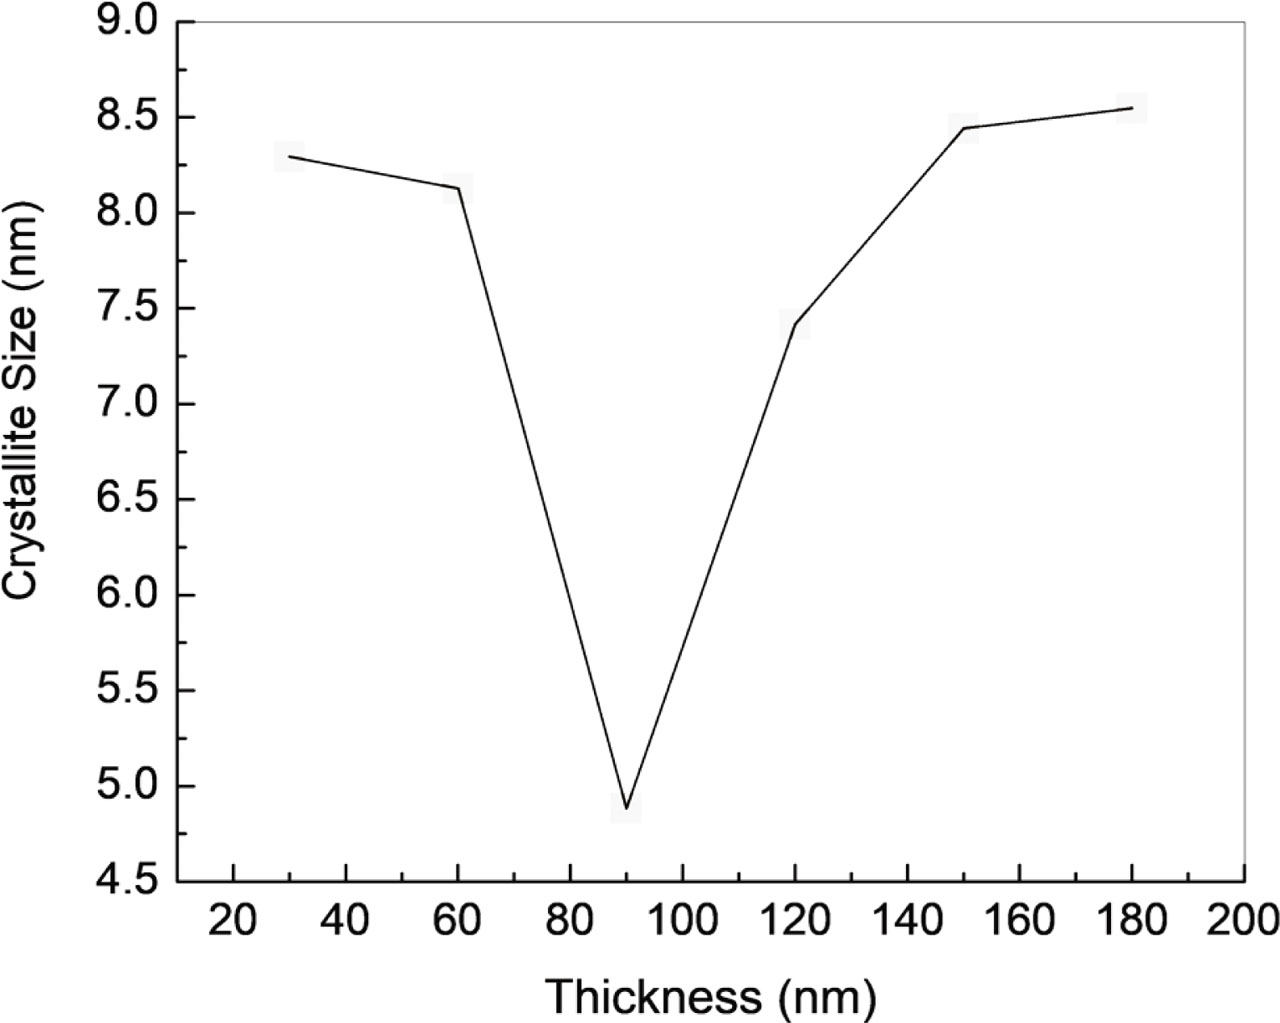
Figure 5
Variation of crystallite size of annealed SnO2 thin film as a function of film thickness.
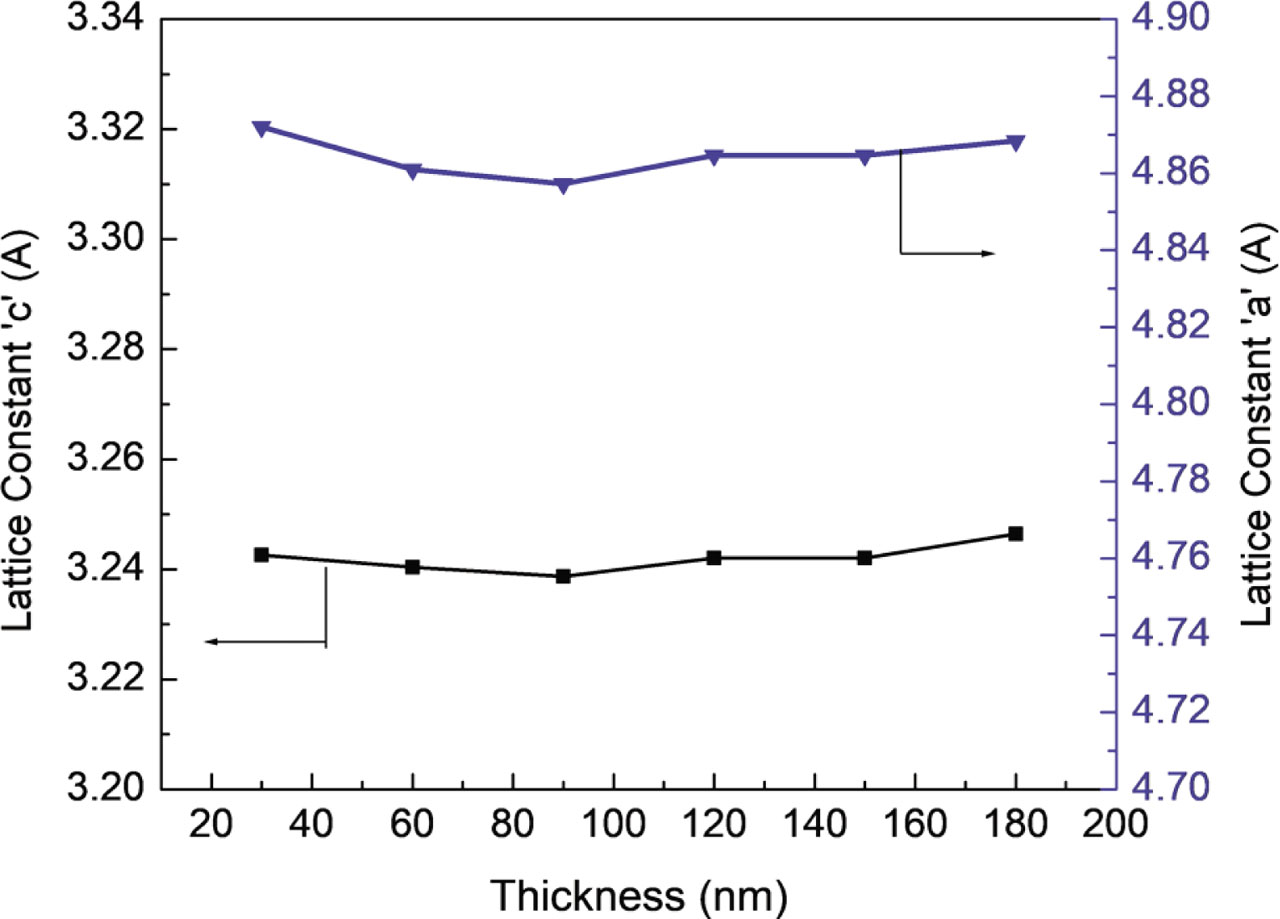
Figure 6
Variation of lattice constants “c” and “a” with the thickness of SnO2 thin films.
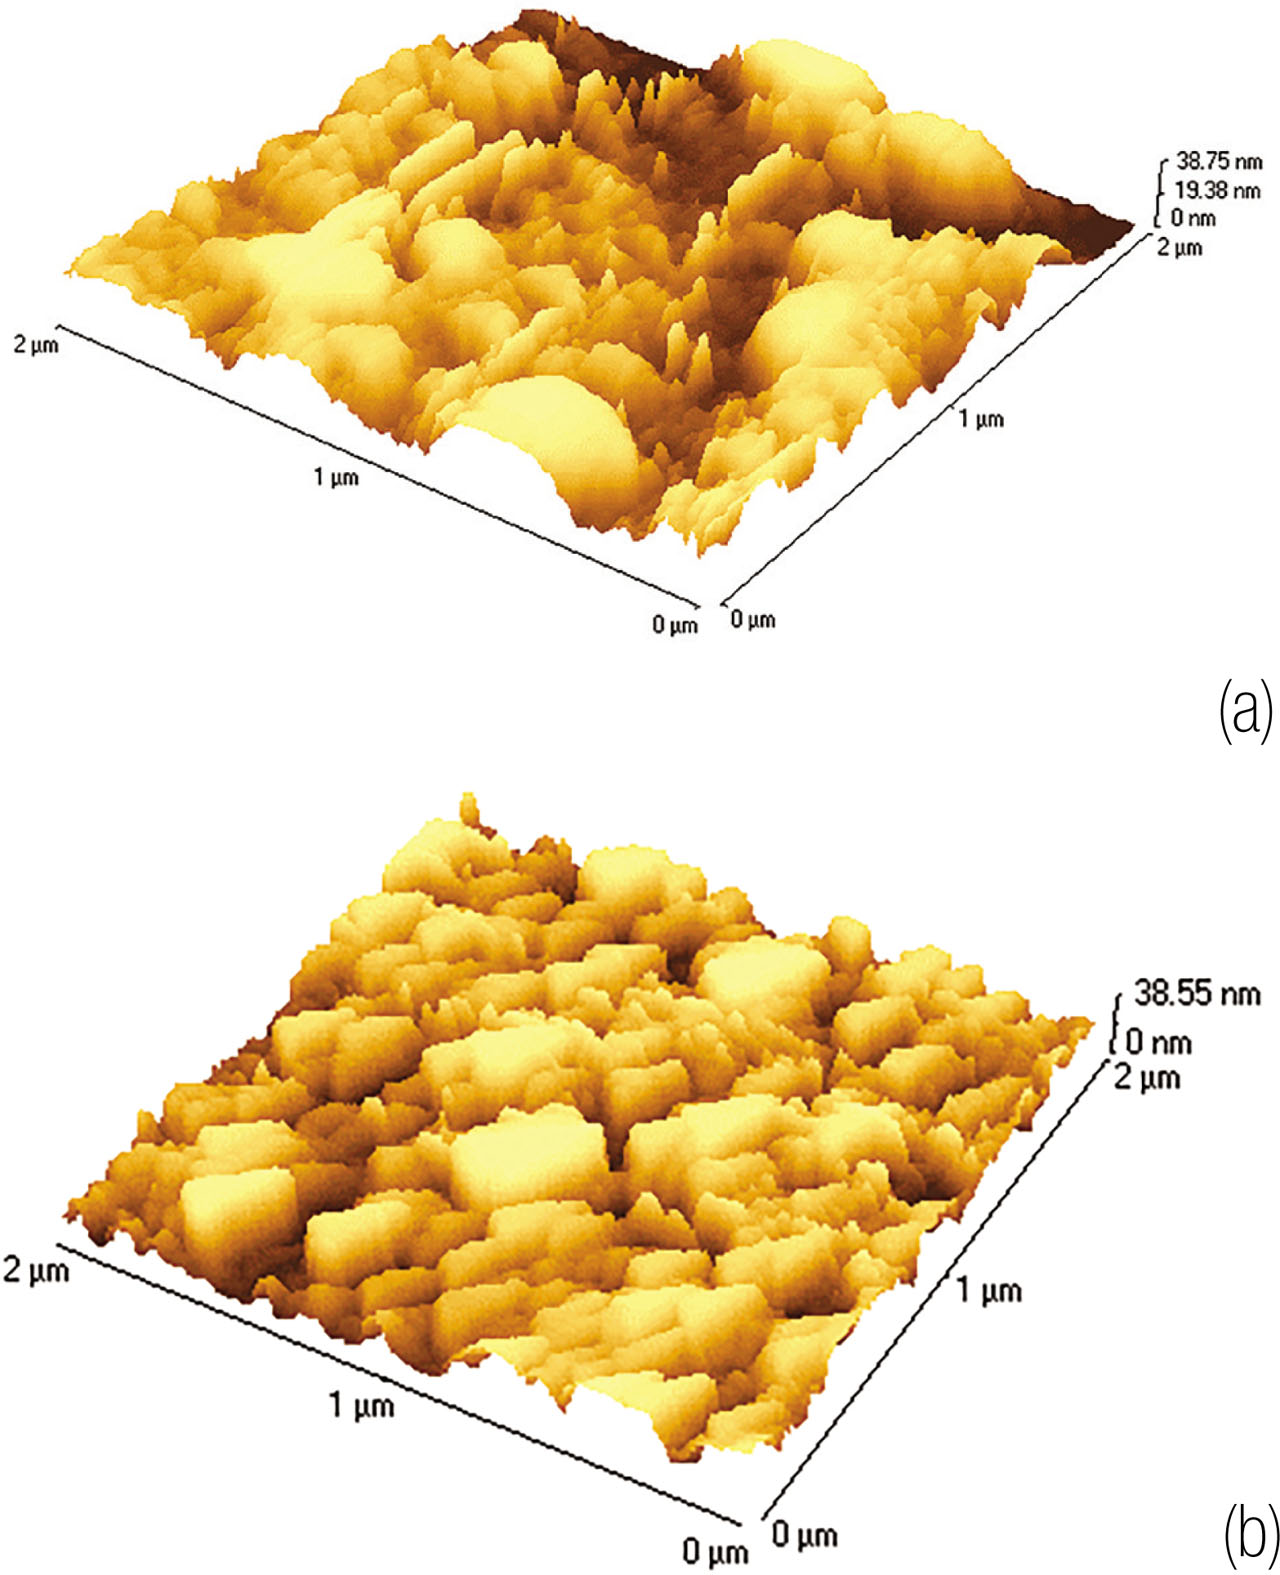
Figure 7
AFM images of 90 nm SnO2 thin films: (A) as-deposited film; and (B) postdeposition annealing in air at 300°C. AFM, atomic force microscopy.
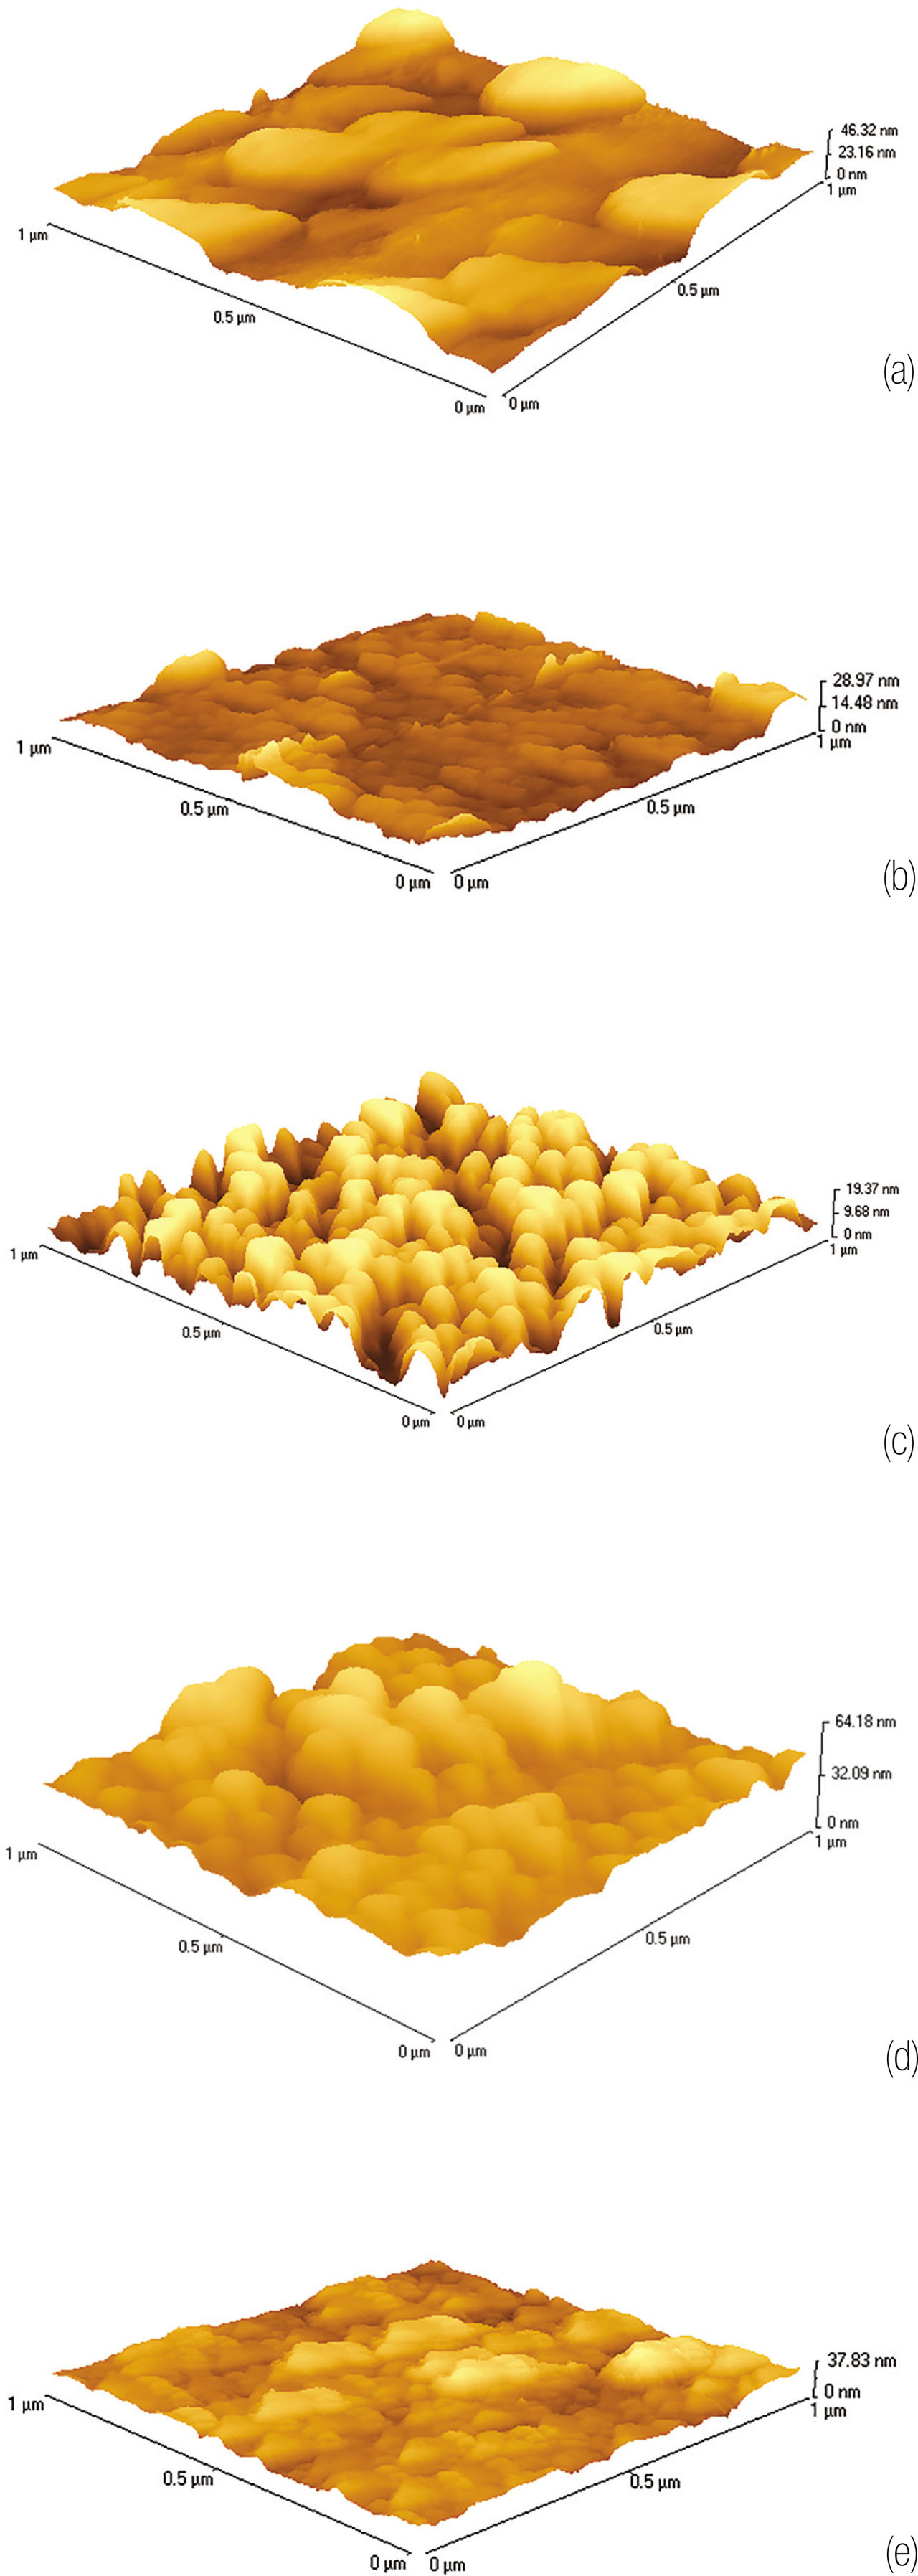
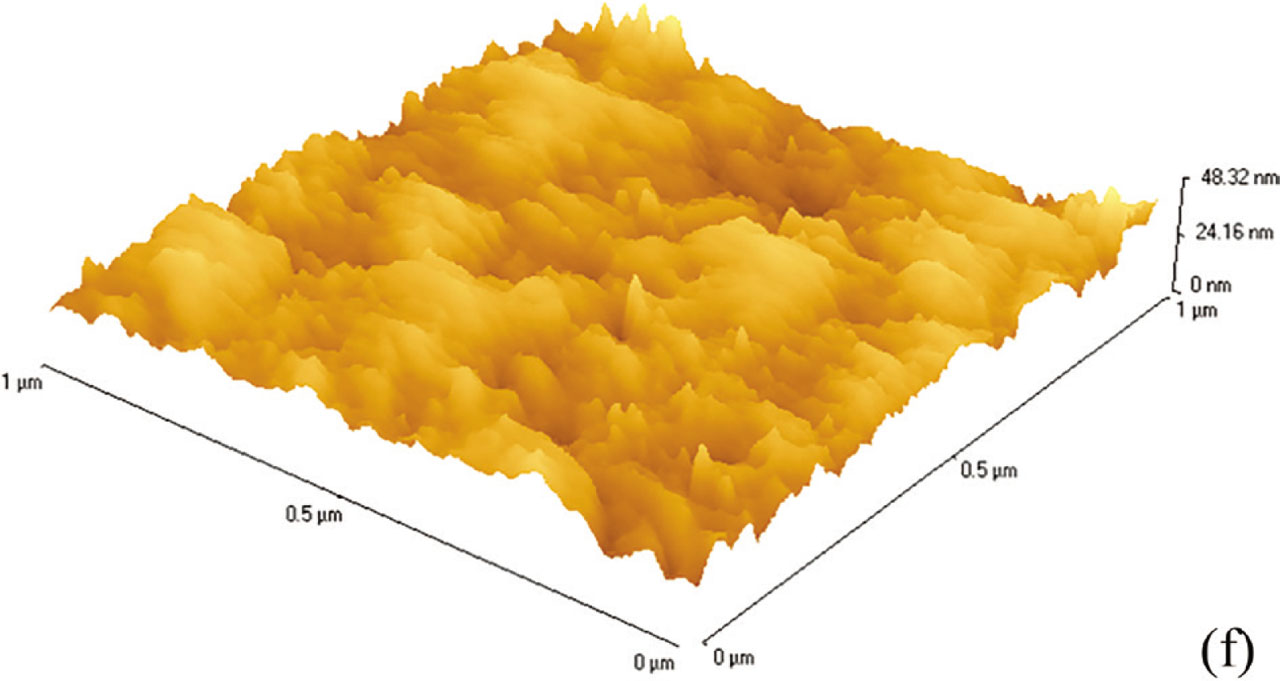
Figure 8
AFM images of SnO2 films of varying thicknesses: (A) 30 nm; (B) 60 nm; (C) 90 nm; (D) 120 nm; (E) 150 nm; and (F) 180 nm. AFM, atomic force microscopy.
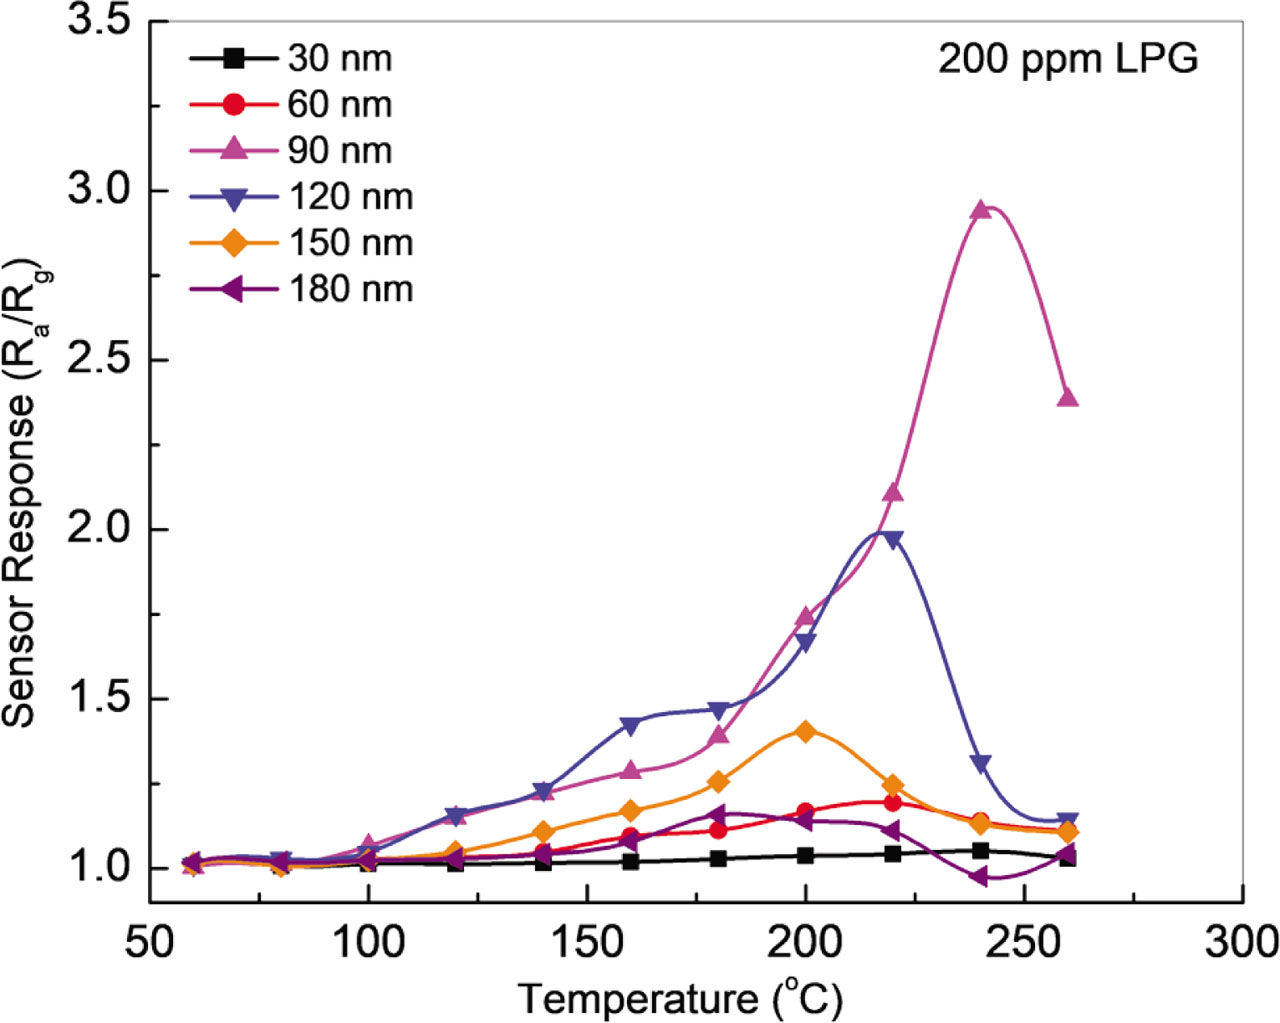
Figure 9
Response of SnO2 thin film sensors of varying thicknesses (30–180 nm) to 200 ppm of LPG as a function of temperature. LPG, liquefied petroleum gas.
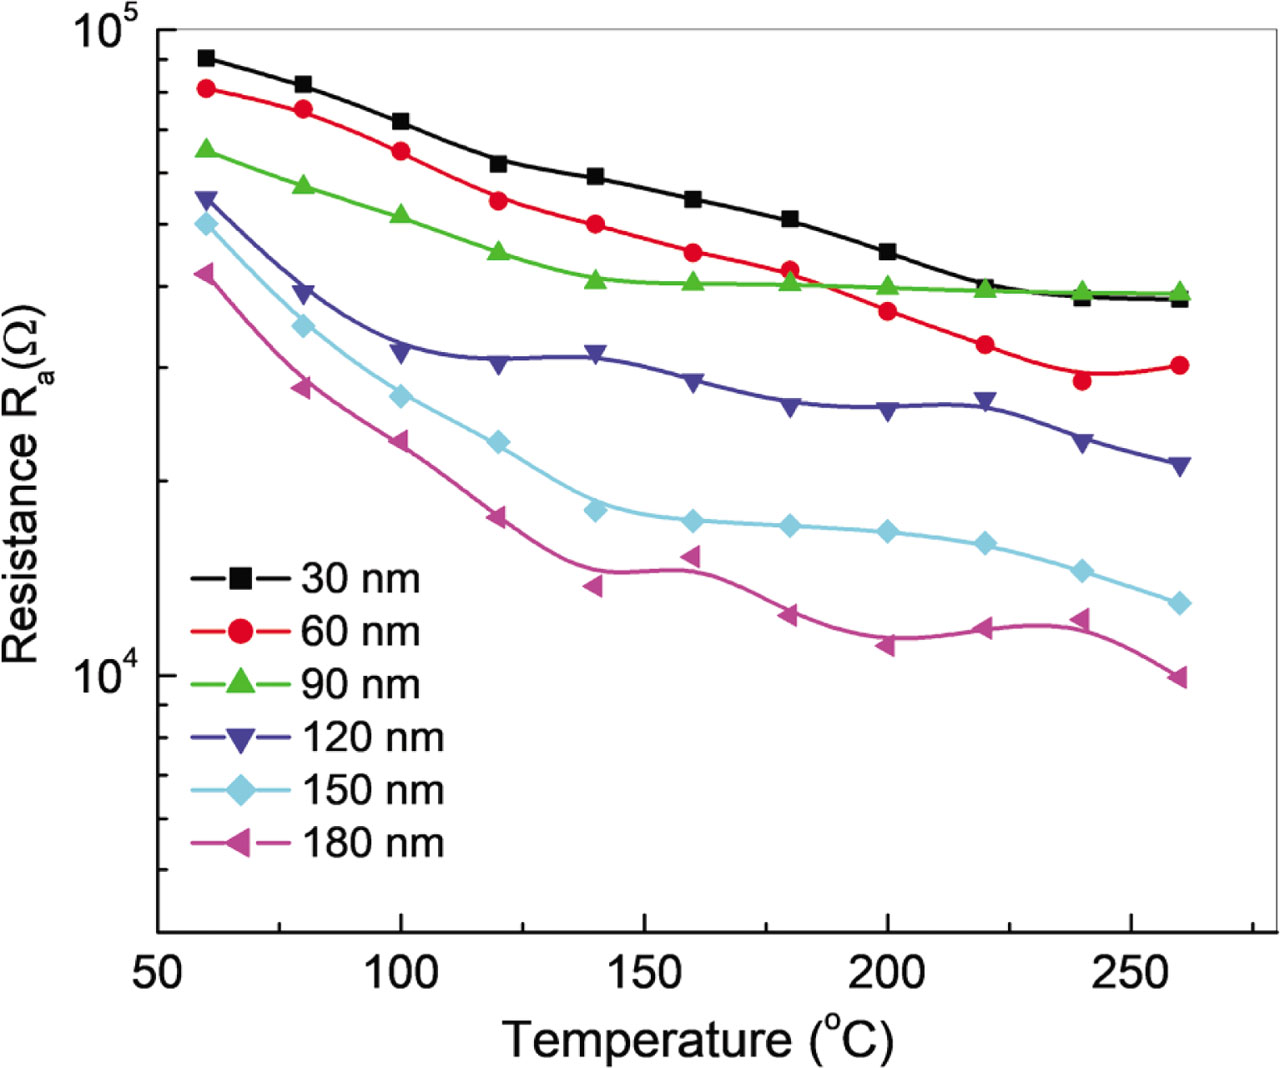
Figure 10
Variation of sensor resistance in air (Ra) as a function of temperature for different thickness values of SnO2 film.
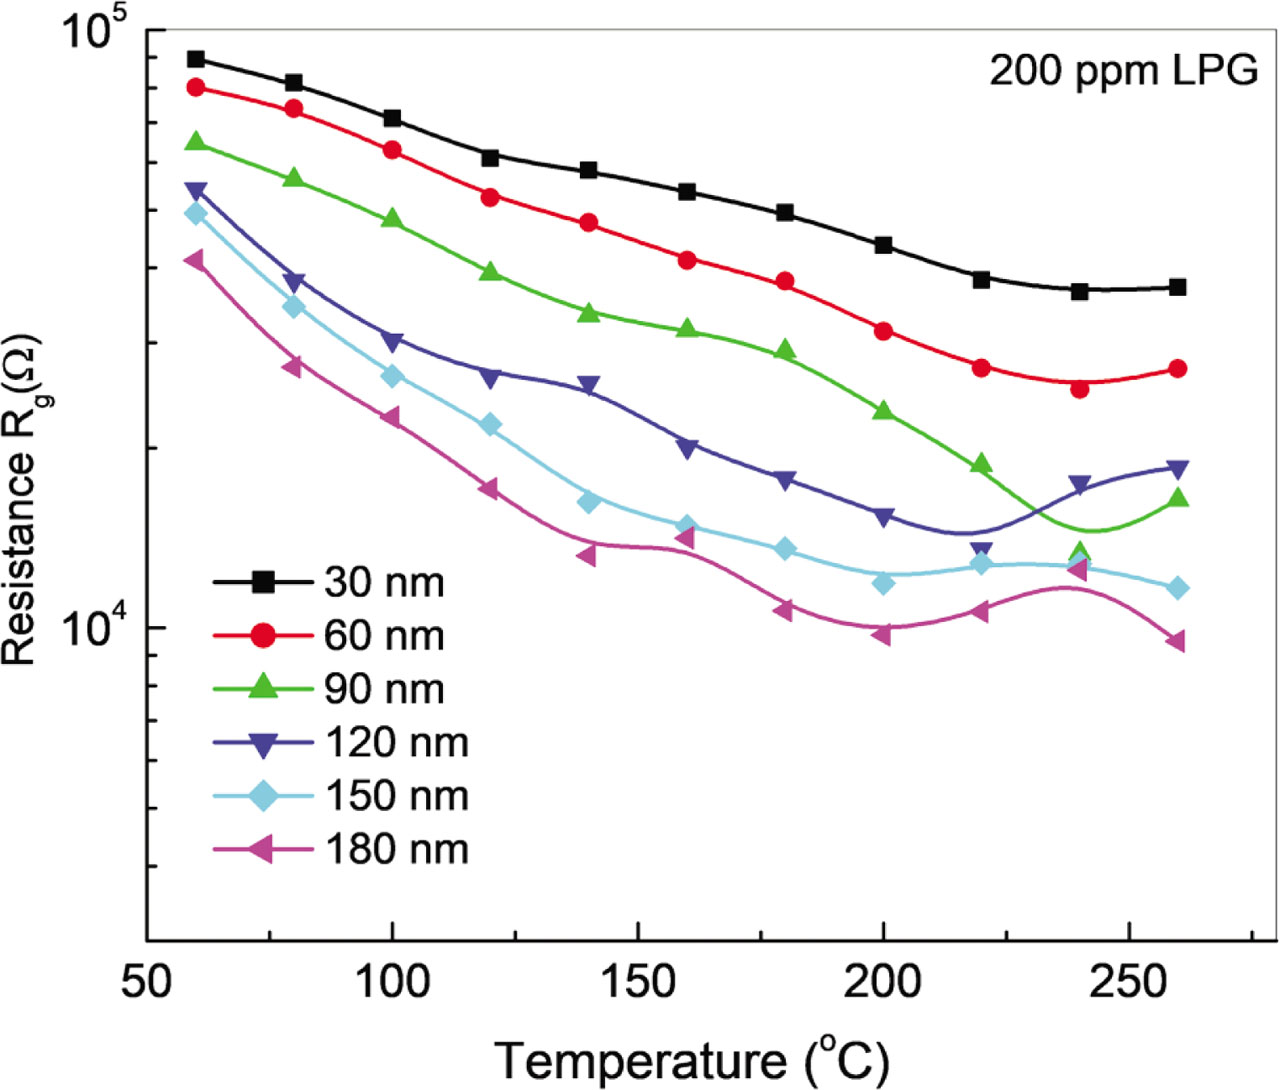
Figure 11
Temperature dependence of sensor resistance (Rg) measured in the presence of 200 ppm LPG for different thickness values of the SnO2 film. LPG, liquefied petroleum gas.
Table 2
Resistance and sensor response variations of SnO2 films as a function of thickness
| SnO2 thickness (nm) | Ra (Ω) (at room temperature) | Rg (Ω) (at operating Temperature) | Operating temperature (°C) | Sensor response |
|---|---|---|---|---|
| 30 | 1.2 × 10⁵ | 3.6 × 10⁴ | 240 | 1.05 |
| 60 | 1.0 × 10⁵ | 2.7 × 10⁴ | 220 | 1.19 |
| 90 | 8.6 × 10⁴ | 1.3 × 10⁴ | 240 | 2.90 |
| 120 | 6.0 × 10⁴ | 1.4 × 10⁴ | 220 | 1.97 |
| 150 | 5.8 × 10⁴ | 1.2 × 10⁴ | 200 | 1.40 |
| 180 | 5.4 × 10⁴ | 1.1 × 10⁴ | 180 | 1.15 |
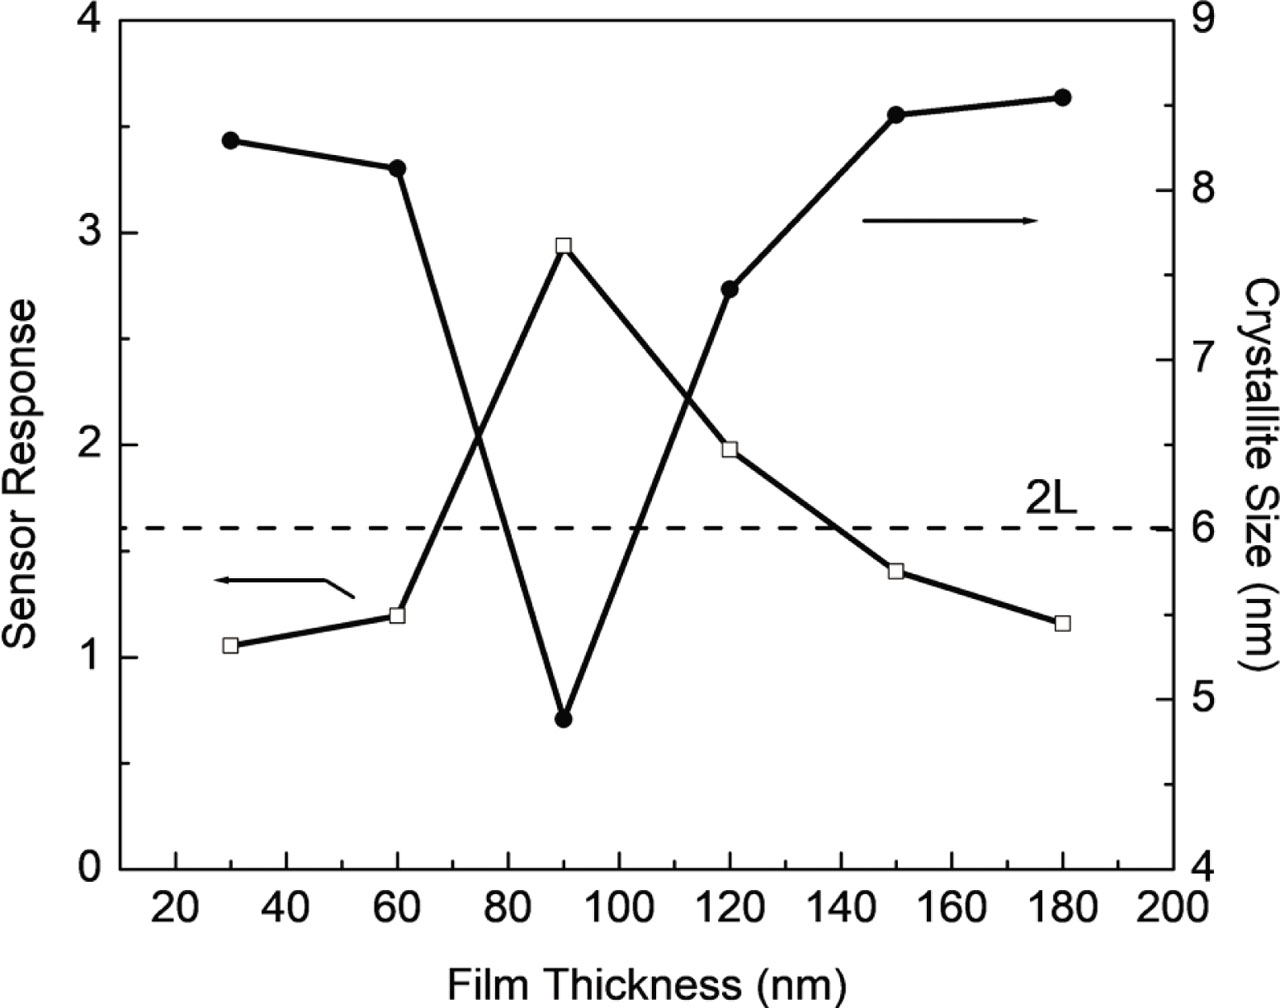
Figure 12
Sensor response of SnO2 thin film sensor as a function of sensing layer thickness for detection of 200 ppm of LPG. LPG, liquefied petroleum gas.
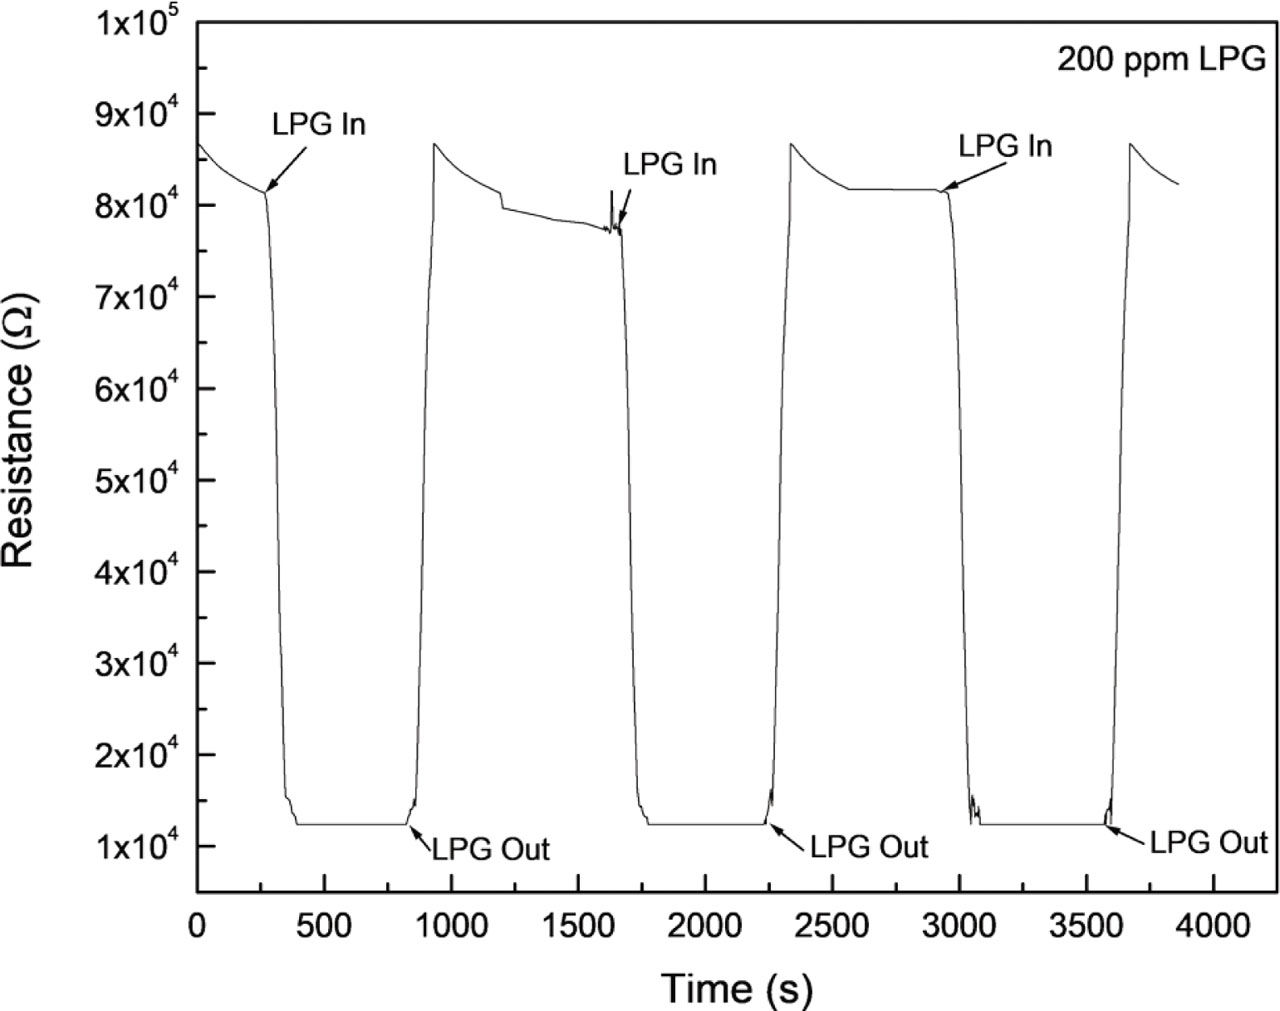
Figure 13
Transient response of the 90 nm SnO2 thin film under repeated exposures to 200 ppm LPG. LPG, liquefied petroleum gas.