
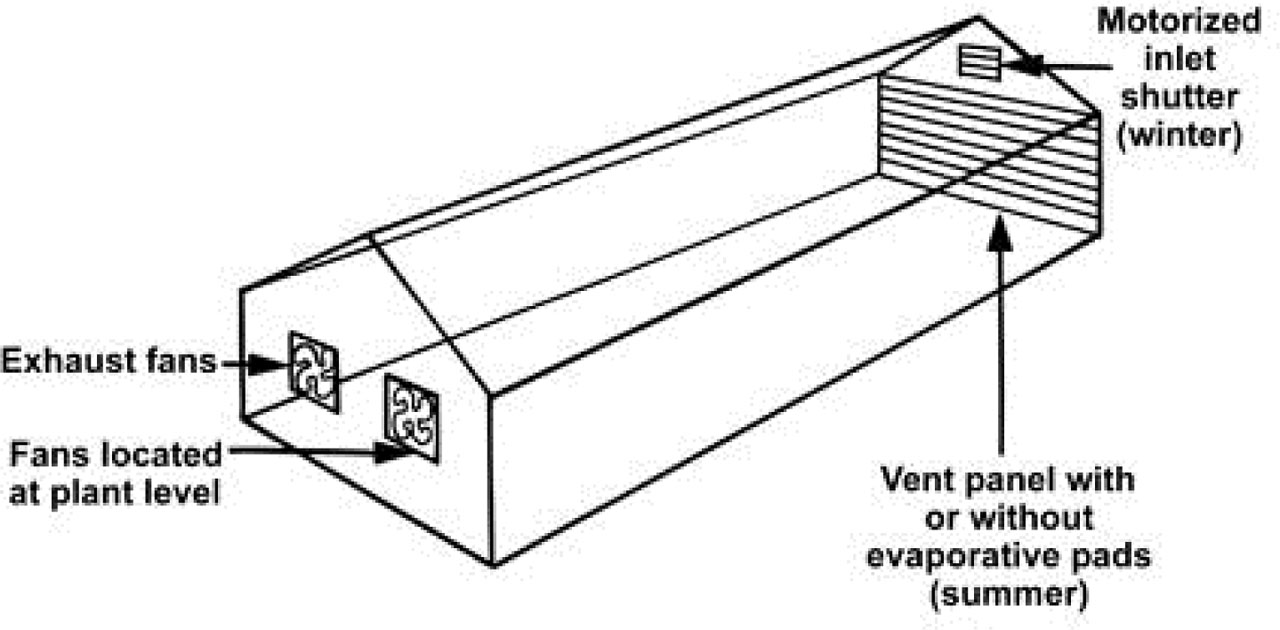
Figure 1
Smart Greenhouse with ventilation and automated cooling and heating system.
Table 1
Recommended temperature of tomato greenhouse based on light levels
| Minimum Temperature | Low Light (Cloudy Days) | High Light (Sunny Days) |
|---|---|---|
| Night | 63°F (17°C) | 64°F (18°C) |
| Day | 66°F (19°C) | 70°F (21°C) |
Table 2
Relative humidity ranges related to temperature in greenhouses
| Temperature °F (°C) | Relative humidity range |
|---|---|
| 60 (16) | 60%–75% |
| 65 (18) | 65%–80% |
| 70 (21) | 70%–80% |
| 75 (24) | 75%–85% |
| 80 (27) | 80%–85% |
| 85 (29) | 85%–90% |
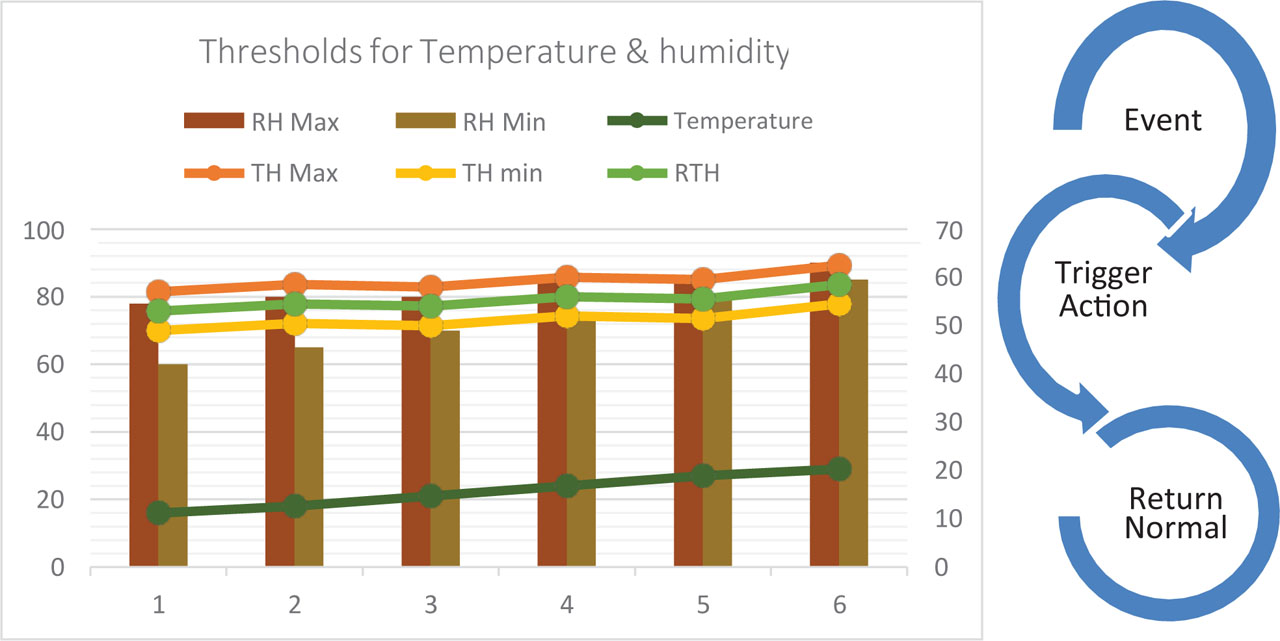
Figure 2
Relation between temperature and humidity. RH Max, Maximum Relative Humidity; RH Min, Minimum Relative Humidity; Temperature, Absolute temperature degree; RTH, Normal Relative Temperature to Humidity level; TH Max, The Maximum Value of Threshold to Action.
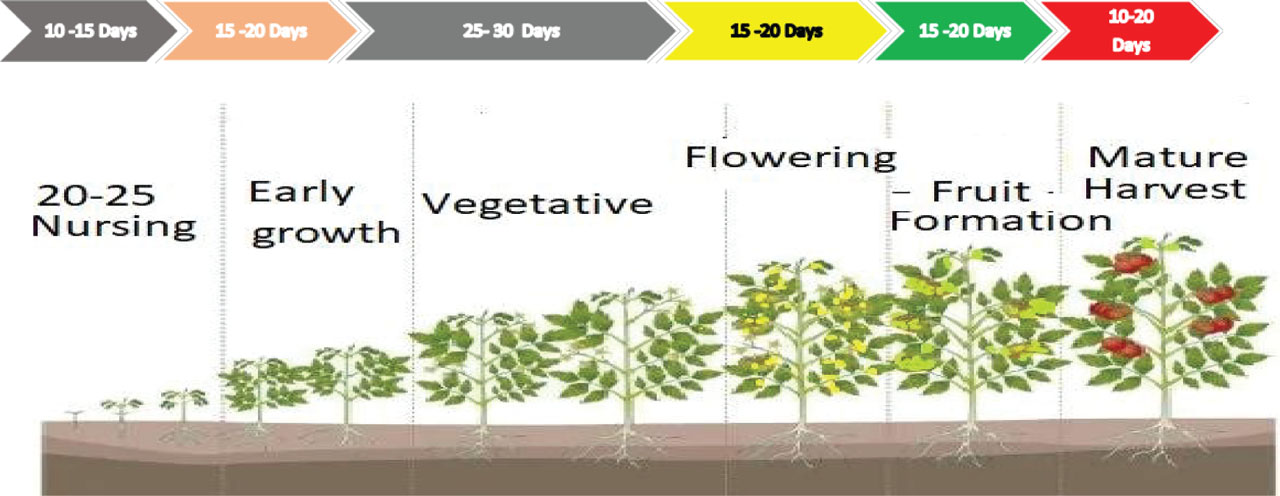
Figure 3
Growing stages of tomato plant last about 100 days.
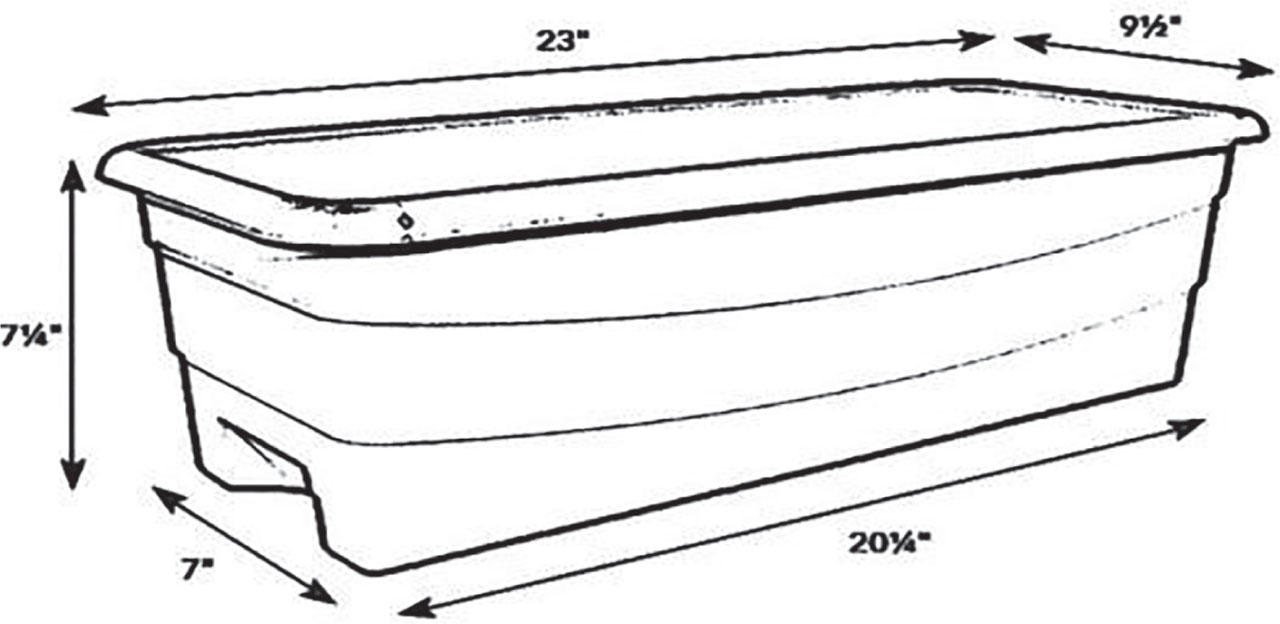
Figure 4
Testing container dimensions.
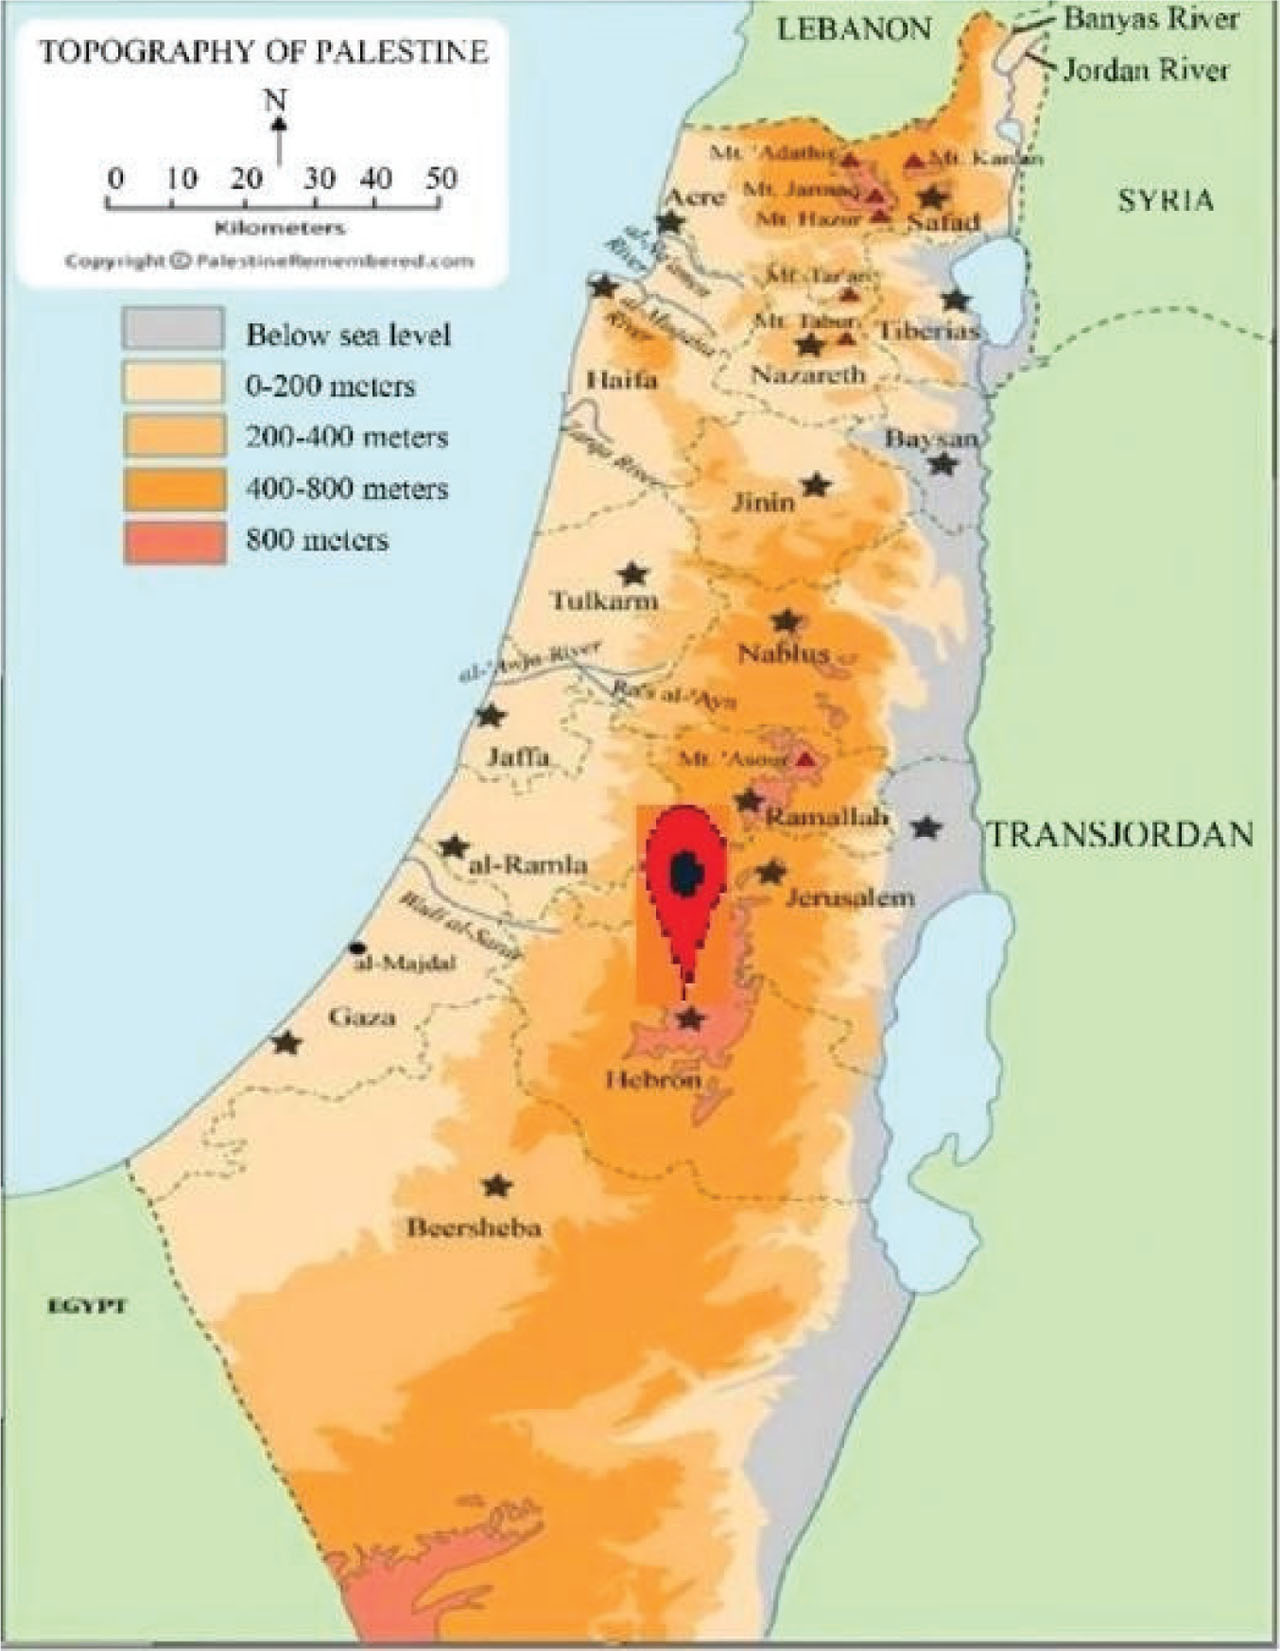
Figure 5
Geographic location where experiment is conducted, Palestine, Hebron district.
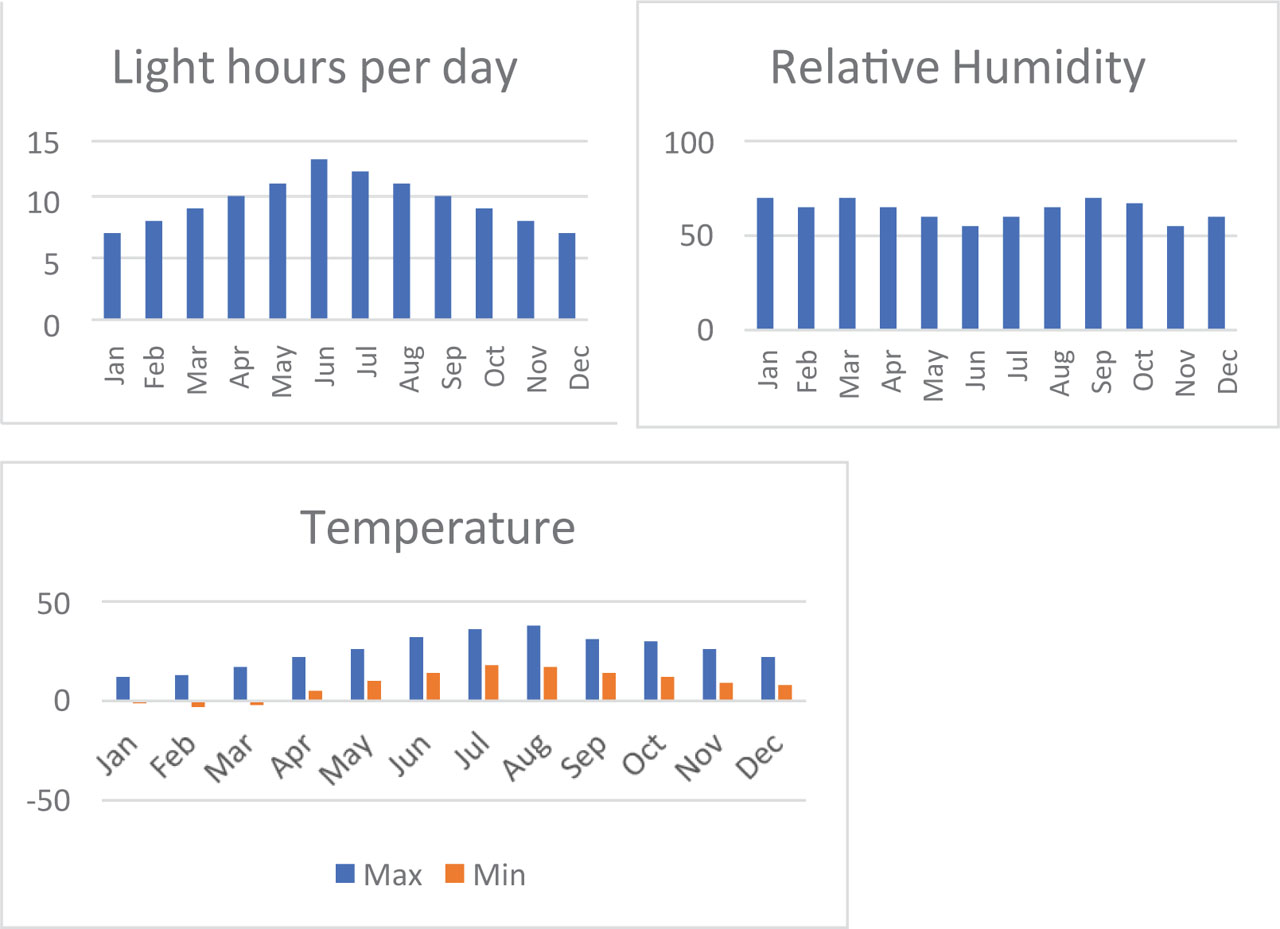
Figure 6
Annual climate condition of testing area.
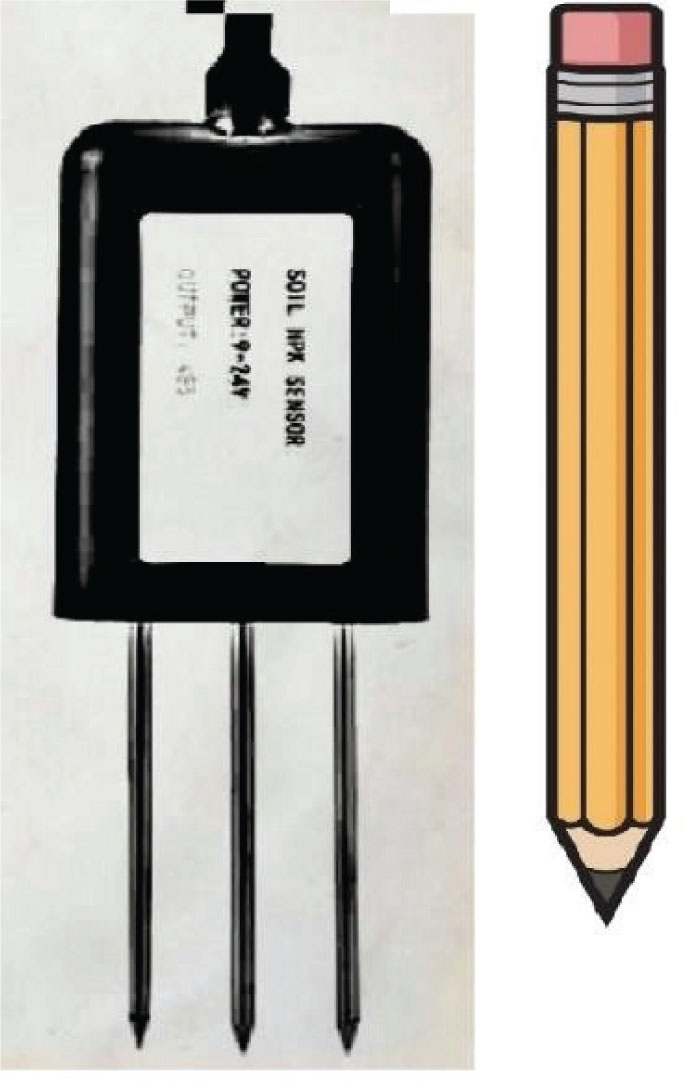
Figure 7
Nitrogen Phosphorus Potassium sensor actual size.
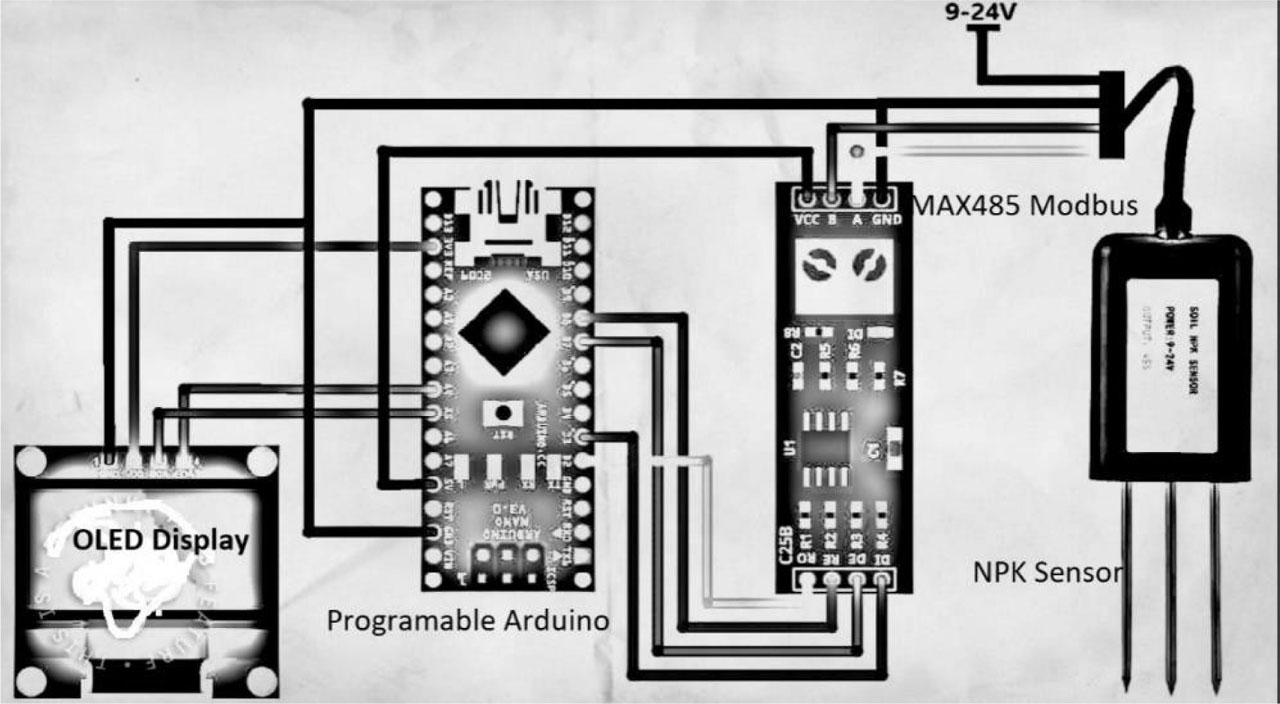
Figure 8
IoT system to check and calibrate substants NPK in soil.
| Address Code | Function Code | Register Start address | Register Length | CRC_L | CRC_H |
|---|---|---|---|---|---|
| 0x01 | 0x03 | 0x00 0x1e | 0x00 0x01 | 0XE4 | 0x0C |
| Address Code | Function Code | Effective Number of bytes | Nitrogen Value | CRC_L | CRC_H |
|---|---|---|---|---|---|
| 0x01 | 0x03 | 0x02 | 0x00 0x20 | 0Xb9 | 0x9C |
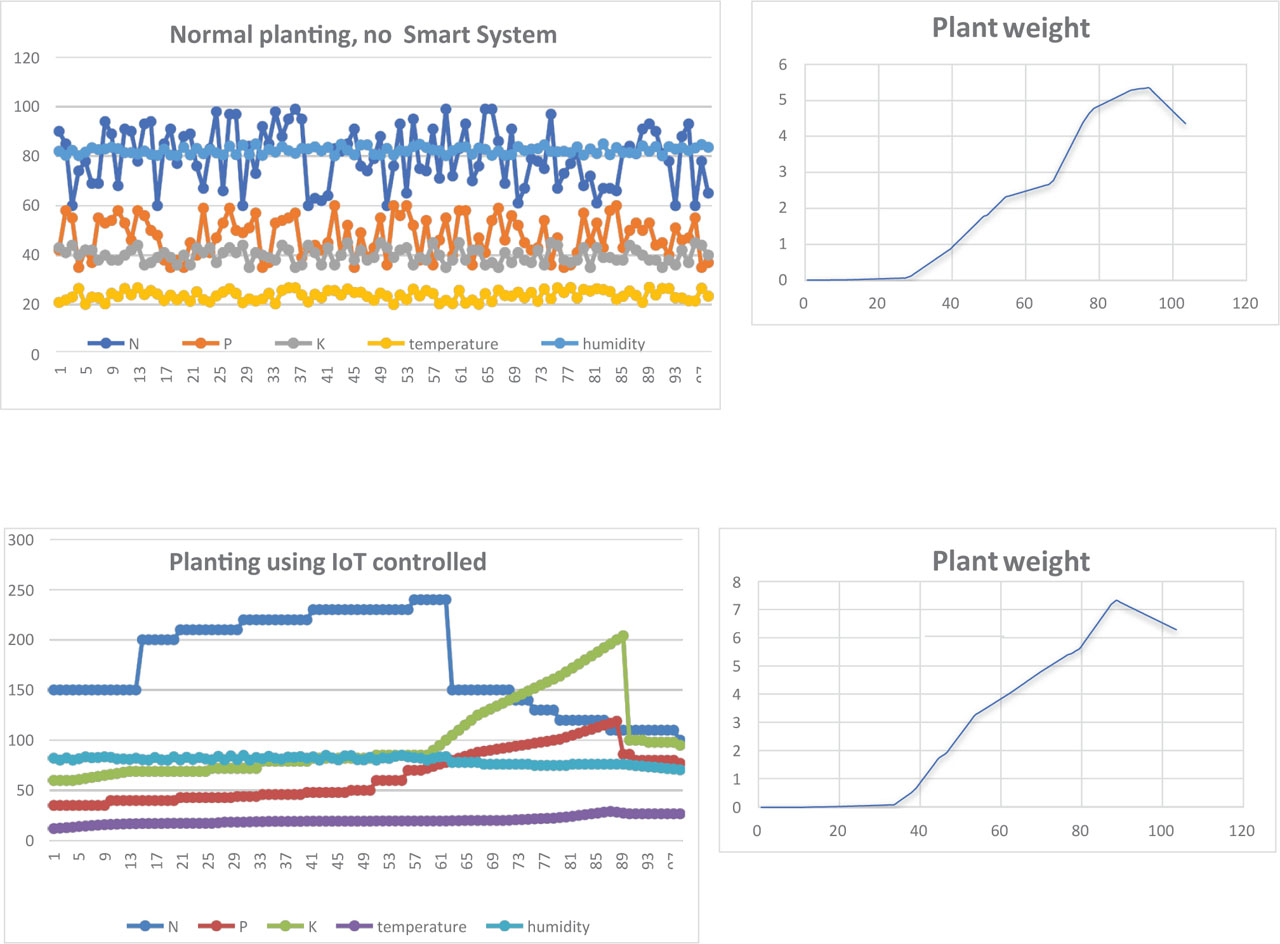
Figure 9
A) Concentrations of NPK and