
Table 1
Shares of sectors in the total value added (at factor cost) by SME.
| Total value added by SME | Manufacturing | Construction | Trade | Services | |||||
|---|---|---|---|---|---|---|---|---|---|
| Year | mln EUR | mln EUR | % | mln EUR | % | mln EUR | % | mln EUR | % |
| 2020 | 1,312,594 | 160,356 | 19 | 116,633 | 14 | 188,757 | 22 | 346,015 | 41 |
| 2022 | 853,487 | 174,671 | 18 | 129,894 | 14 | 218,954 | 23 | 380,567 | 40 |
Source: Own elaboration based on Eurostat data for the non-financial business economy. The data for 2022 are Eurostat estimates, as actual data are unavailable.
Table 2
Literature review on M&A motives in the SME sector.
| Authors (year) | Country, research method of data collection, sample, year of the study | Topic | Findings (relevant to this study) |
|---|---|---|---|
| Hirigoyen and Basly (2019) | France, questionnaire survey, 69 responses, 2012 | Factors that influence family business sale decisions in the context of the 2008 crisis | Motives for exit/selling
|
| Becker et al. (2016) | Germany, 34 semi-structured interviews with owners and managers, 2012 | Various aspects of M&A transactions carried out by the German Mittelstand (including SME) | Motives for M&A
|
| Parastuty et al. (2016) | Austria, questionnaire survey among 212 entrepreneurs (41 exited their firms), 38 responses, 2009–2013 | Motives for entrepreneurial exit among young firms | Motives for exit/selling
|
| Arvanitis and Stucki (2014) | Switzerland, questionnaire survey, 405 responses, 2011 | Firm characteristics that determine the innovation and economic performance of M&A | Motives for M&A
|
| Steen et al. (2014) | Australia, five semi-structured interviews with CEOs of microcap firms with M&A experience, 2014 | M&A experience of microcap businesses: determinants of success, pitfalls and problems with integration | Motives for buying
|
| Nisar et al. (2012) | Norway, questionnaire survey among upper-level managers of multinational SME 53 responses, 2009 | Motives behind the equity modes of foreign market entry, including cross-border M&A of SME | Motives for (cross-border) M&A
|
| Harada (2007) | Japan, secondary data from the survey implemented by the Japan SME Corporation in November 2003, 1,743 observations, 2005 | Exit and post-exit behaviour of small firms and their managers | Motives for exit/selling
|
| Mickelson and Worley (2003) | The United States/Canada, 12 semi-structured interviews with key persons from both the buyer and seller sides, 1997 | Critical differences between typical M&A and those involving a family firm (the acquisition of a family business by a larger company) | Motives for buying
|
| Ronstadt (1986) | The US questionnaire survey among ex-entrepreneurs 95 responses, 1982 | Motives for the entrepreneurial exit, exit mode (e.g., selling out or liquidation), and timing | Motives for exit/selling
|
Note: M&A motives: strategic (S), technical and operational (T/O), market and marketing (M/M), financial (F), and managerial (MNG).
Source: Own elaboration.
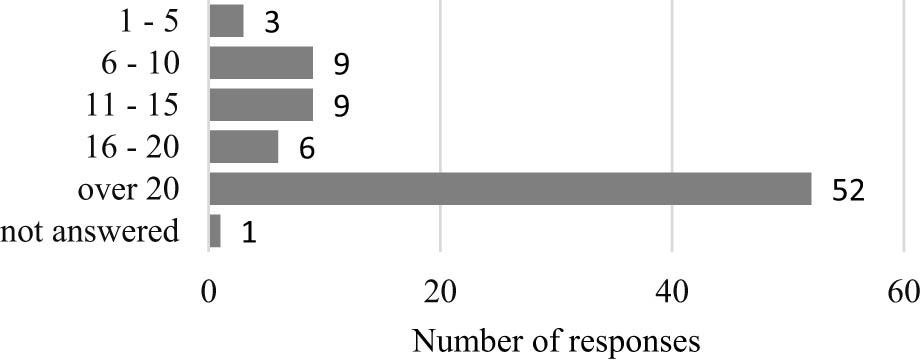
Figure 1
Number of M&A transactions involving SME supported by an advisor.
Source: Own elaboration.
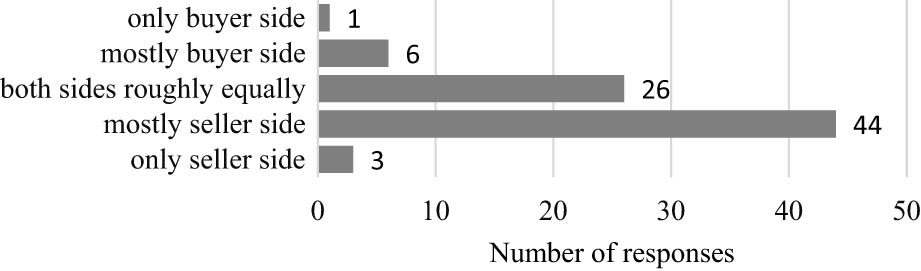
Figure 2
Side supported in M&A transactions.
Source: Own elaboration.
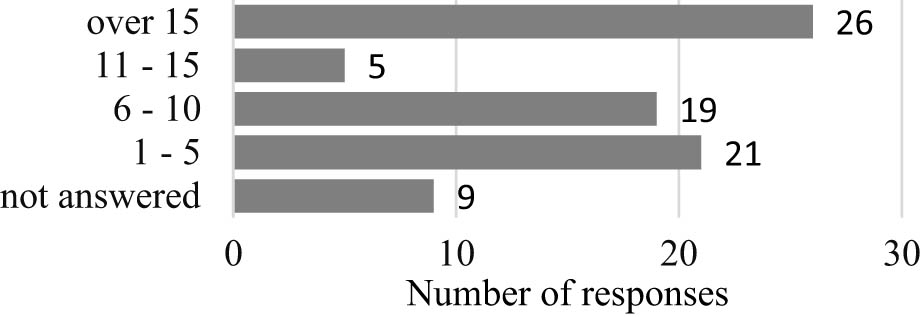
Figure 3
The number of M&A transactions where the targets were family businesses.
Source: Own elaboration.
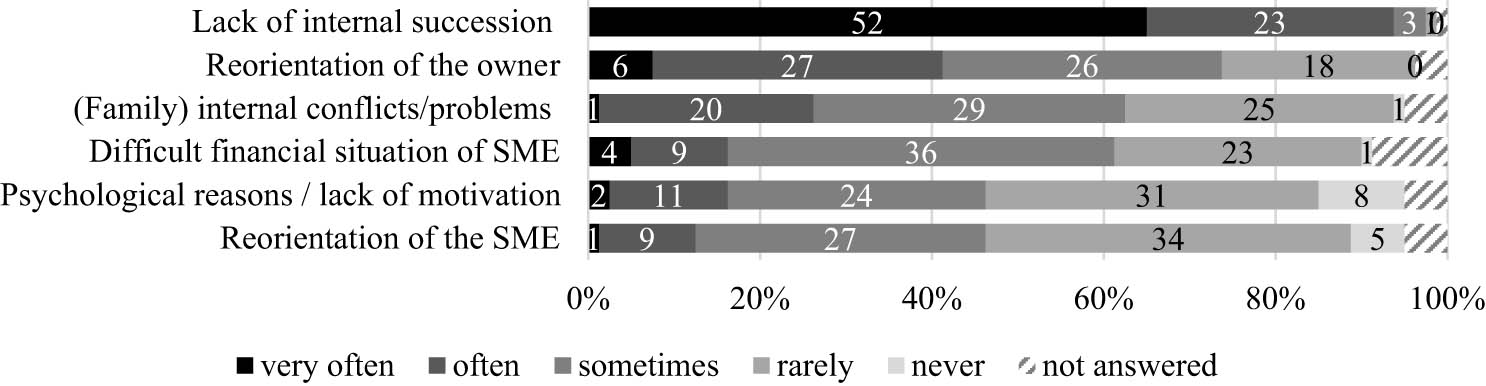
Figure 4
Motives for selling SME.
Source: Own elaboration.
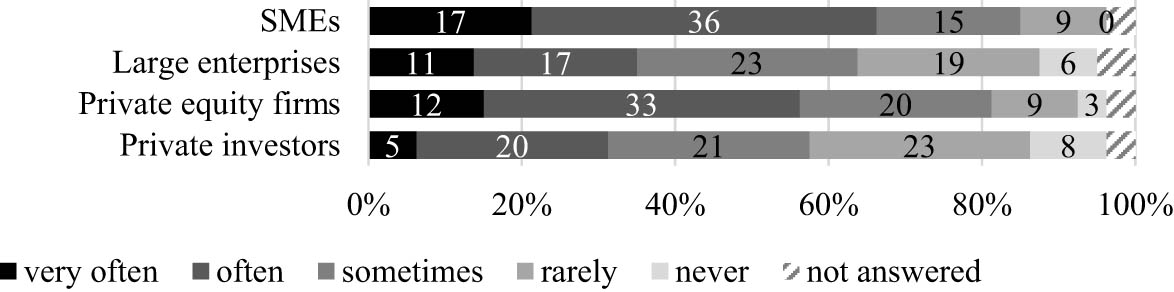
Figure 5
Entities acting as prospective buyers in the SME takeover.
Source: Own elaboration.
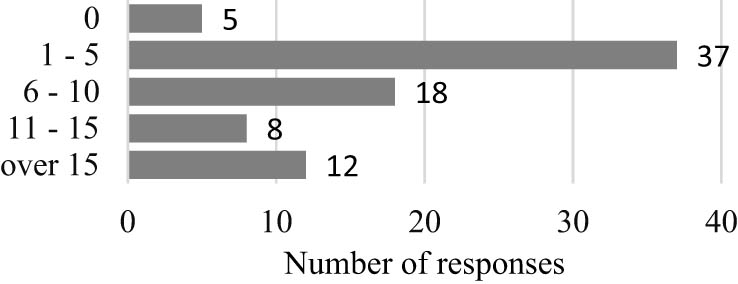
Figure 6
Number of M&A transactions with prospective buyers of SME from abroad.
Source: Own elaboration.
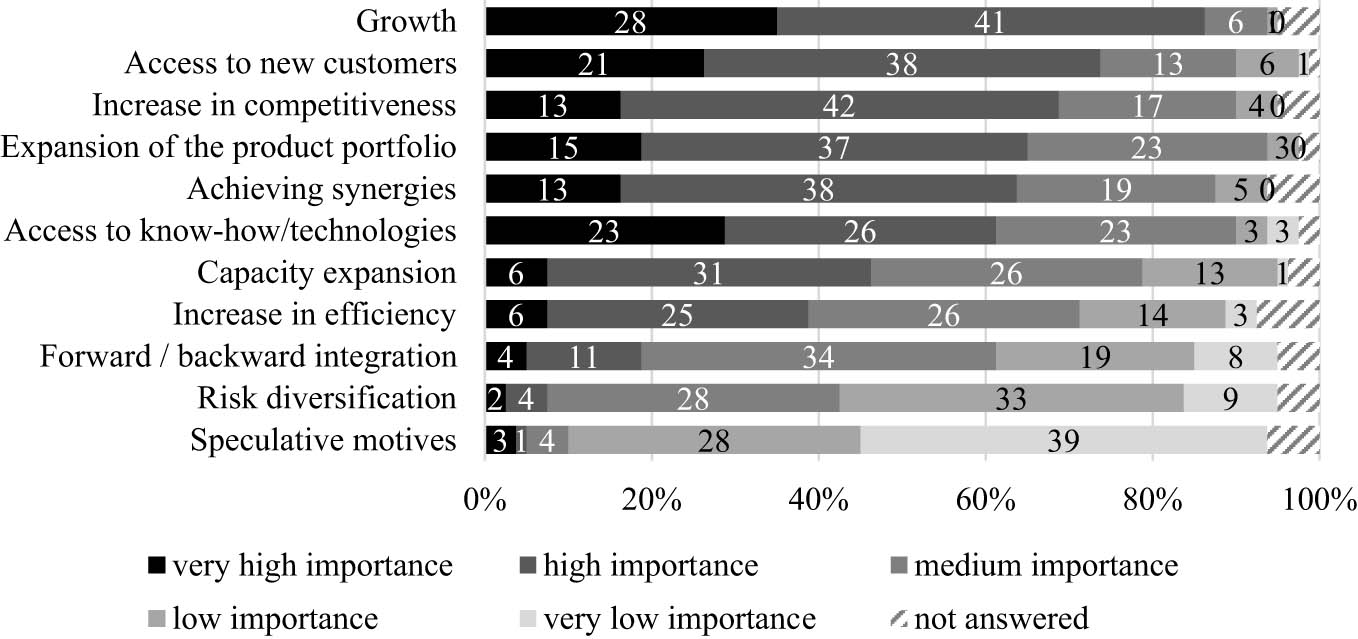
Figure 7
The role that buyer motives play in SME acquisitions.
Source: Own elaboration.
Table 3
Statistical comparison of M&A motive frequencies across advisor groups.
| Grouping variable | Statistical test | Sellers’ motives | Buyers’ motives |
|---|---|---|---|
| Experience in SME M&A (greater/lower) | U Mann–Whitney | No statistically significant differences between groups | No statistically significant differences between groups |
| Experience in supporting family firms (greater/lower) | U Mann–Whitney | No significant differences between groups | Advisors with greater experience perceived growth as a less important motive (p-value = 0.047) |
| Side supported in M&A transactions (buyer/seller/both) | Kruskal–Wallis | Advisors supporting the buyer side perceive reorientation of the owners as a more frequent motive (p-value = 0.018) | No significant differences between groups |
Source: Own elaboration.
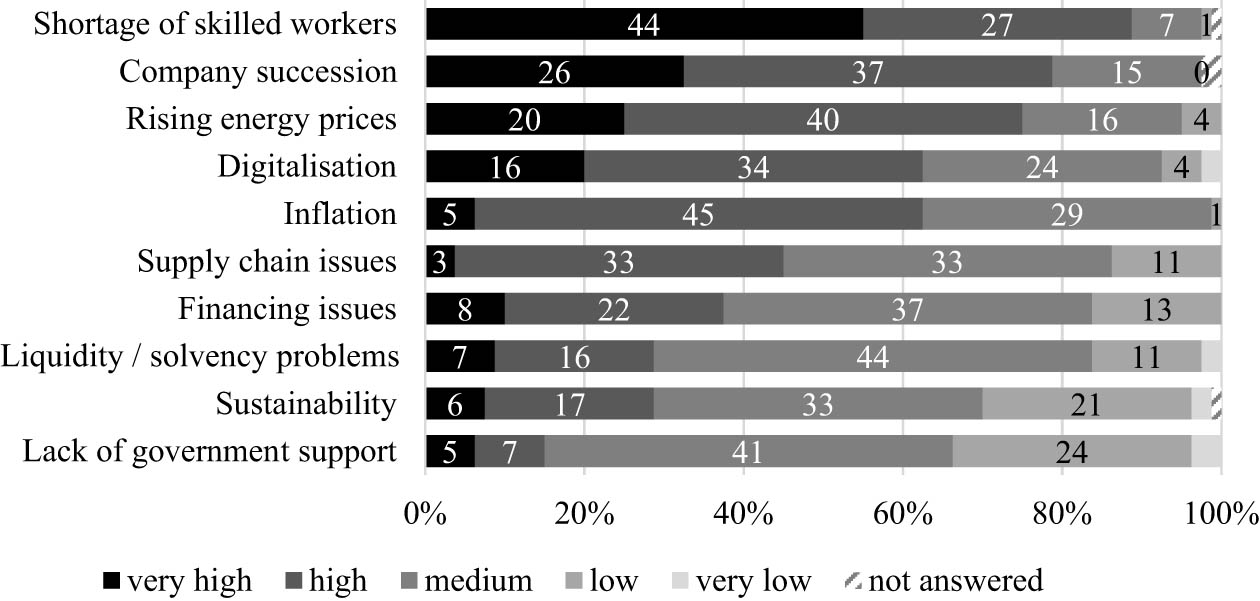
Figure 8
Relevance of the challenges in the SME sector.
Source: Own elaboration.