
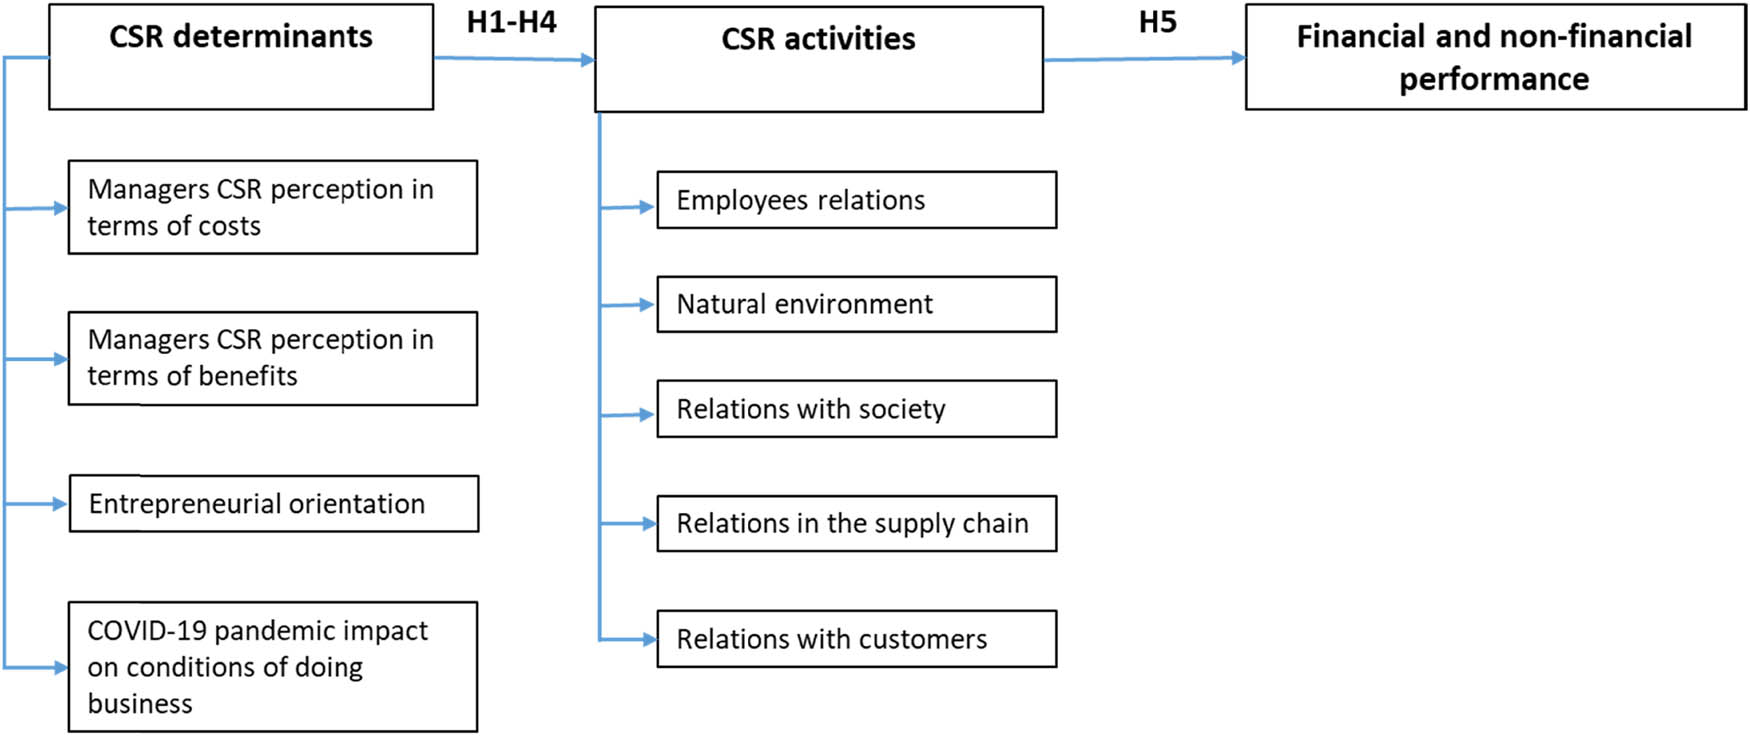
Figure 1
Conceptual model of the relationship between the variables included in the study.
Source: Own elaboration.
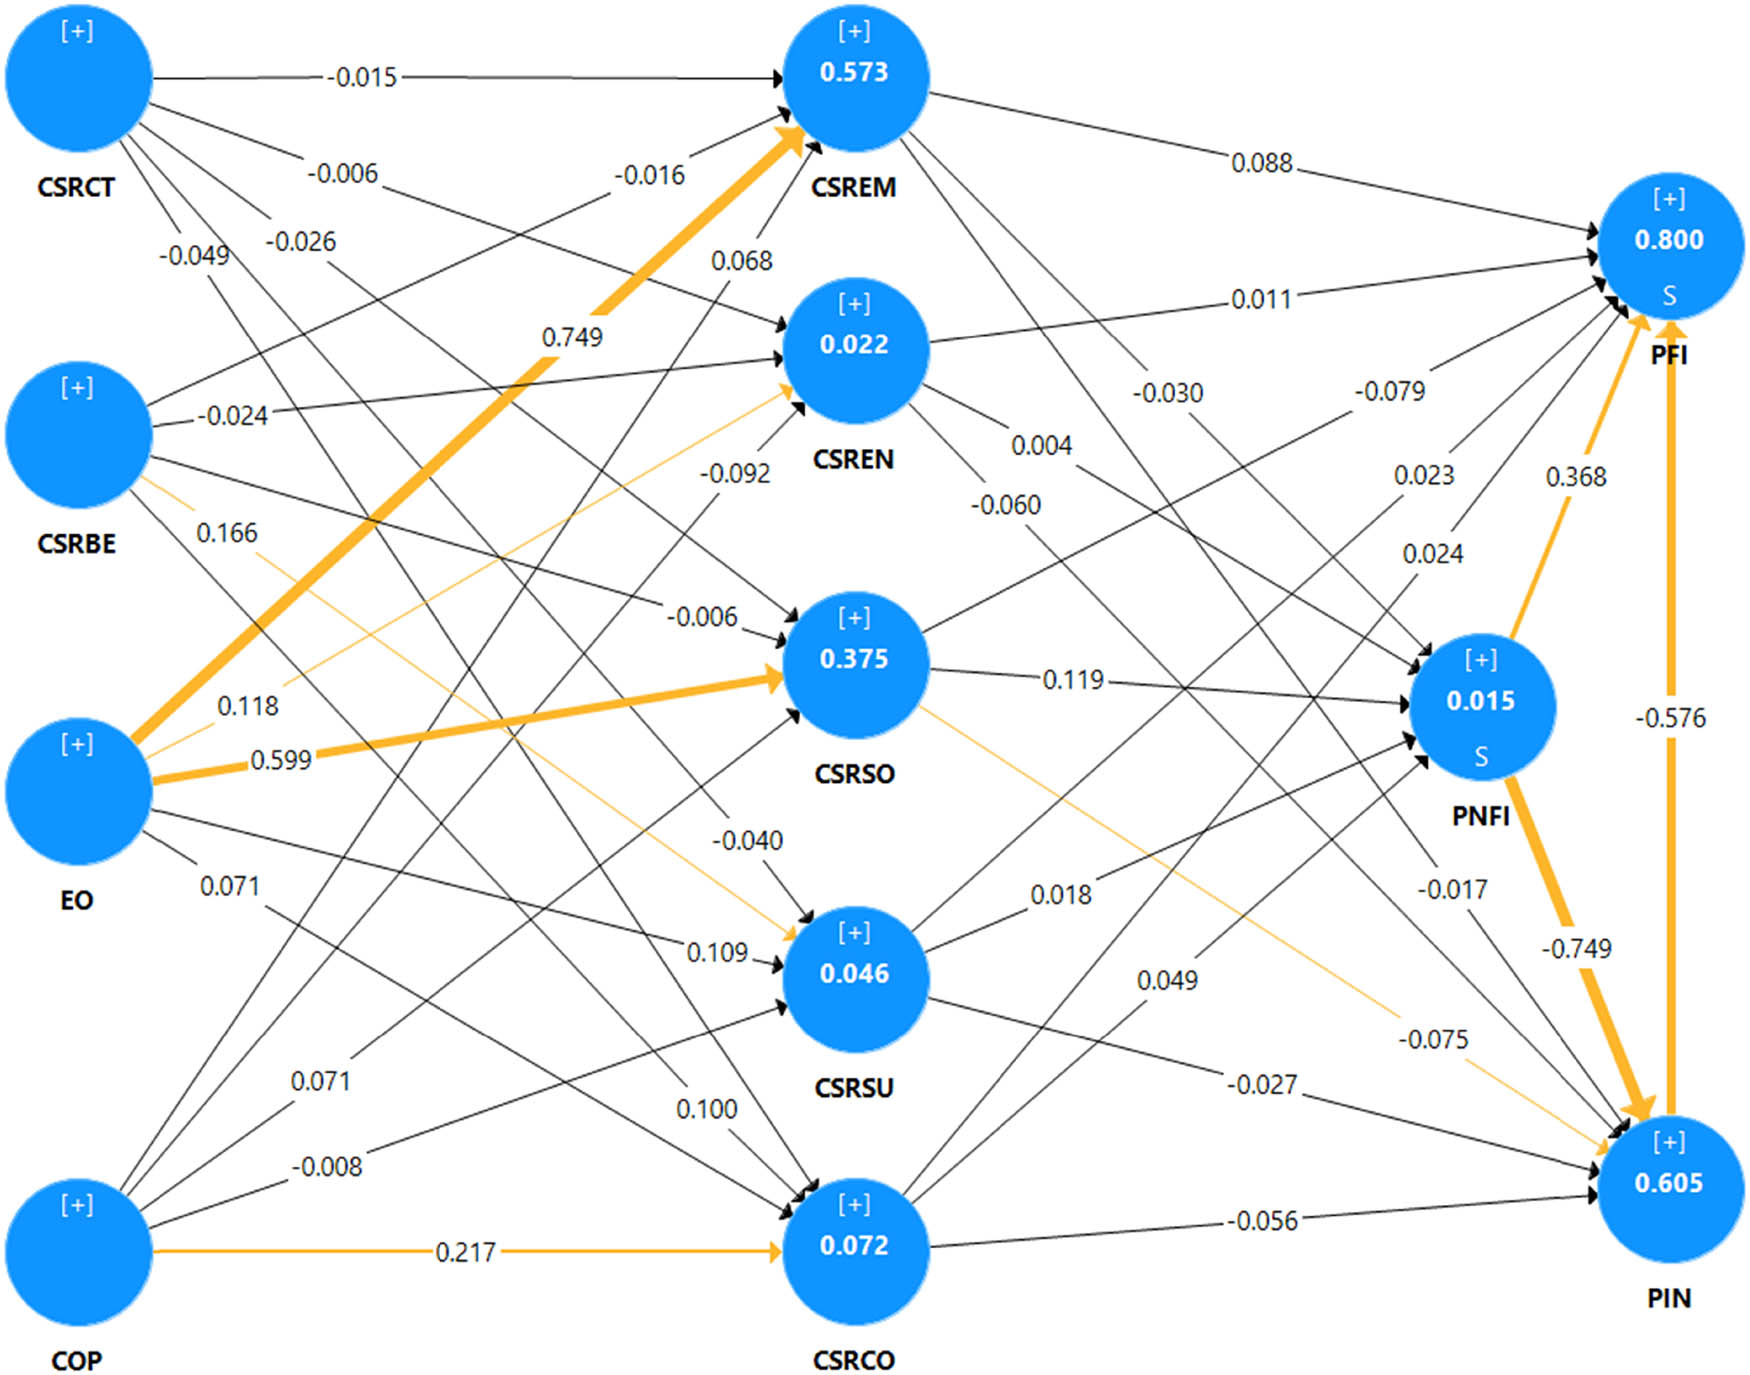
Figure 2
Structural model of relations between constructs. Explanations: Circles represent hidden variables, and the values given inside indicate the coefficients of determination R 2. Arrows (regression paths) between hidden variables indicate their cause–effect relationships resulting from theoretical assumptions (yellow color indicates statistically significant relationships), and the values indicated in the arrows represent path coefficients (i.e., standardized regression coefficients).
Source: Own elaboration with the use of SmartPLS software.
Table 1
Path coefficients and significance of relations between constructs (N = 241).
| Hypothesis | Path coefficients | Original sample | P values |
|---|---|---|---|
| H1 – not confirmed | |||
| H2 – partially confirmed | CSRBE → CSRSU | 0.166 | 0.032 |
| H3 – partially confirmed | EO → CSREM | 0.749 | 0.000 |
| EO → CSREN | 0.118 | 0.095 | |
| EO → CSRSO | 0.599 | 0.000 | |
| H4 – partially confirmed | COP → CSRCO | 0.217 | 0.006 |
| H5 – not confirmed |
Source: Own elaboration with the use of SmartPLS software.