
Figure 1.
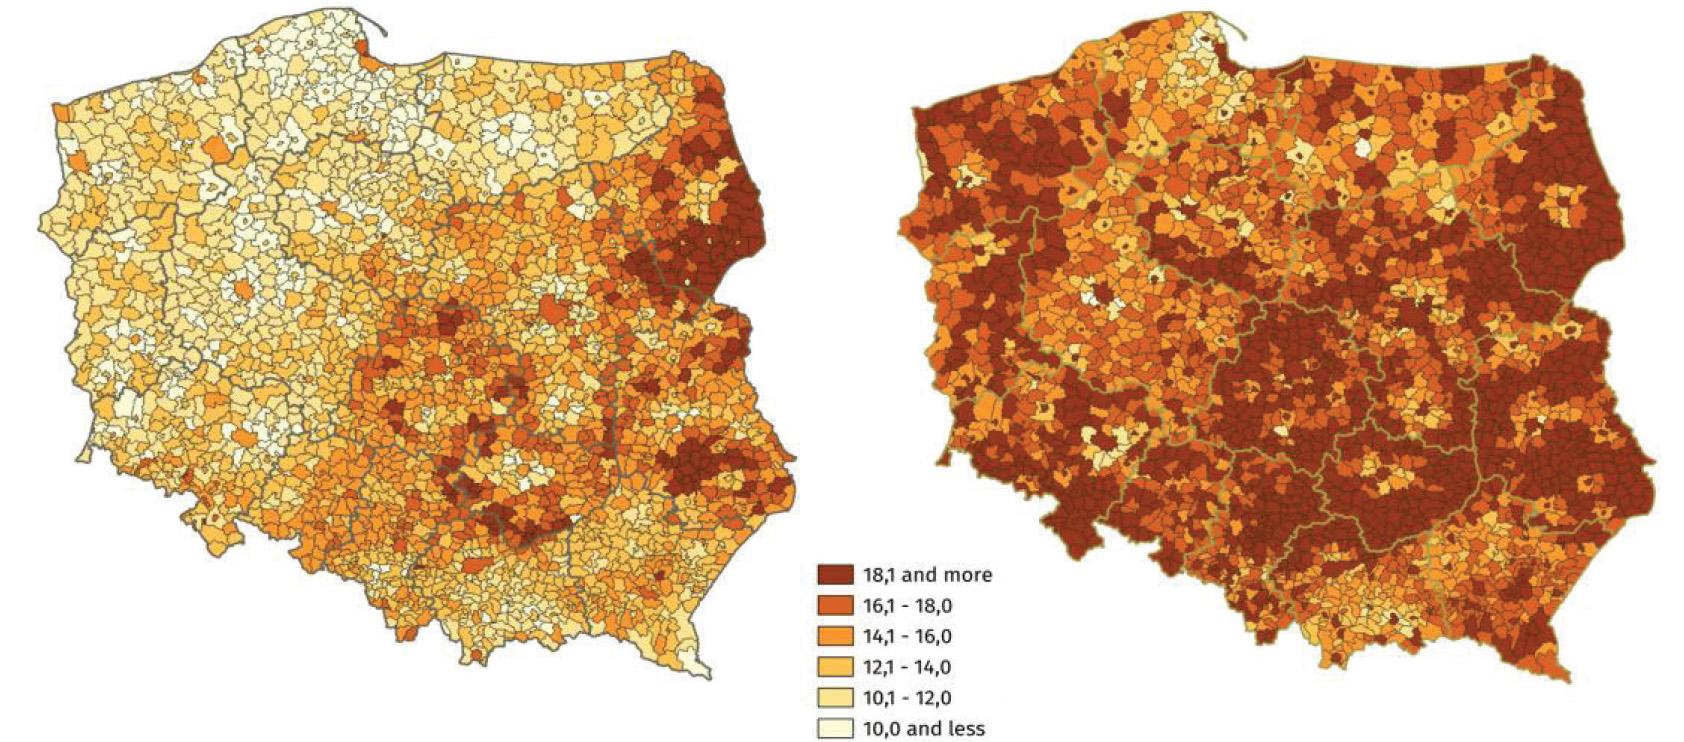
Figure 2.
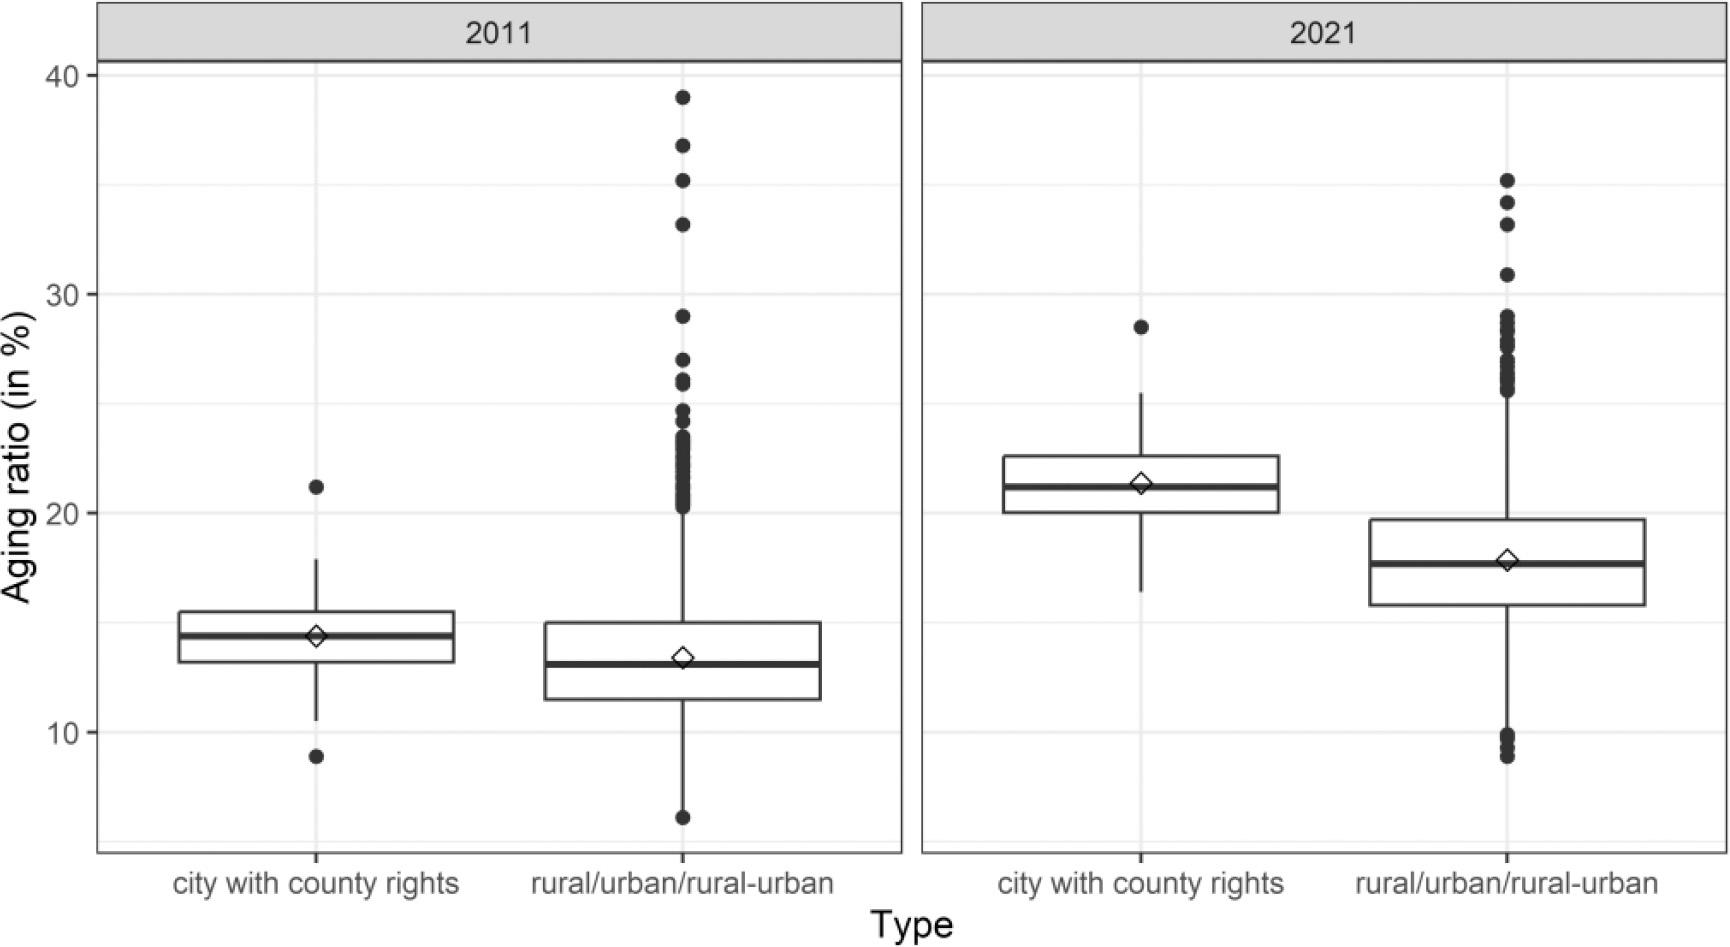
Figure 3.
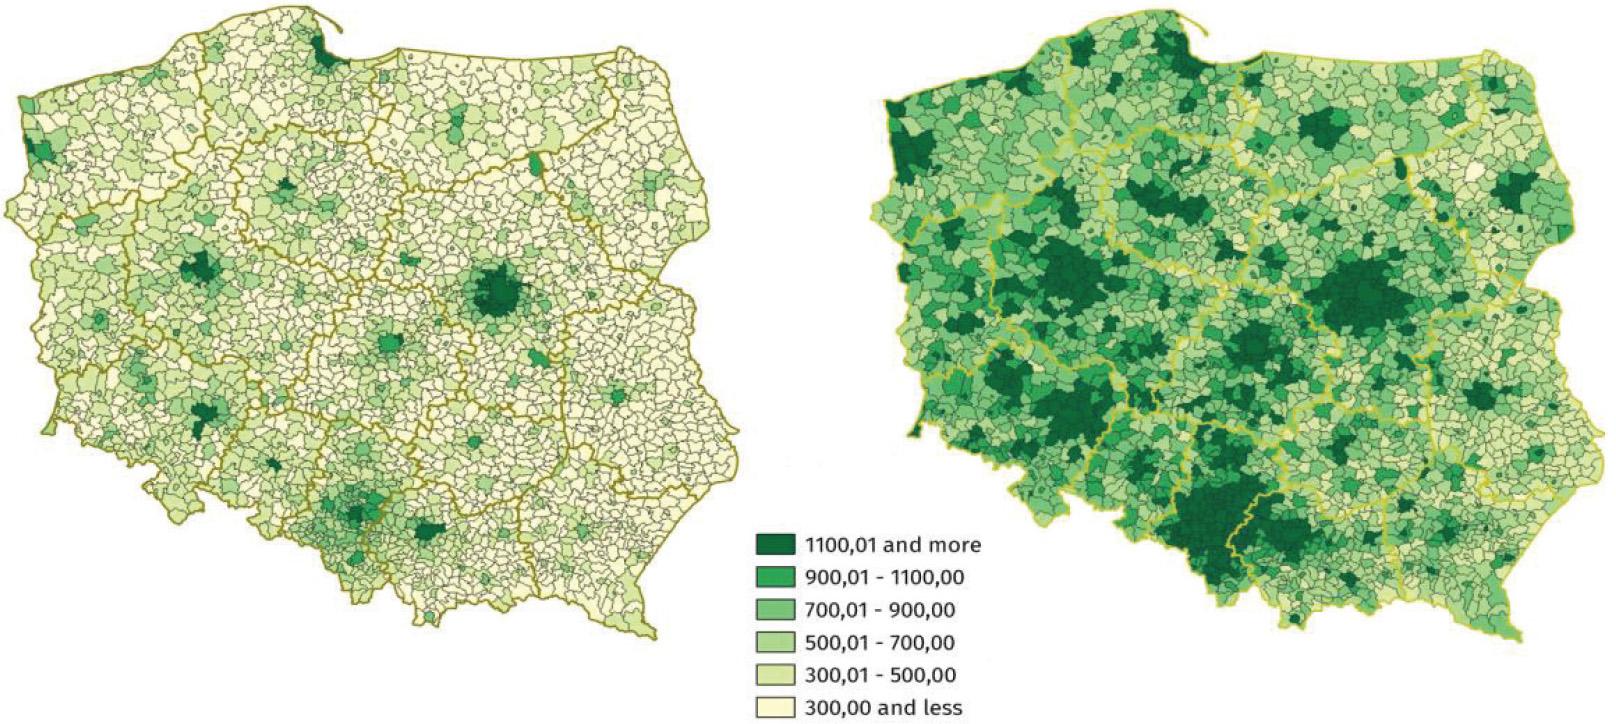
Figure 4.
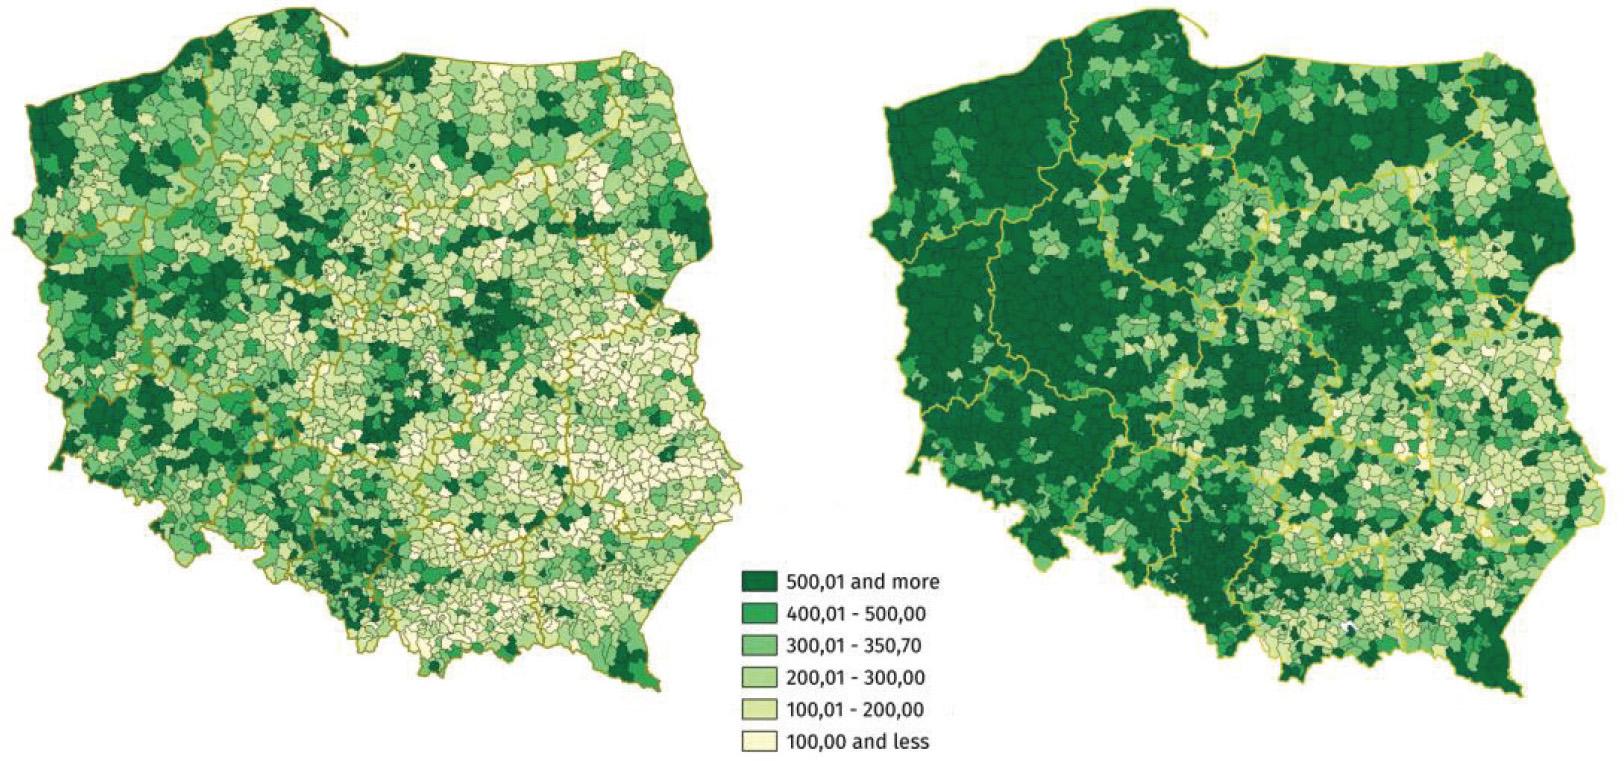
Figure 5.
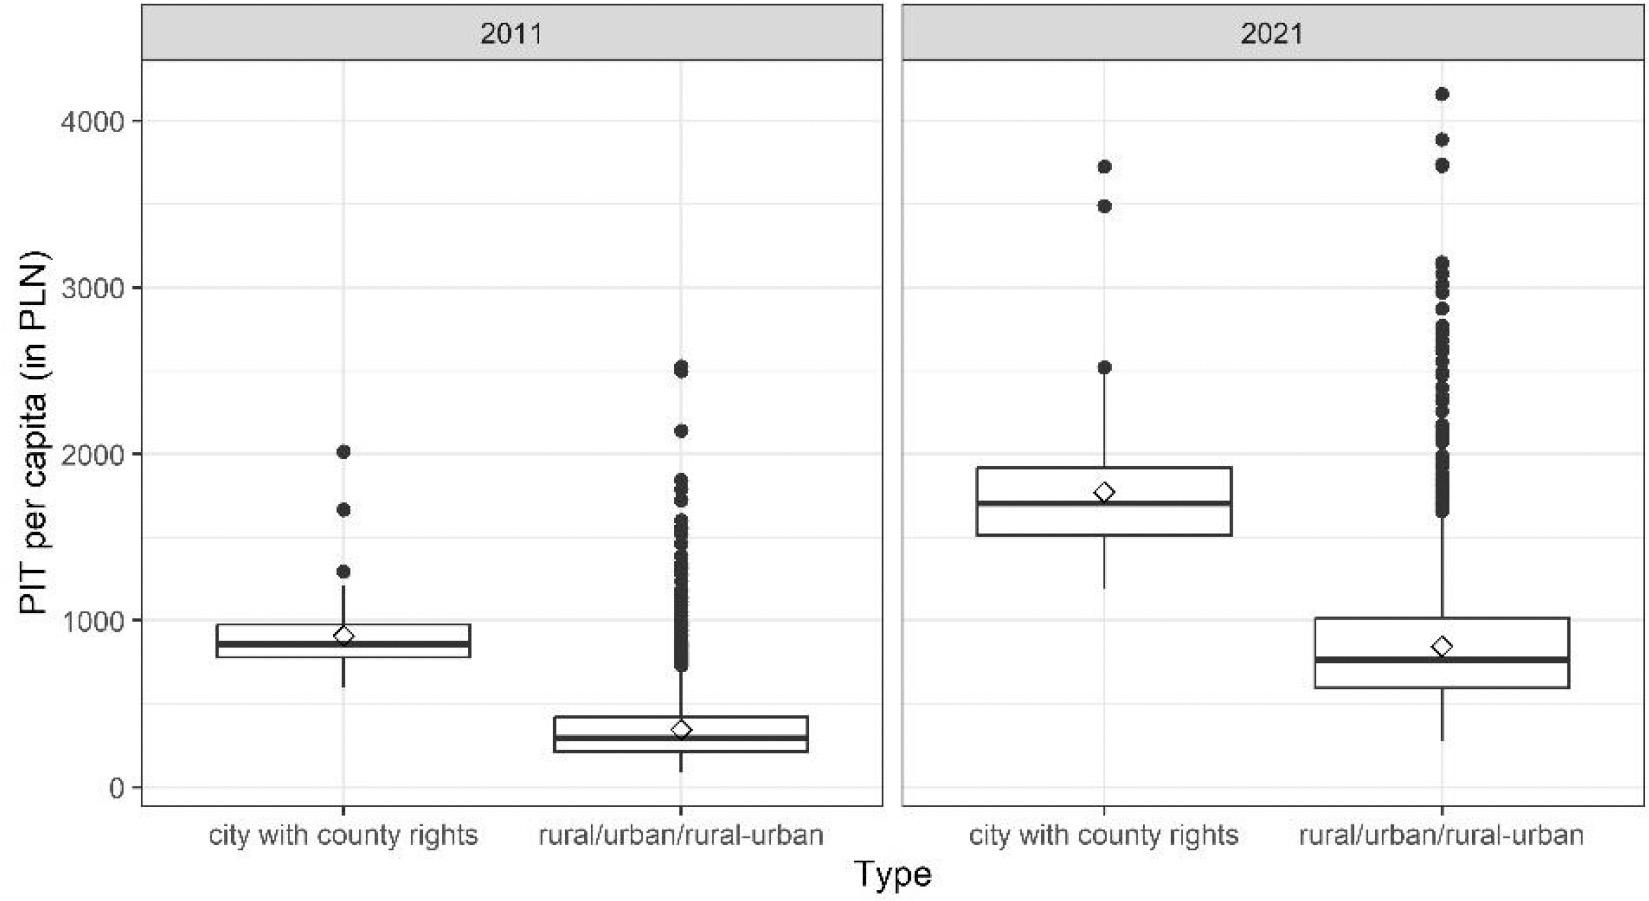
Figure 6.
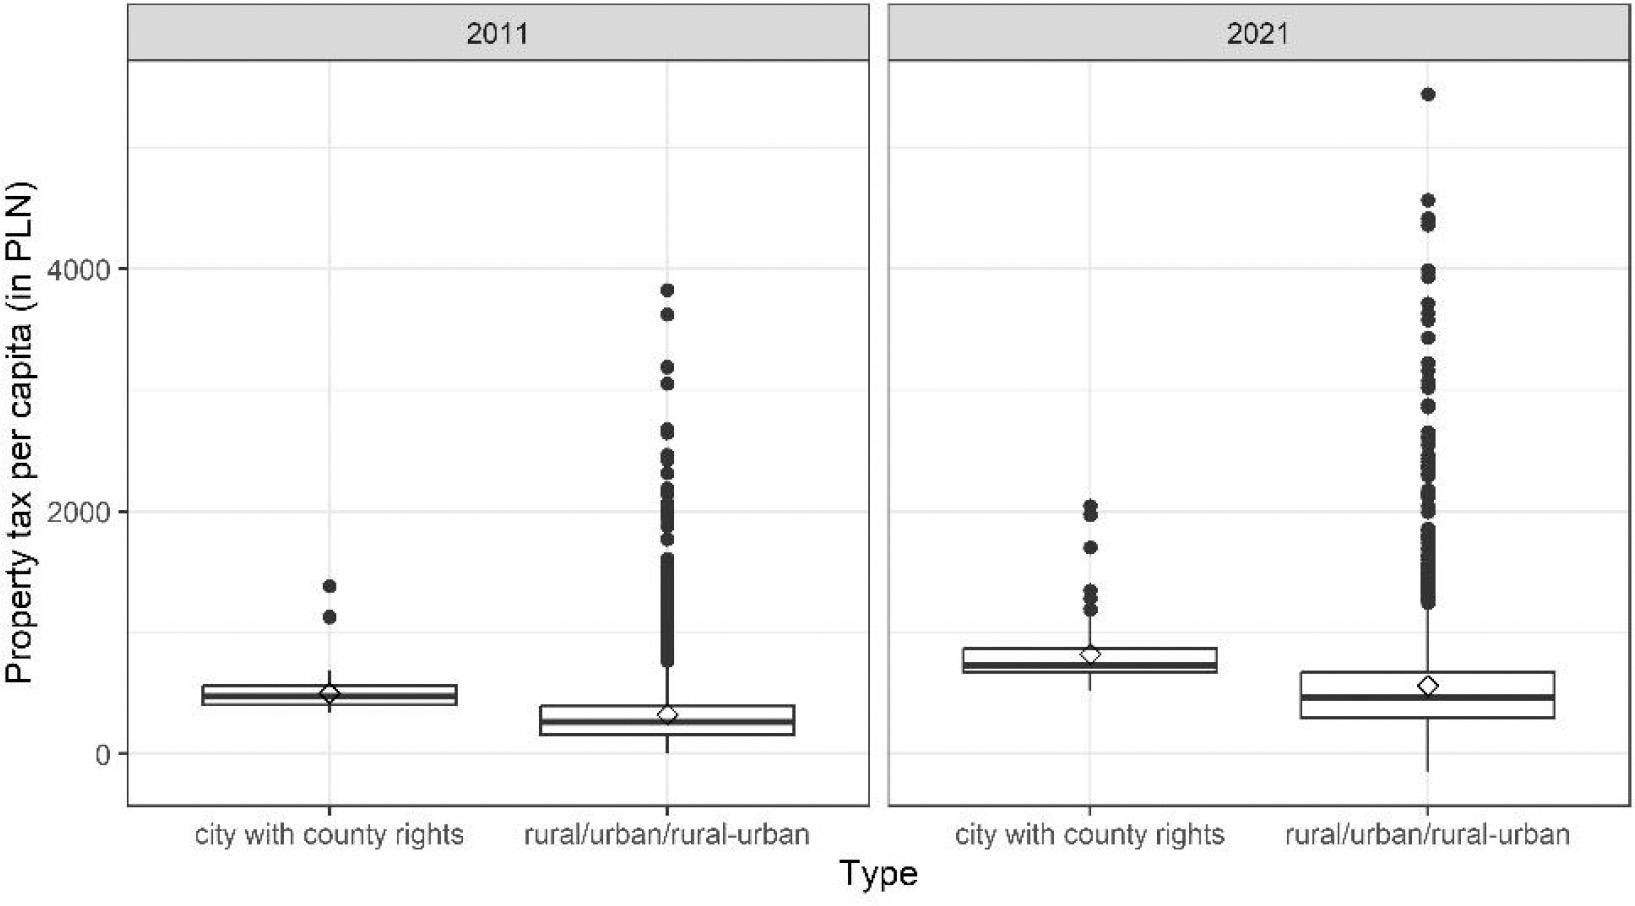
Figure 7.
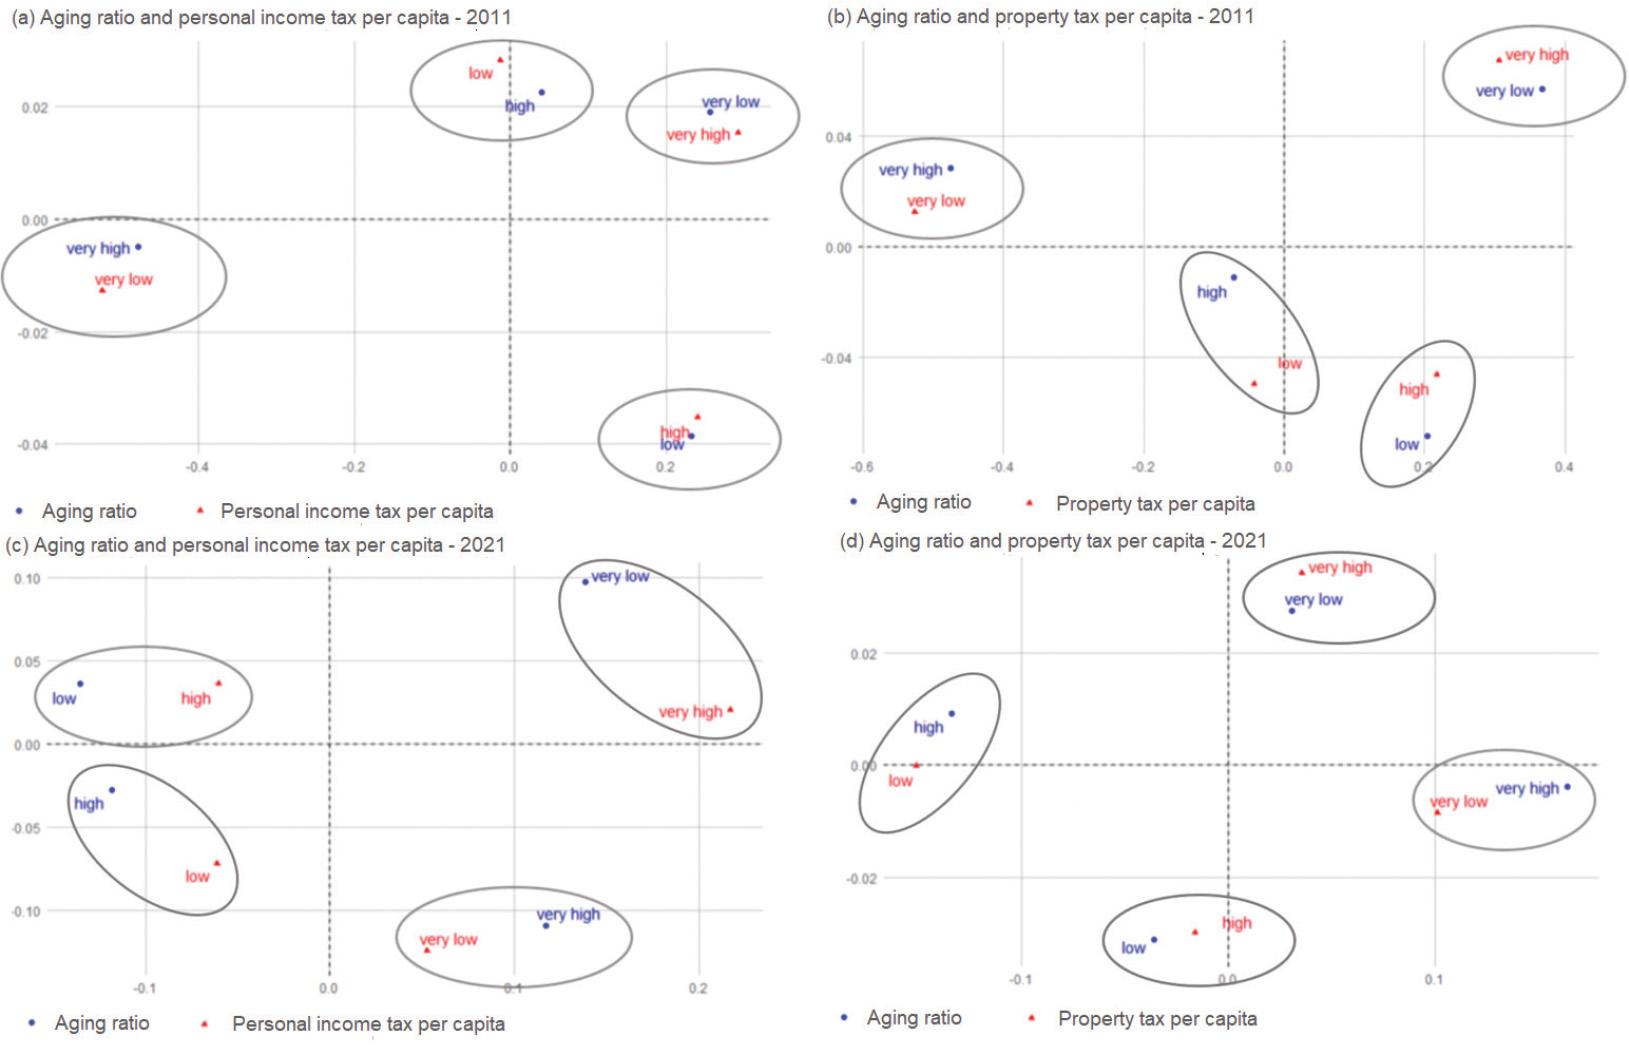
p-values in the chi-square test of independence between aging ratio, PIT per capita, and property tax per capita
| Type of the tax | Aging ratio | |||
|---|---|---|---|---|
| 2011 | 2021 | |||
| City with county rights | Rural/urban/rural–urban | City with county rights | Rural/urban/rural–urban | |
| PIT per capita | 0.211 | 0.000 | 0.437 | 0.000 |
| Property tax per capita | 0.107 | 0.000 | 0.524 | 0.009 |