
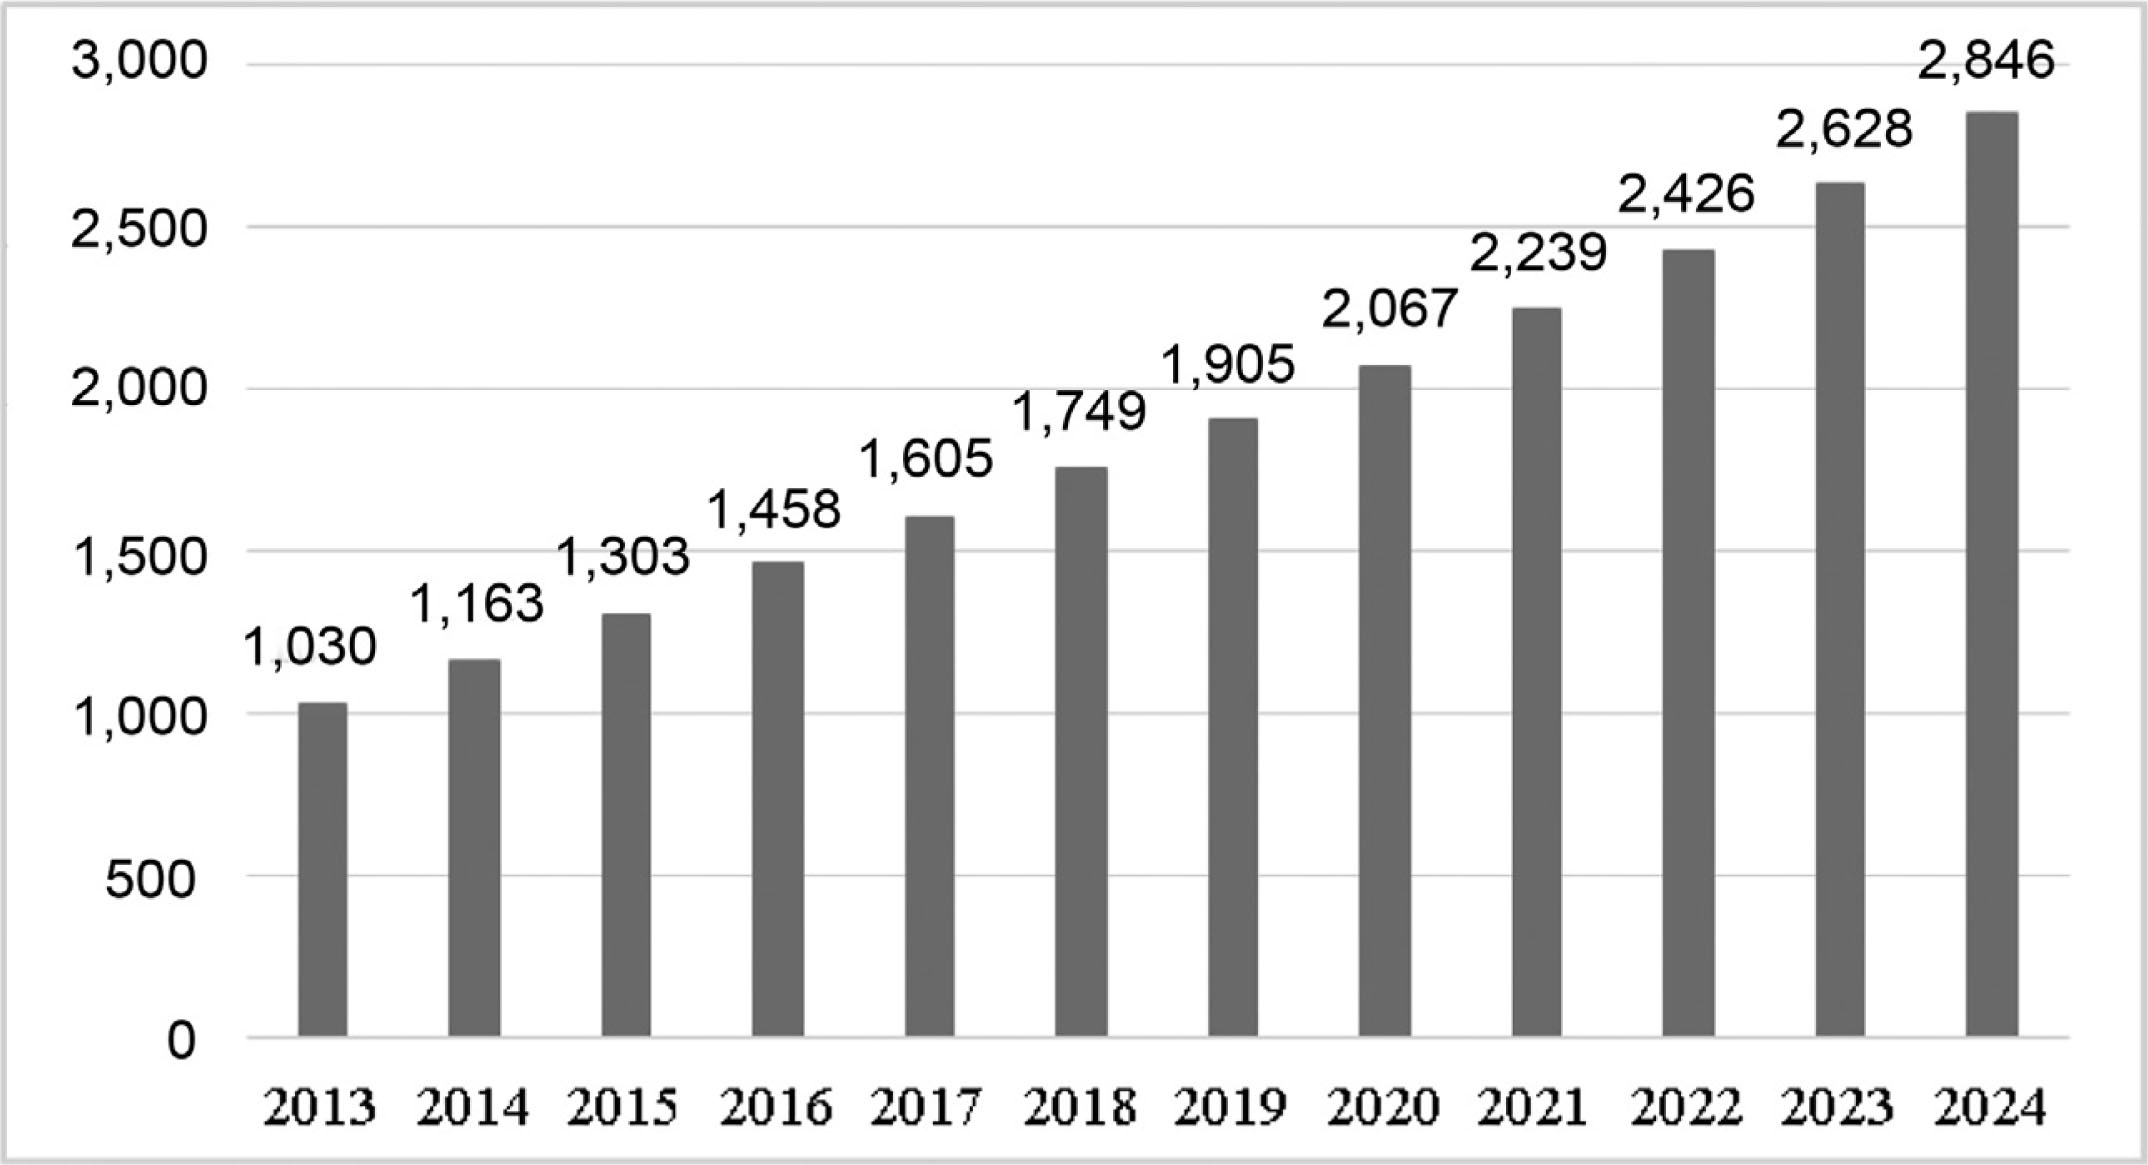
Figure 1
GDP per capita in Bangladesh in 2013–2024 in USD.
Source: Statista, 2020.
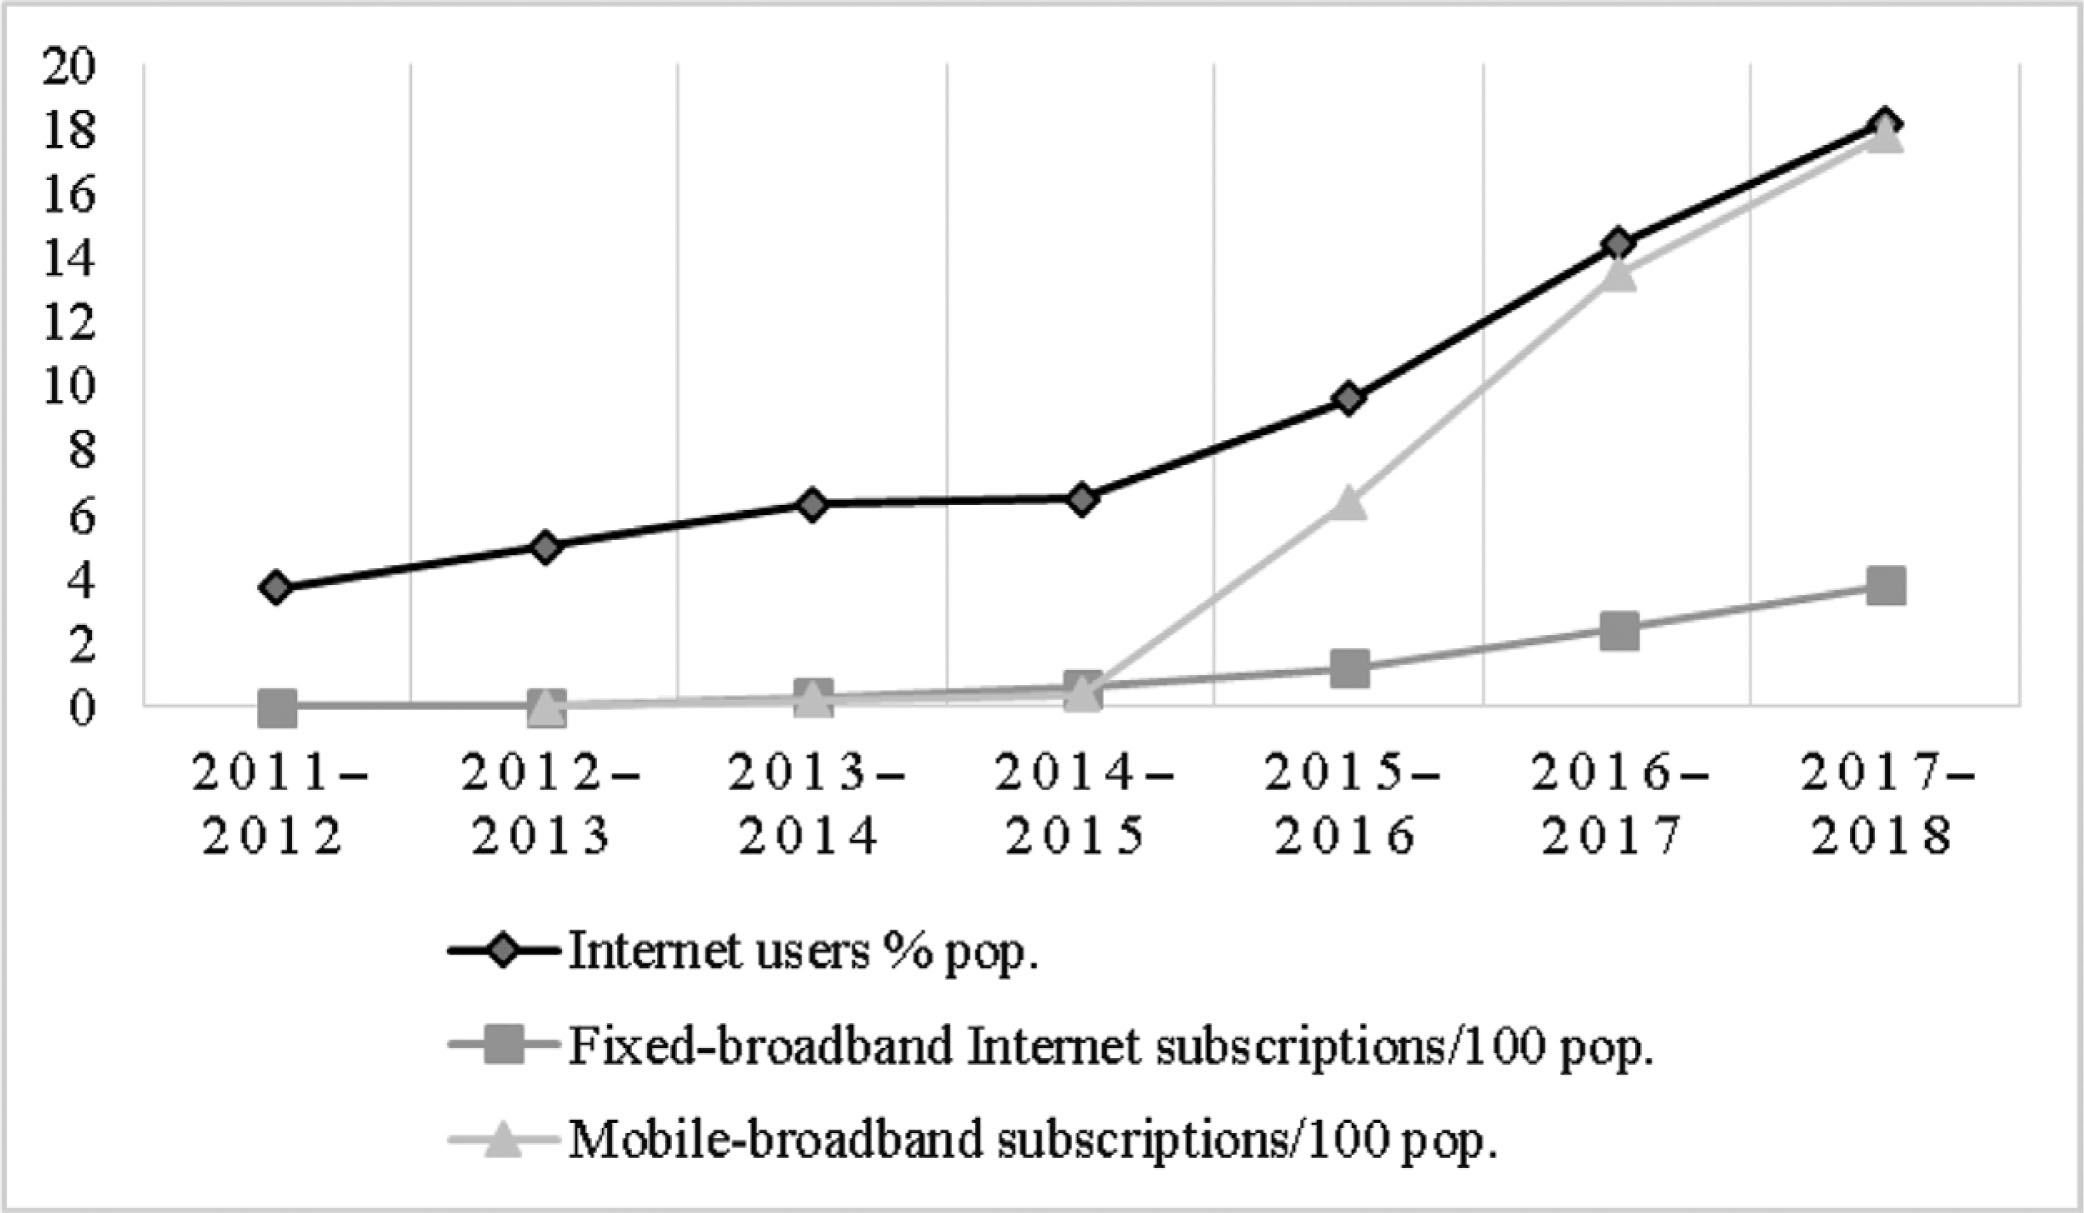
Figure 2
The internet users and subscriptions in Bangladesh in 2011–2018.
Source: World Economic Forum, The Global Competitiveness Reports from 2011–2012 to 2017–2018.
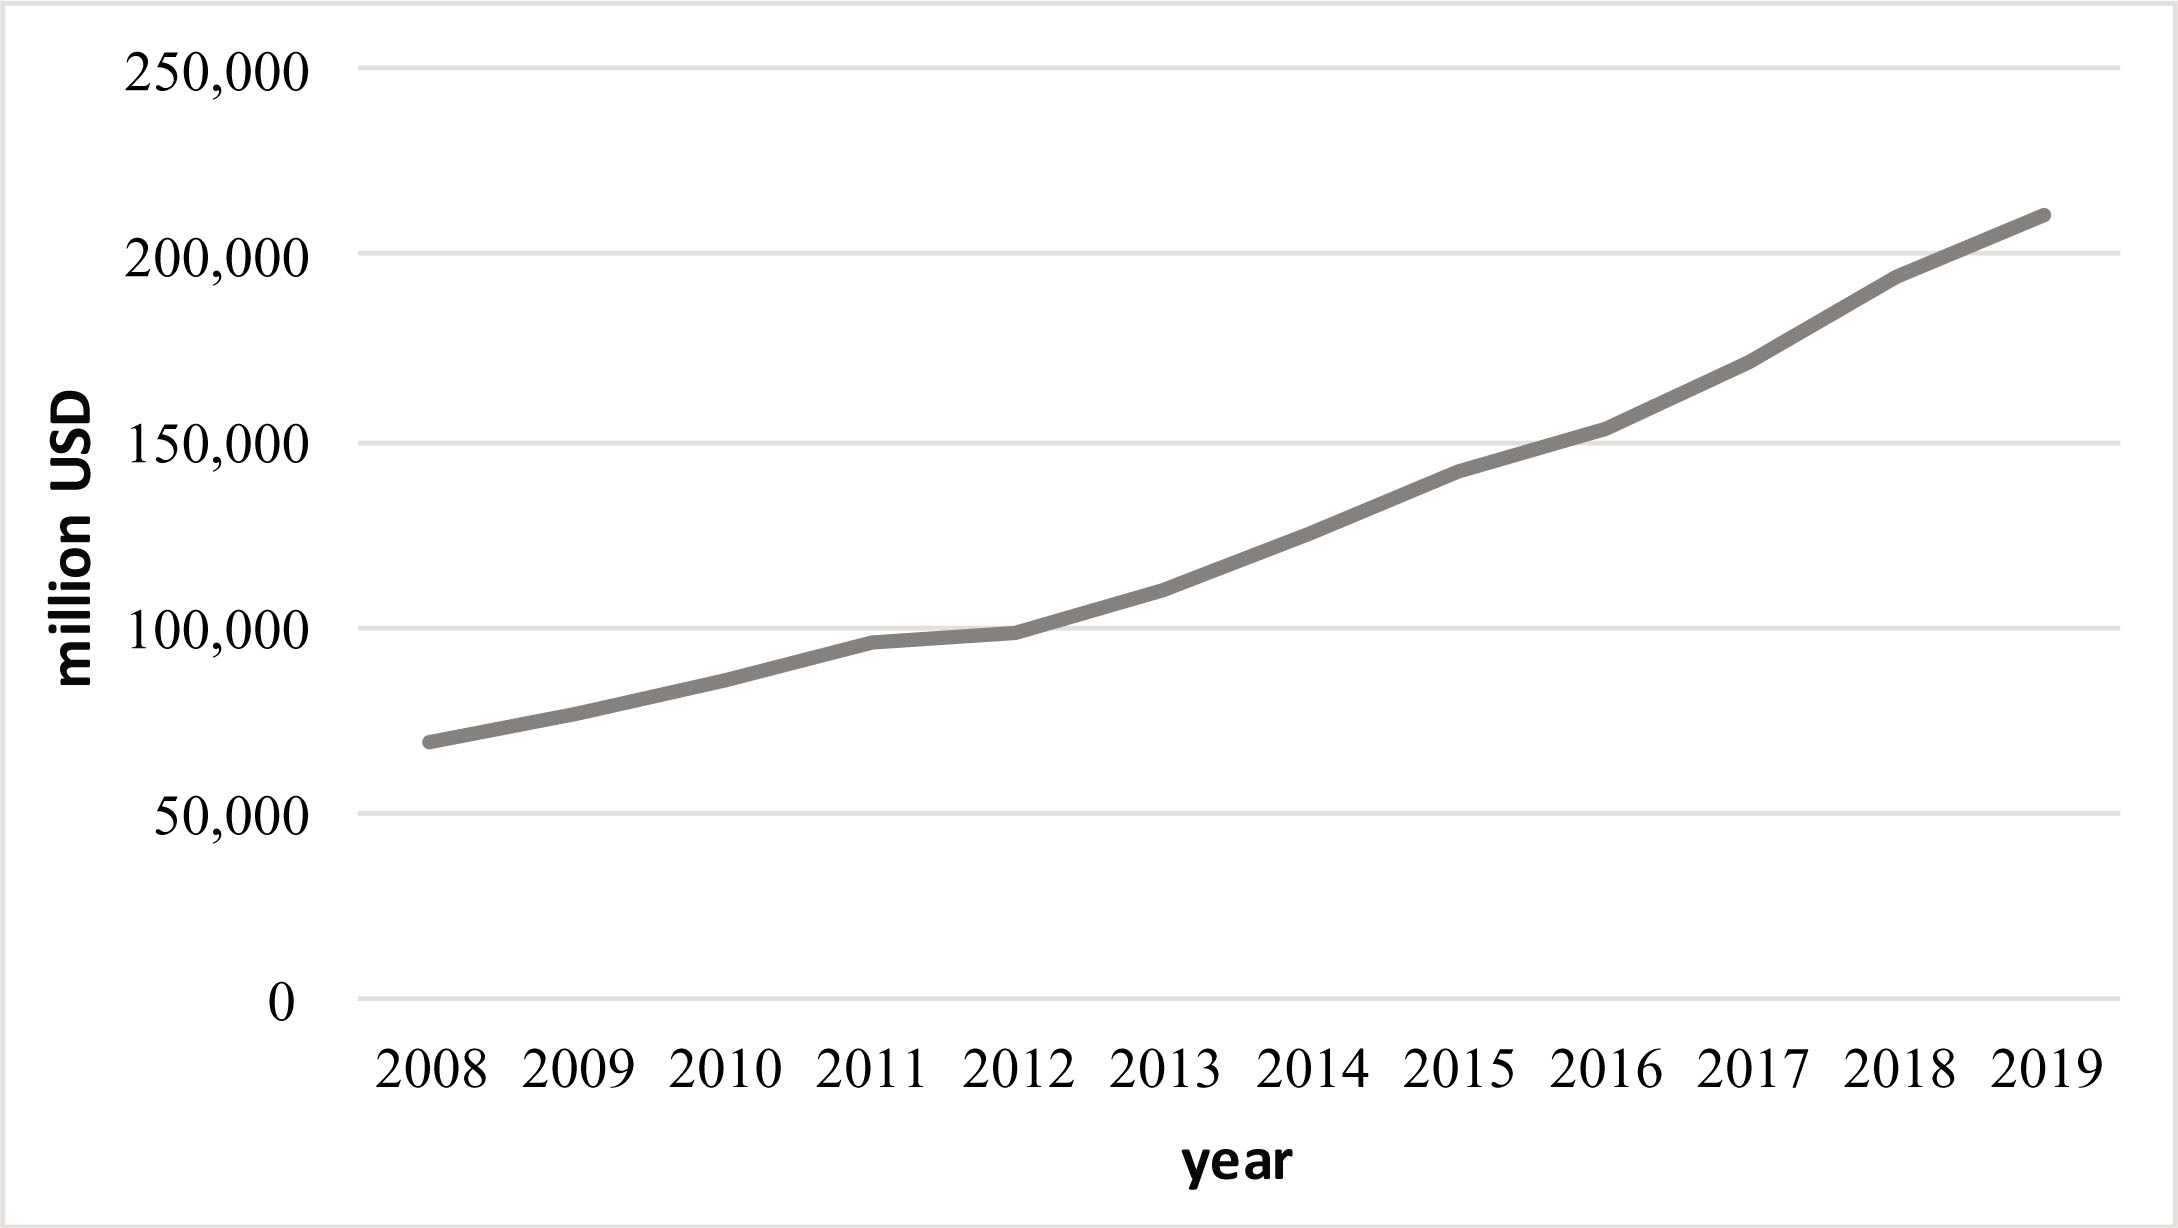
Figure 3
Consumer spending in Bangladesh in 2008–2019.
Source: Bangladesh Bureau of Statistics.
Table 1
Occupation of respondents
| Total (%) | Gender | Age of respondents (years) | |||||
|---|---|---|---|---|---|---|---|
| Males (%) | Females (%) | 18–25 (%) | 26–35 (%) | 36–45 (%) | 46–55 (%) | ||
| Full-time or self-employed | 48.0 | 86.0 | 10.0 | 48.1 | 39.1 | 63.2 | 62.5 |
| Part-time or self-employed | 2.0 | 4.0 | 0.0 | 0.0 | 4.3 | 0.0 | 0.0 |
| Currently without employment | 1.0 | 2.0 | 0.0 | 0.0 | 0.0 | 5.3 | 0.0 |
| Retired (pensioner) | 1.0 | 0.0 | 2.0 | 0.0 | 0.0 | 5.3 | 0.0 |
| Housewife/Househusband | 42.0 | 2.0 | 82.0 | 29.6 | 56.5 | 26.3 | 37.5 |
| Pupils | 6.0 | 6.0 | 6.0 | 22.2 | 0.0 | 0.0 | 0.0 |
[i] Source: own elaboration.
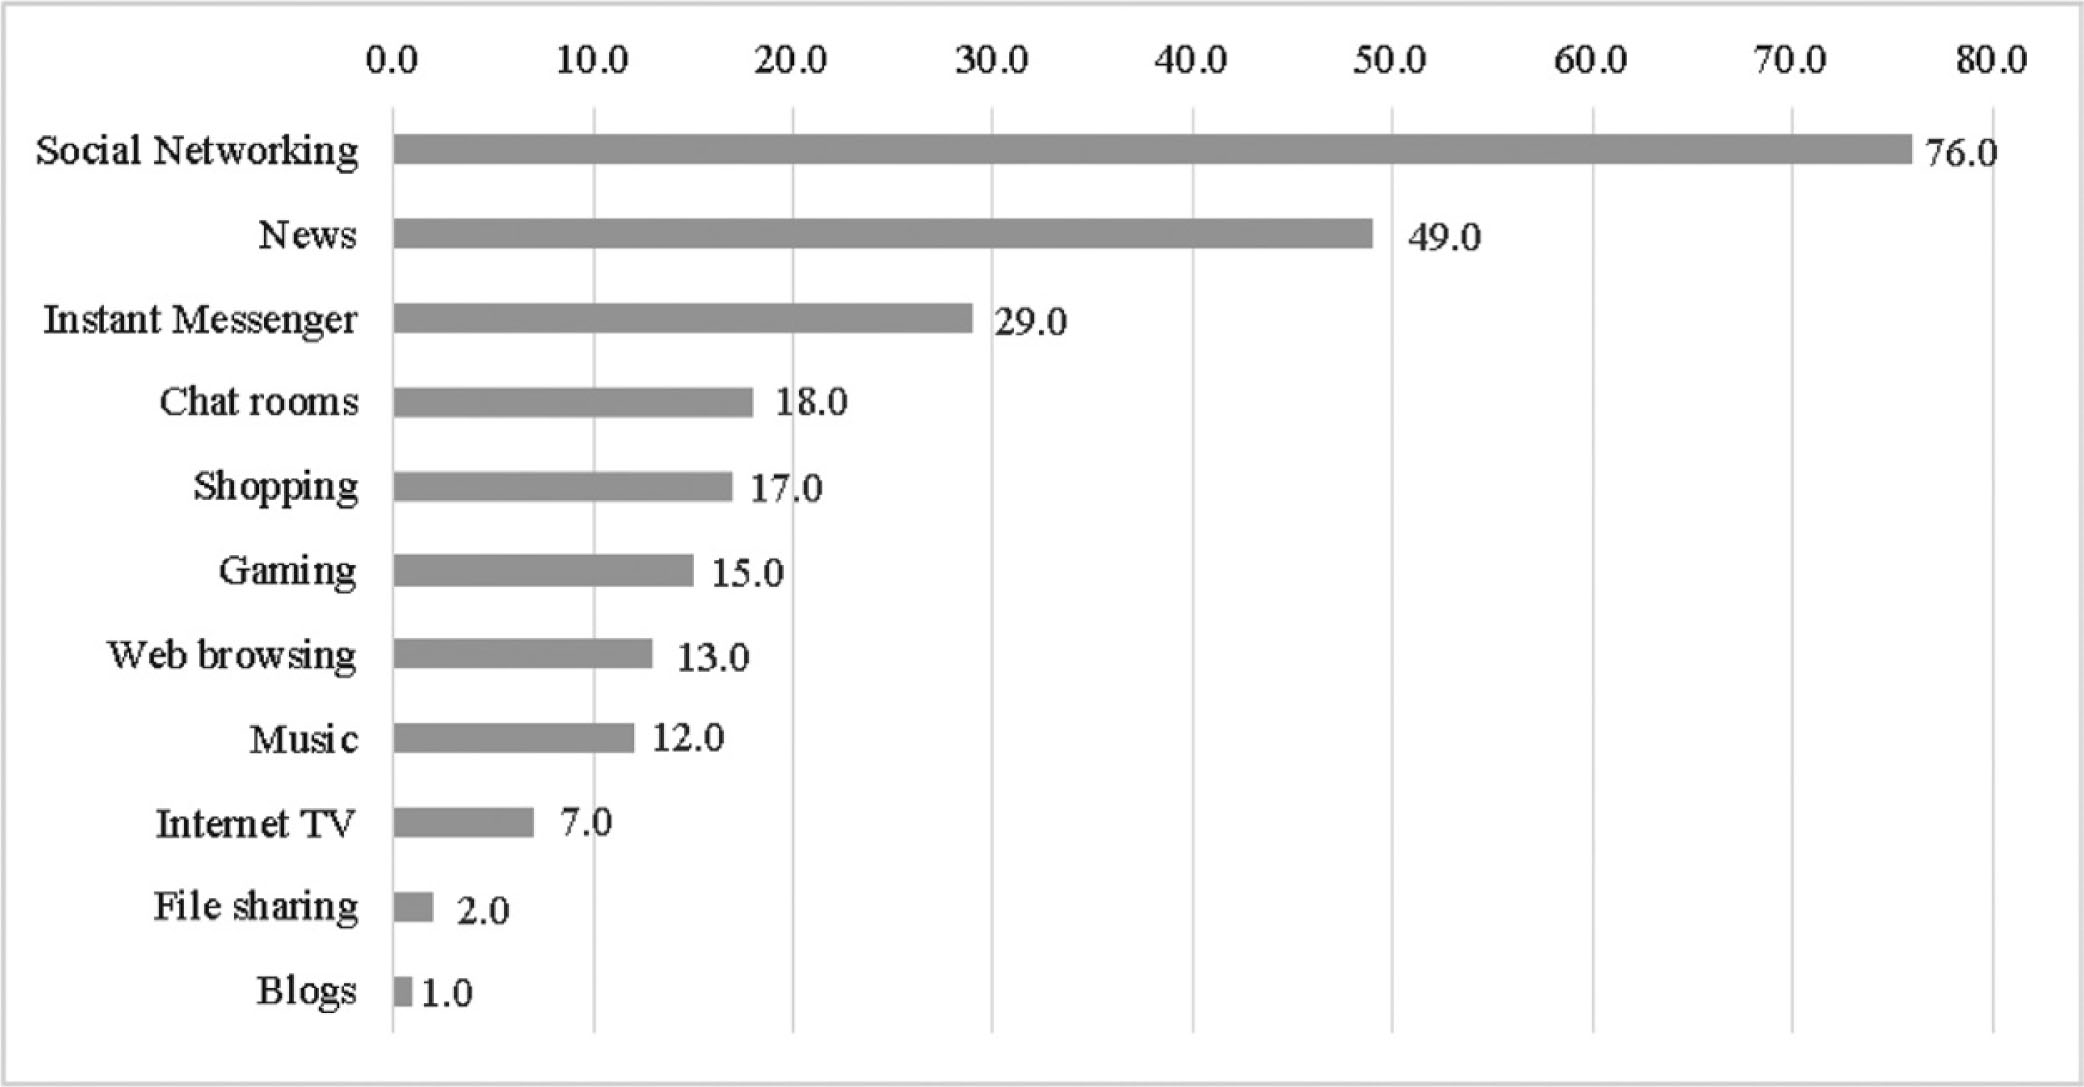
Figure 4
Activities related to the use of the internet by respondents.
Source: own elaboration.
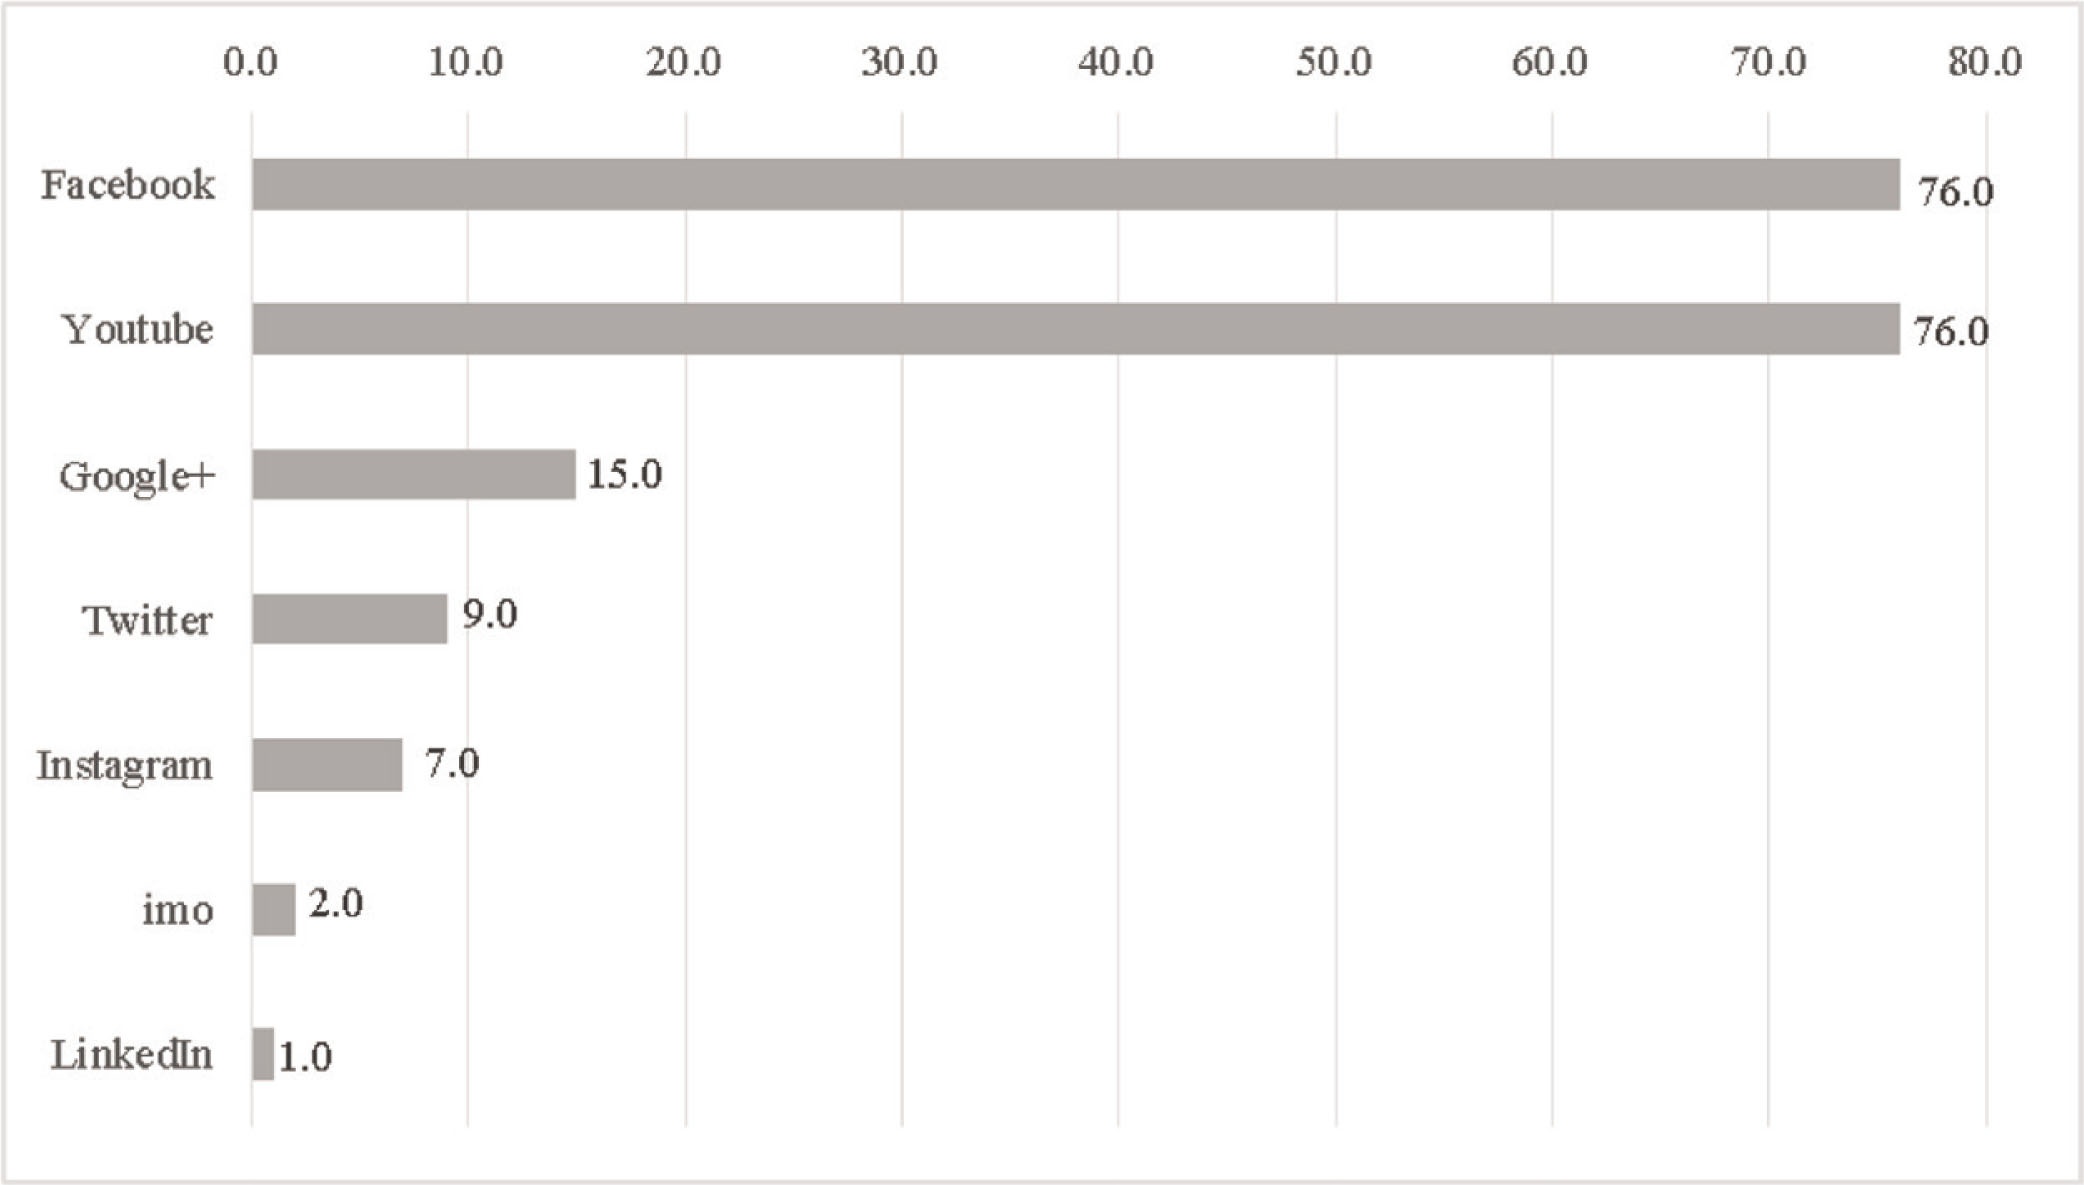
Figure 5
Social media platforms used by respondents.
Source: own elaboration.
Table 2
The importance of social media when respondents look for product information
| Total (%) | Gender | Age of respondents (years) | |||||
|---|---|---|---|---|---|---|---|
| Males (%) | Females (%) | 18–25 (%) | 26–35 (%) | 36–45 (%) | 46–55 (%) | ||
| Not important to me at all | 2.0 | 0.0 | 4.0 | 0.0 | 4.3 | 0.0 | 0.0 |
| Rather not important to me | 1.0 | 0.0 | 2.0 | 0.0 | 2.2 | 0.0 | 0.0 |
| Neither important nor not important | 14.0 | 10.0 | 18.0 | 11.1 | 13.0 | 21.1 | 12.5 |
| Important to me | 35.0 | 36.0 | 34.0 | 40.7 | 37.0 | 26.3 | 25.0 |
| Very important to me | 48.0 | 54.0 | 42.0 | 48.1 | 43.5 | 52.6 | 62.5 |
| TOP BOX [05] | 48.0 | 54.0 | 42.0 | 48.1 | 43.5 | 52.6 | 62.5 |
| TOP 2 BOX [05/04] | 83.0 | 90.0 | 76.0 | 88.9 | 80.4 | 78.9 | 87.5 |
[i] Source: own elaboration.
Table 3
The importance of social media when respondents look for product information—significance level gender
| Sum of squares | df | Mean square | F | Sig. | |
|---|---|---|---|---|---|
| Between groups | 3.240 | 1 | 3.240 | 4.291 | 0.041 |
| Within groups | 74.000 | 98 | 0.755 | ||
| Total | 77.240 | 99 |
[i] Source: own elaboration.
Table 4
The importance of social media when respondents look for product information—significance level age
| Sum of squares | df | Mean square | F | Sig. | |
|---|---|---|---|---|---|
| Between groups | 1.621 | 3 | .540 | .686 | .563 |
| Within groups | 75.619 | 96 | .788 | ||
| Total | 77.240 | 99 |
[i] Source: own elaboration.
Table 5
The impact of social media on respondents’ decisions to buy FMCG
| Total (%) | Gender | Age of respondents (years) | |||||
|---|---|---|---|---|---|---|---|
| Males (%) | Females | 18–25 (%) | 26–35 (%) | 36–45 (%) | 46–55 (%) | ||
| Does not influence strongly at all | 3.0 | 0.0 | 6.0 | 3.7 | 4.3 | 0.0 | 0.0 |
| Rather does not influence strongly | 5.0 | 4.0 | 6.0 | 0.0 | 8.7 | 5.3 | 0.0 |
| Neither influence strongly or not strongly | 19.0 | 16.0 | 22.0 | 7.4 | 15.2 | 31.6 | 50.0 |
| Influences strongly | 35.0 | 36.0 | 34.0 | 51.9 | 37.0 | 21.1 | 0.0 |
| Influences very strongly | 38.0 | 44.0 | 32.0 | 37.0 | 34.8 | 42.1 | 50.0 |
| TOP BOX [05] | 38.0 | 44.0 | 32.0 | 37.0 | 34.8 | 42.1 | 50.0 |
| TOP 2 BOX [05/04] | 73.0 | 80.0 | 66.0 | 88.9 | 71.7 | 63.2 | 50.0 |
[i] Source: own elaboration.