
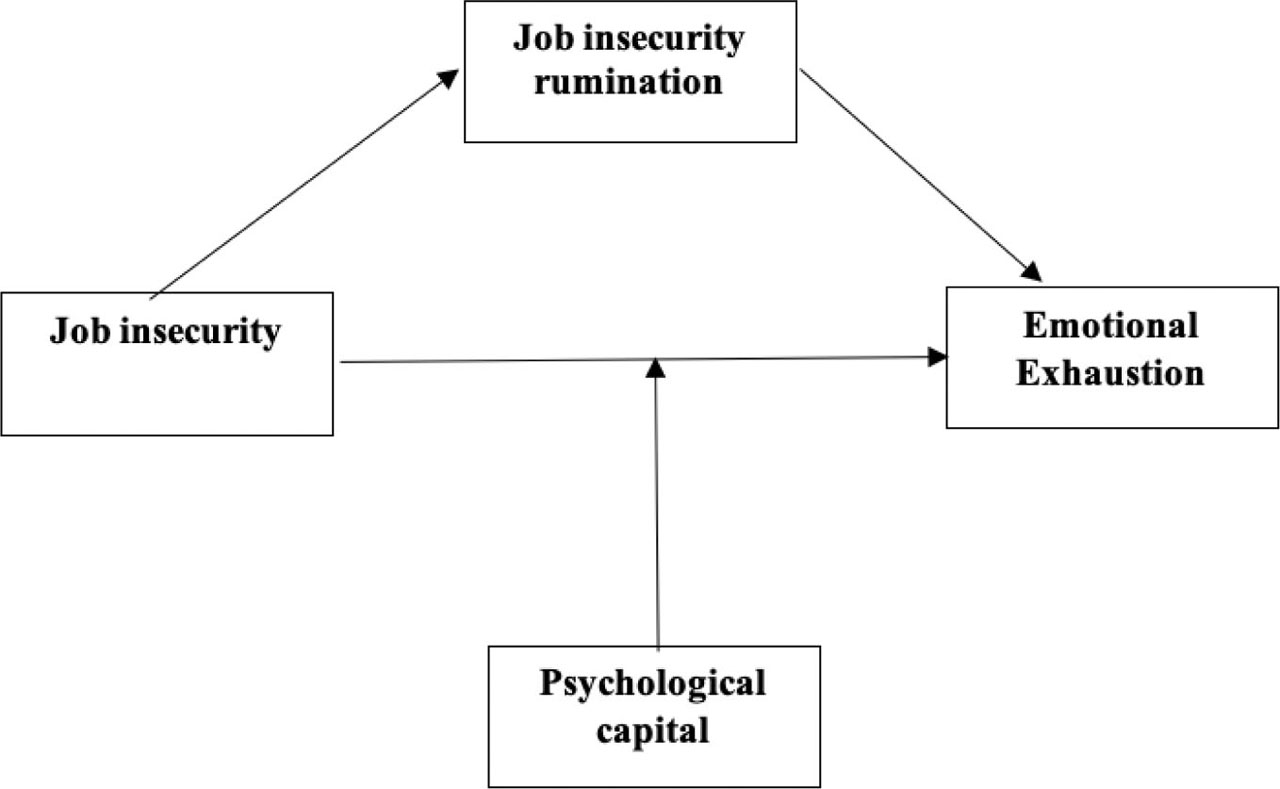
Figure 1
Proposed conceptual model
Table 1
Descriptive statistics, correlations, and scale reliabilities for study variables
| Mean | SD | 1 | 2 | 3 | 4 | 5 | 6 | 7 | 8 | ||
|---|---|---|---|---|---|---|---|---|---|---|---|
| 1 | Gender | − | |||||||||
| 2 | Age | 0.29 | − | ||||||||
| 3 | Tenure | .065 | .410** | − | |||||||
| 4 | Contract | −.031 | −.124* | −.173** | − | ||||||
| 5 | JI | 2.79 | 1.23 | −.018 | −.113* | −.170** | .191* | (.94) | |||
| 6 | JI Rum | 2.09 | 1.06 | −.051 | −.150** | −.176** | .110 | .687** | (.86) | ||
| 7 | PsyCap | 4.38 | .810 | −.016 | .256** | .131* | −.153** | −.256** | −.277** | (.89) | |
| 8 | EE | 3.59 | 1.57 | −.002 | −.115* | −.035 | .026 | .381** | .413** | −.315** | (.94) |
Note. n = 300. Cronbach alpha values for each scale are reported on the diagonal in italics. JI = Job insecurity; JI Rum = Job insecurity rumination; PsyCap = Psychological capital; EE = Emotional exhaustion. Gender (Male = 1); Age (31–44 years = 1); Tenure (< 5 years = 1); Contract (Permanent = 1).
Table 2
Regression results for mediation
| B | SE | t | P | |
|---|---|---|---|---|
| JI →Emotional exhaustion | .498 | 0.69 | 7.25 | .000 |
| JI → JI rumination | .680 | 0.31 | 21.94 | .000 |
| JI → emotional exhaustion | .443 | .472 | 3.25 | .001 |
| Indirect effect of JI → emotional exhaustion, controlling for JI rumination | .216 | .108 | 1.96 | .060 |
| Bootstrap results for indirect effect | ||||
|---|---|---|---|---|
| Value | Bootstrap SE | LL 95% CI | UL 95% CI | |
| Effect | .2820 | .0884 | .1079 | .4579 |
[i] Note: Unstandardized regression coefficients. Bootstrap sample size – 5000. LL – lower limit, CI = Confidence interval, UL = upper limit. JI = Job insecurity; JI rumination = Job insecurity rumination.
Table 3
Regression Results for conditional indirect effects
| Dependent variable: Emotional Exhaustion | ||||||
|---|---|---|---|---|---|---|
| B | SE | t | p | LLCI | ULCI | |
| JI | .193 | .392 | .4910 | .623 | −.5799 | .965 |
| PsyCap | −.595 | .269 | −2.210 | .027 | −1.124 | −.065 |
| JI x PsyCap | .052 | .087 | .593 | .553 | −.1202 | .224 |
[i] Note: CI = confidence interval; LL = Lower limit; UL = Upper limit. Bootstrap sample = 5000. JI = job insecurity; PsyCap = psychological capital.