

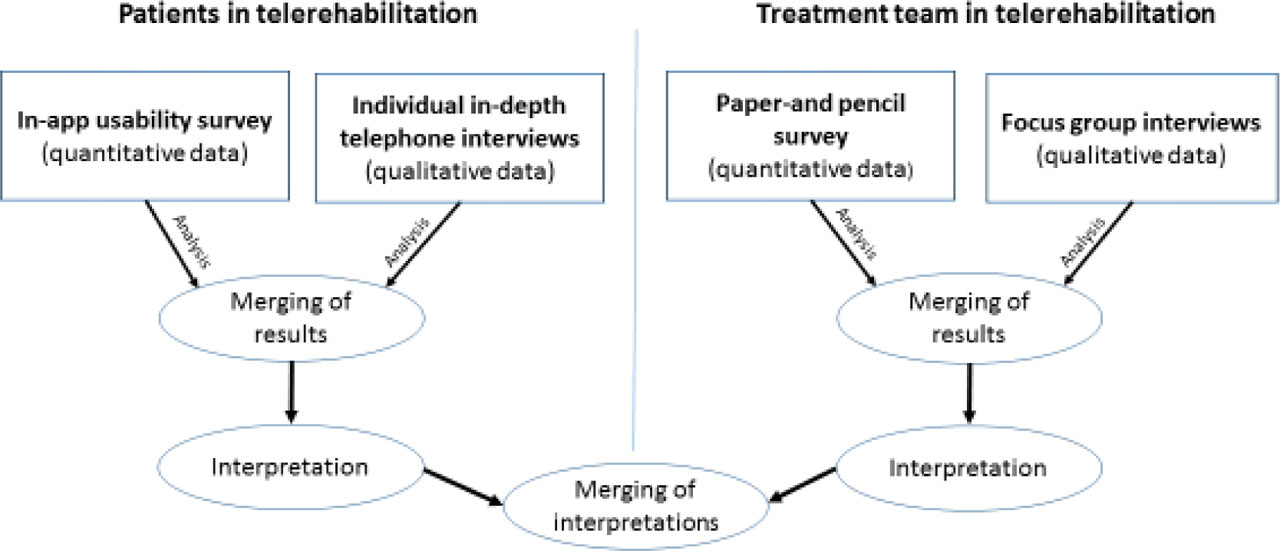
Figure 1:
Convergent mixed-methods design (Creswell & Plano Clark, 2017).
Table 1:
Patients’ characteristics.
| Characteristics | Category | n (%) |
|---|---|---|
| Sex | ||
| Female | 55 (64) | |
| Male | 31 (36) | |
| Total | 86 (100) | |
| Indication | ||
| Musculoskeletal diseases | 67 (78) | |
| Oncological diseases | 19 (22) | |
| Total | 86 (100) | |
| Highest educational level | ||
| Compulsory school | 4 (5) | |
| Apprenticeship | 20 (24) | |
| Vocational middle school | 13 (15) | |
| University entrance qualification | 18 (21) | |
| University degree | 26 (31) | |
| Other qualification after university entrance qualification | 4 (5) | |
| Total | 85 (100) | |
| Employment situation | ||
| White-collar | 67 (79) | |
| Blue-collar | 12 (14) | |
| Currently not employed | 3 (4) | |
| Receiving social benefits | 3 (4) | |
| Total | 85 (100) |
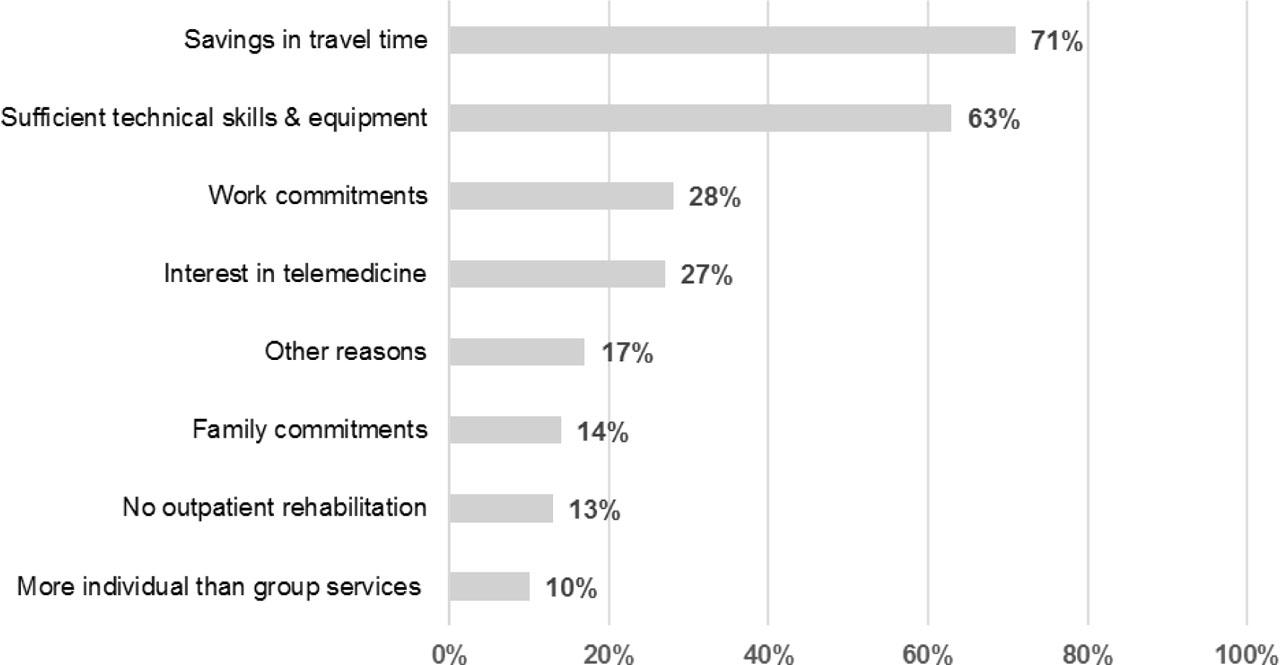
Figure 2:
Patients’ individual motives for participating in telerehabilitation (multiple responses possible, n = 86).
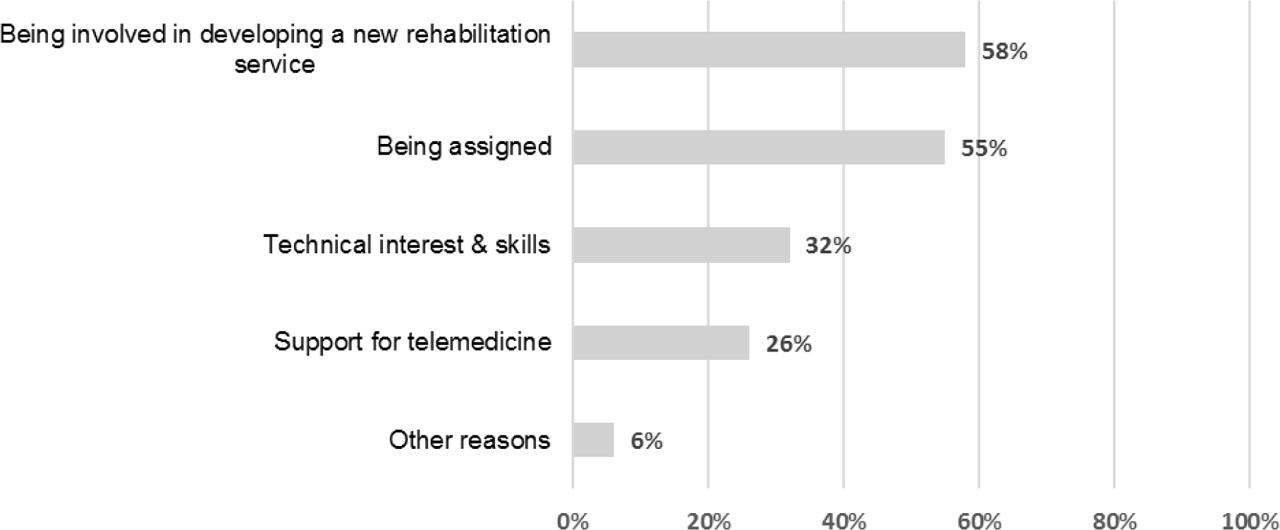
Figure 3:
Treatment team’s individual motives for participating in telerehabilitation (multiple responses possible, n = 31).
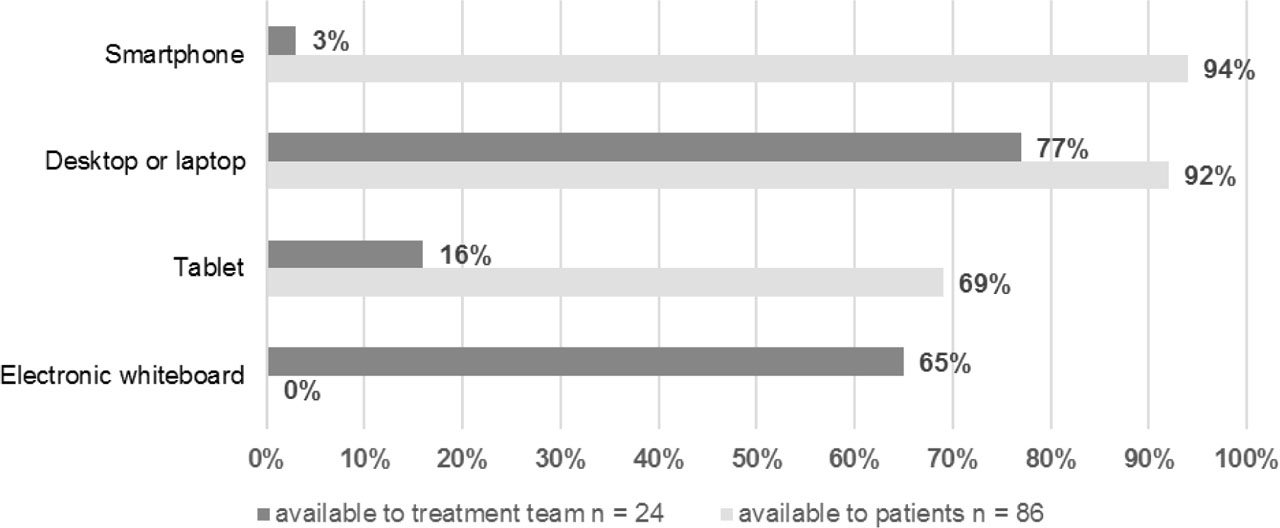
Figure 4:
Technical infrastructure available for telerehabilitation (multiple responses possible).
Table 2:
Comparison of the treatment team’s and patients’ views on the use of telerehabilitation.
| Agreement | Response, n (%) | |||||
|---|---|---|---|---|---|---|
| Agree | Partly agree | Neither | Partly disagree | Disagree | Total | |
| Ability to quickly learn how to use the telerehabilitation system | ||||||
| Patients | 74 (86) | 9 (10) | 2 (2) | 1 (1) | 0 (0) | 86 (100) |
| Treatment team | 12 (39) | 14 (45) | 5 (16) | 0 (0) | 0 (0) | 31 (100) |
| Information exchange was comprehensible | ||||||
| Patients | 68 (79) | 16 (19) | 1 (1) | 1 (1) | 0 (0) | 86 (100) |
| Treatment team | 3 (9) | 16 (50) | 8 (25) | 4 (13) | 1 (3) | 32 (100) |
| Therapeutic contents were adequately conveyed | ||||||
| Patients | 68 (79) | 17 (20) | 1 (1) | 0 (0) | 0 (0) | 86 (100) |
| Treatment team | 4 (13) | 11 (35) | 12 (39) | 4 (13) | 0 (0) | 31 (100) |
| Amount of time spent on telerehabilitation was appropriate | ||||||
| Patients | 41 (48) | 29 (34) | 11 (13) | 4 (5) | 1 (1) | 86 (100) |
| Time for conducting telerehabilitation was comparable to face-to-face sessions | ||||||
| Treatment team | 3 (10) | 4 (13) | 5 (16) | 11 (35) | 8 (26) | 31 (100) |
Table 3:
The treatment team’s assessment of the feasibility and comprehensibility of different session formats.
| Rating | Response, n (%) | |||||
|---|---|---|---|---|---|---|
| Very good | Good | Neither | Bad | Very bad | Total | |
| Feasibility and comprehensibility of different session formats assessed by the treatment team | ||||||
| Patient education seminars | 13 (59) | 6 (27) | 2 (9) | 1 (5) | 0 (0) | 23 (100) |
| Individual therapy and counseling | 10 (36) | 9 (32) | 4 (14) | 5 (18) | 0 (0) | 28 (100) |
| Group training sessions | 5 (20) | 6 (24) | 13 (52) | 1 (4) | 0 (0) | 25 (100) |