
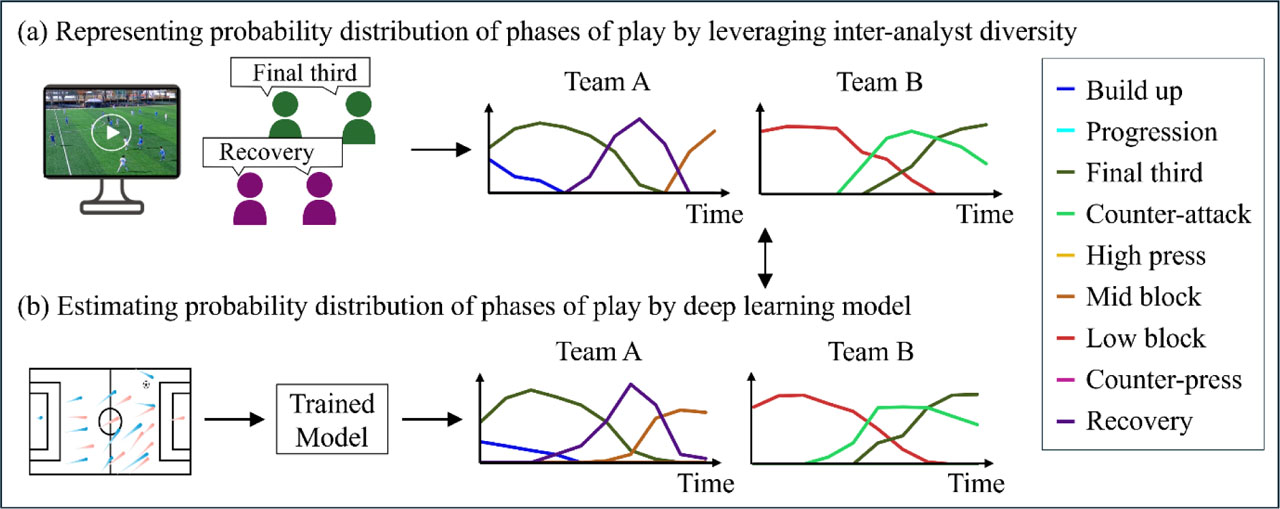
Figure 1:
Overview of this study. This study proposes a method to estimate the probability distribution of FIFA-defined phases of play. First, as depicted in (a), we represent the probability distribution of play phases by leveraging inter-analyst diversity. Subsequently, as shown in (b), this represented probability distribution serves as the ground truth for training a deep learning model to estimate the probability distribution of phases.
Table 1:
Symbols of play phases. In this study, we target the 9 main “phases of play” defined by FIFA for estimation and assign a symbol to each phase.
| Play phases | Symbols |
|---|---|
| Build up | p1 |
| Progression | p2 |
| Final third | p3 |
| Counter-attack | p4 |
| High press | p5 |
| Mid block | p6 |
| Low block | p7 |
| Counter-press | p8 |
| Recovery | p9 |
Table 2:
Semantic distances between the four phases.
| Offensive | Transition to Offense | Defensive | Transition to Defense | No label | |
|---|---|---|---|---|---|
| Offensive | 0.25 | 0.50 | 1.00 | 1.00 | 0.25 |
| Transition to Offense | 0.50 | 0.25 | 1.00 | 1.00 | 0.25 |
| Defensive | 1.00 | 1.00 | 0.25 | 0.50 | 0.25 |
| Transition to Defense | 1.00 | 1.00 | 0.50 | 0.25 | 0.25 |
| No label | 0.25 | 0.25 | 0.25 | 0.25 | 0.00 |
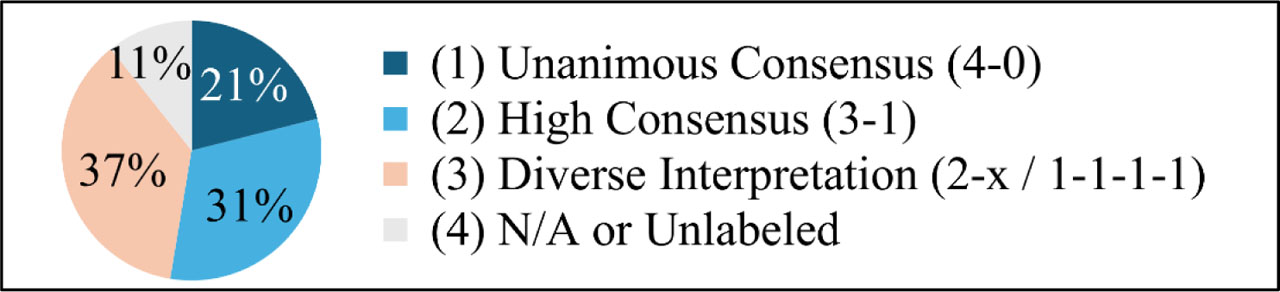
Figure 2:
Global proportion of annotation patterns. The patterns are classified based on the level of consensus relative to the total match duration to provide an overview of dataset diversity without temporal overlaps.
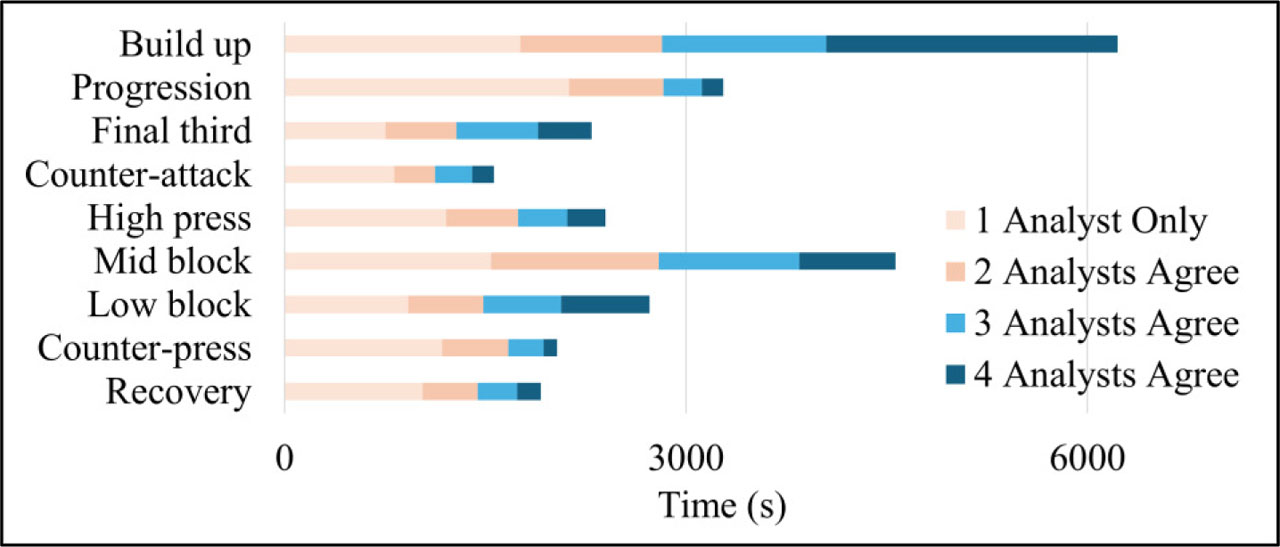
Figure 3:
Distribution of consensus levels across play phases. The vertical axis lists the play phases, and the horizontal axis shows the total annotated time in seconds. The legend classifies the duration based on the number of analysts in agreement.
Table 3:
Aggregated pairwise confusion matrix across all four analysts. Each cell (i, j) represents the frequency with which an analyst assigned phase pj while another analyst assigned phase pi to the same frame, normalized by the total number of pairwise comparisons.
| Build up | Progression | Final third | Counter-attack | High press | Mid block | Low block | Counter-press | Recovery | No label | |
|---|---|---|---|---|---|---|---|---|---|---|
| Build up | 0.71 | 0.10 | 0.03 | 0.01 | 0.01 | 0.01 | 0.01 | 0.02 | 0.01 | 0.09 |
| Progression | 0.39 | 0.32 | 0.08 | 0.04 | 0.01 | 0.01 | 0.01 | 0.03 | 0.01 | 0.11 |
| Final third | 0.06 | 0.11 | 0.66 | 0.06 | 0.00 | 0.01 | 0.00 | 0.04 | 0.01 | 0.06 |
| Counter-attack | 0.05 | 0.09 | 0.11 | 0.45 | 0.03 | 0.04 | 0.06 | 0.04 | 0.01 | 0.11 |
| High press | 0.02 | 0.01 | 0.00 | 0.02 | 0.53 | 0.20 | 0.04 | 0.05 | 0.04 | 0.08 |
| Mid block | 0.02 | 0.01 | 0.00 | 0.01 | 0.10 | 0.58 | 0.11 | 0.02 | 0.04 | 0.11 |
| Low block | 0.02 | 0.00 | 0.00 | 0.02 | 0.01 | 0.07 | 0.70 | 0.02 | 0.09 | 0.07 |
| Counter-press | 0.08 | 0.05 | 0.07 | 0.02 | 0.11 | 0.04 | 0.04 | 0.36 | 0.12 | 0.12 |
| Recovery | 0.04 | 0.01 | 0.02 | 0.01 | 0.04 | 0.08 | 0.12 | 0.08 | 0.48 | 0.12 |
| No label | 0.10 | 0.04 | 0.04 | 0.02 | 0.04 | 0.06 | 0.05 | 0.05 | 0.03 | 0.59 |
Table 4:
Model performance evaluation.
| Model | MAE | RMSE | Top-1 Acc (%) | Top-3 Acc (%) |
|---|---|---|---|---|
| Mean Prediction | 0.14 | 0.21 | 11 | 33 |
| MLP | 0.08 | 0.20 | 22 | 49 |
| Transformer | 0.08 | 0.21 | 22 | 51 |
| baller2vec | 0.06 | 0.16 | 48 | 68 |
| GCN+Transformer | 0.07 | 0.18 | 39 | 71 |
| GAT+Transformer | 0.06 | 0.16 | 49 | 80 |
Table 5:
Estimation performance per play phase for the GAT+Transformer model.
| Phase | MAE | RMSE | Top-1 Acc (%) | Top-3 Acc (%) |
|---|---|---|---|---|
| Build up | 0.11 | 0.21 | 91 | 98 |
| Progression | 0.06 | 0.13 | 21 | 95 |
| Final third | 0.05 | 0.14 | 77 | 96 |
| Counter-attack | 0.05 | 0.18 | 0 | 25 |
| High press | 0.05 | 0.15 | 57 | 99 |
| Mid block | 0.09 | 0.19 | 94 | 100 |
| Low block | 0.05 | 0.14 | 88 | 96 |
| Counter-press | 0.04 | 0.14 | 0 | 30 |
| Recovery | 0.05 | 0.17 | 12 | 78 |
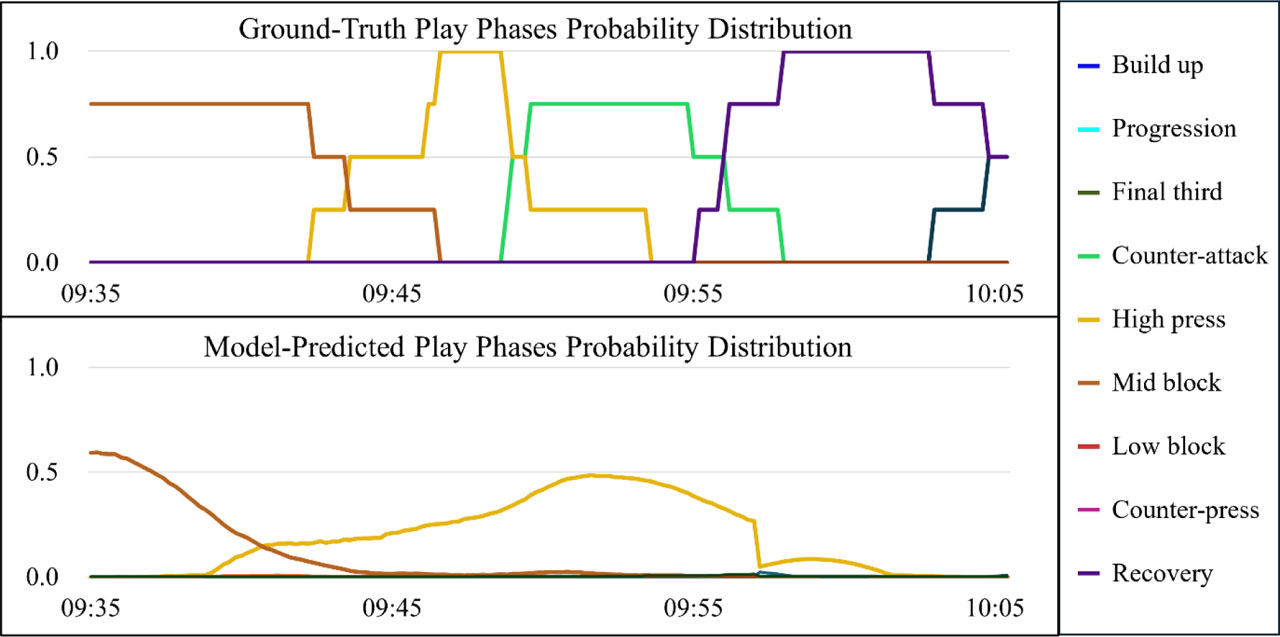
Figure 4:
Qualitative comparison of the probability distribution of play phases for a sample sequence. The upper graph shows the ground-truth distribution, aggregated from inter-analyst diversity. The lower graph shows the corresponding probability distribution predicted by the trained model.
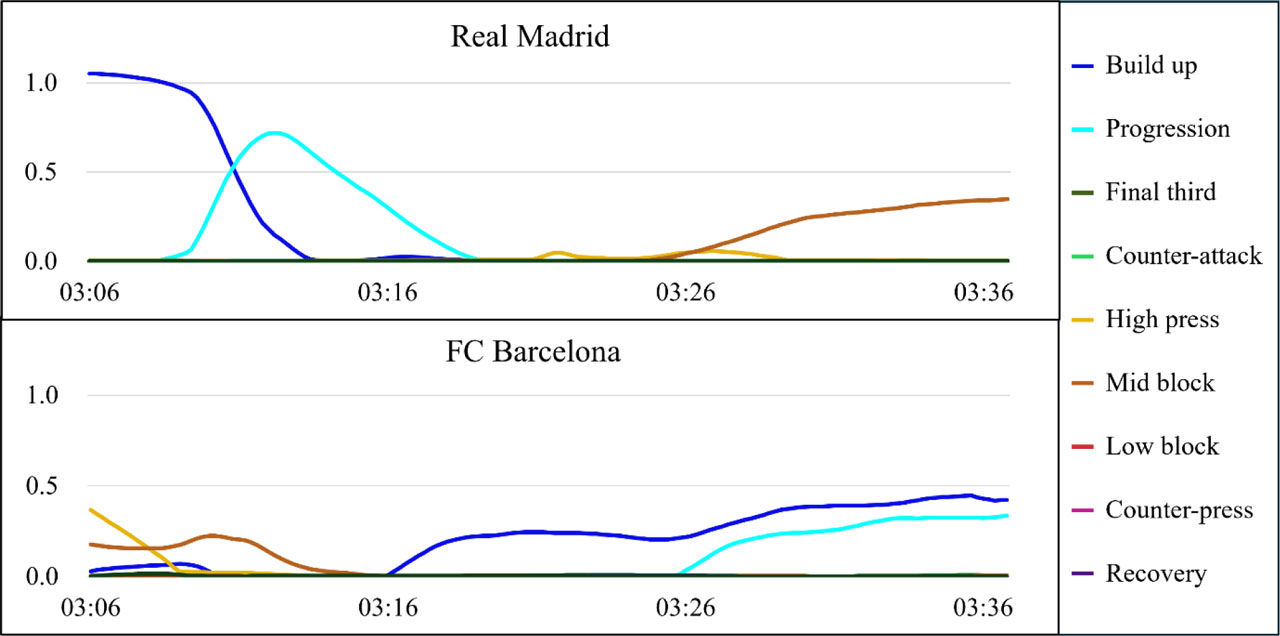
Figure 5:
Qualitative evaluation using a La Liga match. The upper graph shows the probability distribution of play phases for Real Madrid, while the lower graph shows the same for FC Barcelona.
Table 6:
Performance comparison between models trained with continuous probabilistic labels and discrete deterministic labels.
| Label | MAE | RMSE | Top-1 Acc (%) |
|---|---|---|---|
| Probabi1istic Labe1s | 0.06 | 0.16 | 49 |
| Deterministic Labe1s | 0.08 | 0.21 | 28 |
Table 7:
Performance comparison between models trained with single-team labels and dual-team labels.
| Label | MAE | RMSE | Top-1 Acc (%) |
|---|---|---|---|
| Single-Team Learning | 0.06 | 0.16 | 49 |
| Dual-Team Learning | 0.12 | 0.24 | 13 |
Table A1:
Definitions of FIFA “phases of play” used for annotation.
| Play phases | Definition |
|---|---|
| Build up | This is how teams initiate their attacking play, performing a combination of short passes between team-mates, mostly from side to side, with the aim of progressing the ball forward through the thirds and up the pitch. Typically, build up is associated with playing out from the back with the defenders, but it will involve more players in attacking positions when a team’s build up gets closer to the opponents’ goal. Build up can be opposed or unopposed. “Unopposed” indicates that the inpossession team were allowed to begin their attack under minimal pressure from the opponents. “Opposed” indicates that the opponents looked to engage with the in-possession team, applying pressure to the players on the ball with defensive pressure or defensive actions. Typically, this can be associated with teams that build up their attacks against opponents who look to press and win the ball back high up the pitch. |
| Progression | The aim of this attacking phase is to advance the ball into the final third. Typically, this is achieved by vertical passes that break the opponents’ lines, or by a player carrying the ball forward with a ball progression (this looks similar to a carry/dribble by an individual player). |
| Final third | When teams are in possession of the ball in the attacking third of the pitch, where the aim is to finish the attack by scoring a goal. |
| Counter-attack | A counter-attack is when a team regains possession and immediately attacks the opposition with speed and intensity. It is all about being direct and exploiting the spaces between and behind the opposition defensive lines. |
| High press | The defensive team engages the opposition high up the pitch and attempts to aggressively apply defensive pressure against the attacking team. This can typically be seen when the attacking players of the defensive team attempt to close down the space of opposition defenders during the attacking team’s build up play. |
| Mid block | The defensive team adopts an organised defensive shape in the middle third of the pitch. Typically, teams will look to stay compact and narrow, with the majority of the defensive players connected to each other very closely. |
| Low block | The defensive team adopts an organised defensive shape in their defensive third. Typically, teams will look to stay compact and narrow, with the majority of the defensive players connected to each other very closely as they attempt to defend their goal and prevent the opponents from penetrating their penalty area. |
| Counter-press | Following a loss of possession of the ball, the out-of-possession team immediately aims to regain the ball through aggressive pressure on the opponent. Typically, this is most often seen when the attacking team lose the ball in the final third and want to quickly regain possession. This phase can happen anywhere on the pitch. |
| Recovery | Following loss of the ball, the defensive team quickly runs towards their own goal. This is typically seen when the attacking team are counter-attacking and the defensive team must recover quickly to defend their goal. |
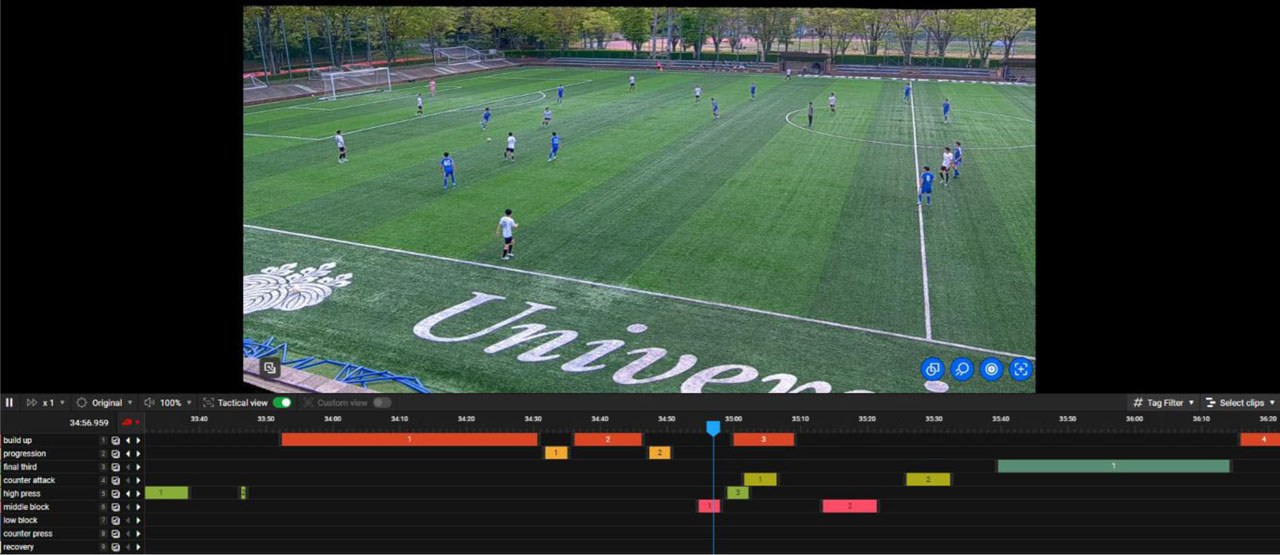
Figure A1:
Screenshot of the Bepro application used for play phase annotation by analysts.
Table A2:
Evaluation of the segment assignment optimization across training, validation, and test sets. The scores for each play phase represent the sum of probabilities across all frames and both teams. Values in parentheses denote the ideal scores calculated as Vp × rG.
| Split | Total | Train (rG = 0.8) | Validation (rG = 0.1) | Test (rG = 0.1) |
|---|---|---|---|---|
| Number of Segments | 107 | 85 | 11 | 11 |
| Number of Sequences | 50553 | 40521 | 4874 | 5158 |
| Score of Build up | 22092.25 | 17761.25 (17673.80) | 1917.75 (2209.22) | 2413.25 (2209.22) |
| Score of Progression | 7435.00 | 6066.25 (5948.00) | 886.75 (743.50) | 482.00 (743.50) |
| Score of Final third | 7598.00 | 6007.75 (6078.40) | 830.25 (759.80) | 760.00 (759.80) |
| Score of Counter-attack | 4079.25 | 3035.25 (3263.40) | 516.75 (407.93) | 527.25 (407.93) |
| Score of High press | 6212.00 | 4911.00 (4969.60) | 715.25 (621.20) | 585.75 (621.20) |
| Score of Mid block | 13395.50 | 10530.75 (10716.40) | 1358.00 (1339.55) | 1506.75 (1339.55) |
| Score of Low block | 9931.75 | 8214.50 (7945.40) | 763.50 (993.18) | 953.75 (993.18) |
| Score of Counter-press | 4866.25 | 4098.75 (3893.00) | 413.75 (486.62) | 353.75 (486.62) |
| Score of Recovery | 4590.50 | 3496.25 (3672.40) | 621.00 (459.05) | 473.25 (459.05) |