
Table 1.
A review of bibliometric studies mapping gender and corporate governance key parameters
| Authors | Focus | Data source | Sample | Time-period | Software | Filters | Scientific productivity | Cited papers | Cited authors | Major themes | Thematic network | Dynamics of change between time-periods | Thematic evolution |
|---|---|---|---|---|---|---|---|---|---|---|---|---|---|
| Terjesen et al., 2009 | women on corporate boards | EBSCO, ProQuest, Google Scholar, directly from authors | 180 | until 2009 | Manually | 0 | 0 | 0 | 0 | x | x | 0 | 0 |
| Kagzi and Guha, 2018 | board demographic diversity | EBSCO | na | 1989–2016 | Manually | 0 | 0 | 0 | 0 | x | 0 | 0 | 0 |
| Baker et al. 2020 | board demographic diversity | Web of Science | 579 | 1999–2019 | BibExcel, Gephi | x | x | x | x | x | x | 0 | 0 |
| Sánchez-Teba et al. 2020 | gender diversity of boards | Web of Science | 168 | 1994–2020 | VOSviewer | 0 | 0 | x | x | x | x | 0 | partially |
| Singh et al. 2021 | gender diversity of boards | Scopus | 352 | 1989–2021 | VOSviewer | x | x | x | x | x | x | 0 | partially |
| Mumu et al. 2022 | gender diversity in corporate governance | Web of Science | 393 | 1992–2020 | VOSviewer | x | x | 0 | x | x | x | 0 | 0 |
| Basher et al. 2022 | gender diversity of boards | Scopus | 1413 | 2000–2021 | VOSviewer, R Studio, META | x | x | x | 0 | x | x | 0 | 0 |
| Vieira et al. 2022 | gender diversity in corporate governance | Scopus | 402 | 2017–2021 | Scopus | x | x | x | 0 | 0 | 0 | 0 | 0 |
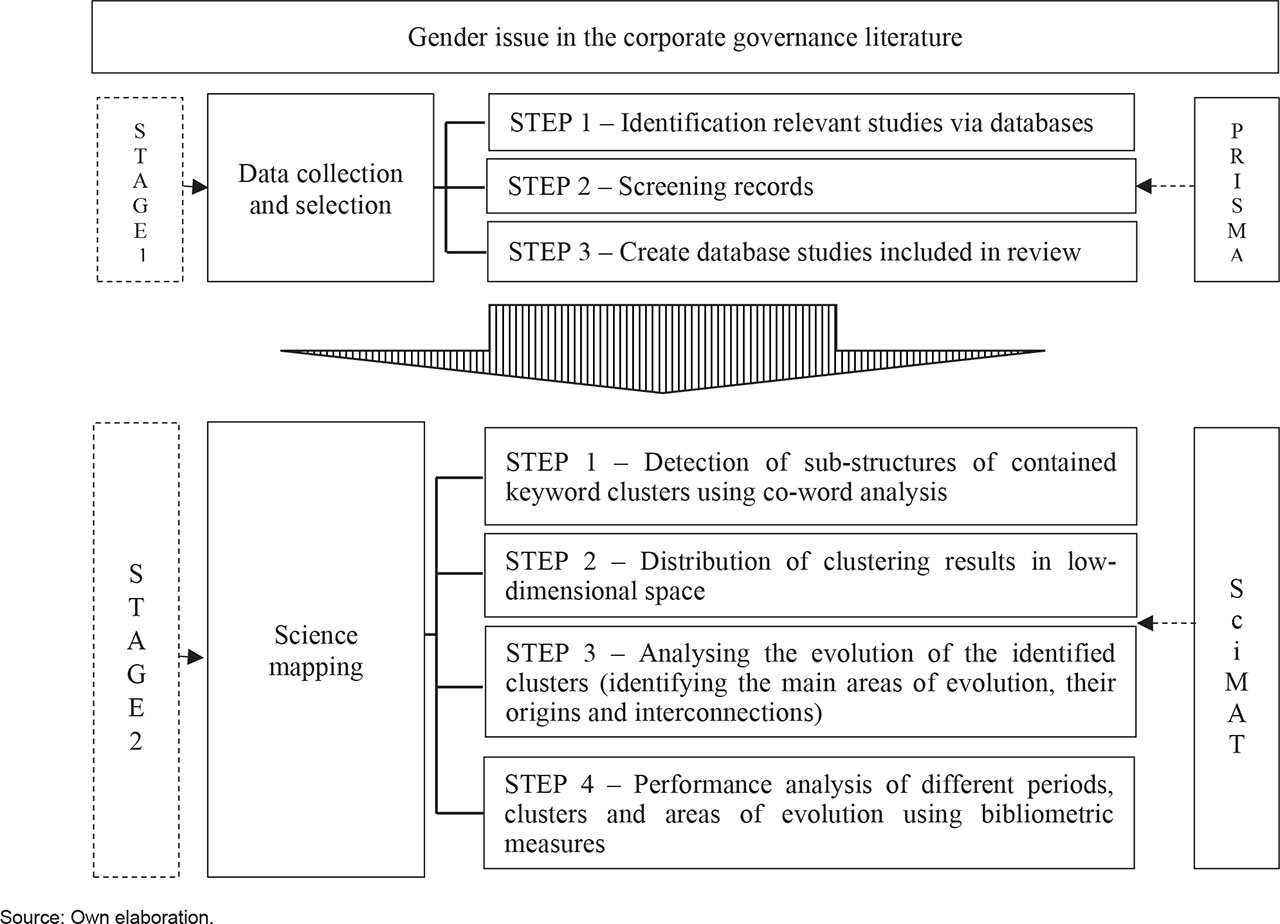
Figure 1.
Conceptual design of the research process
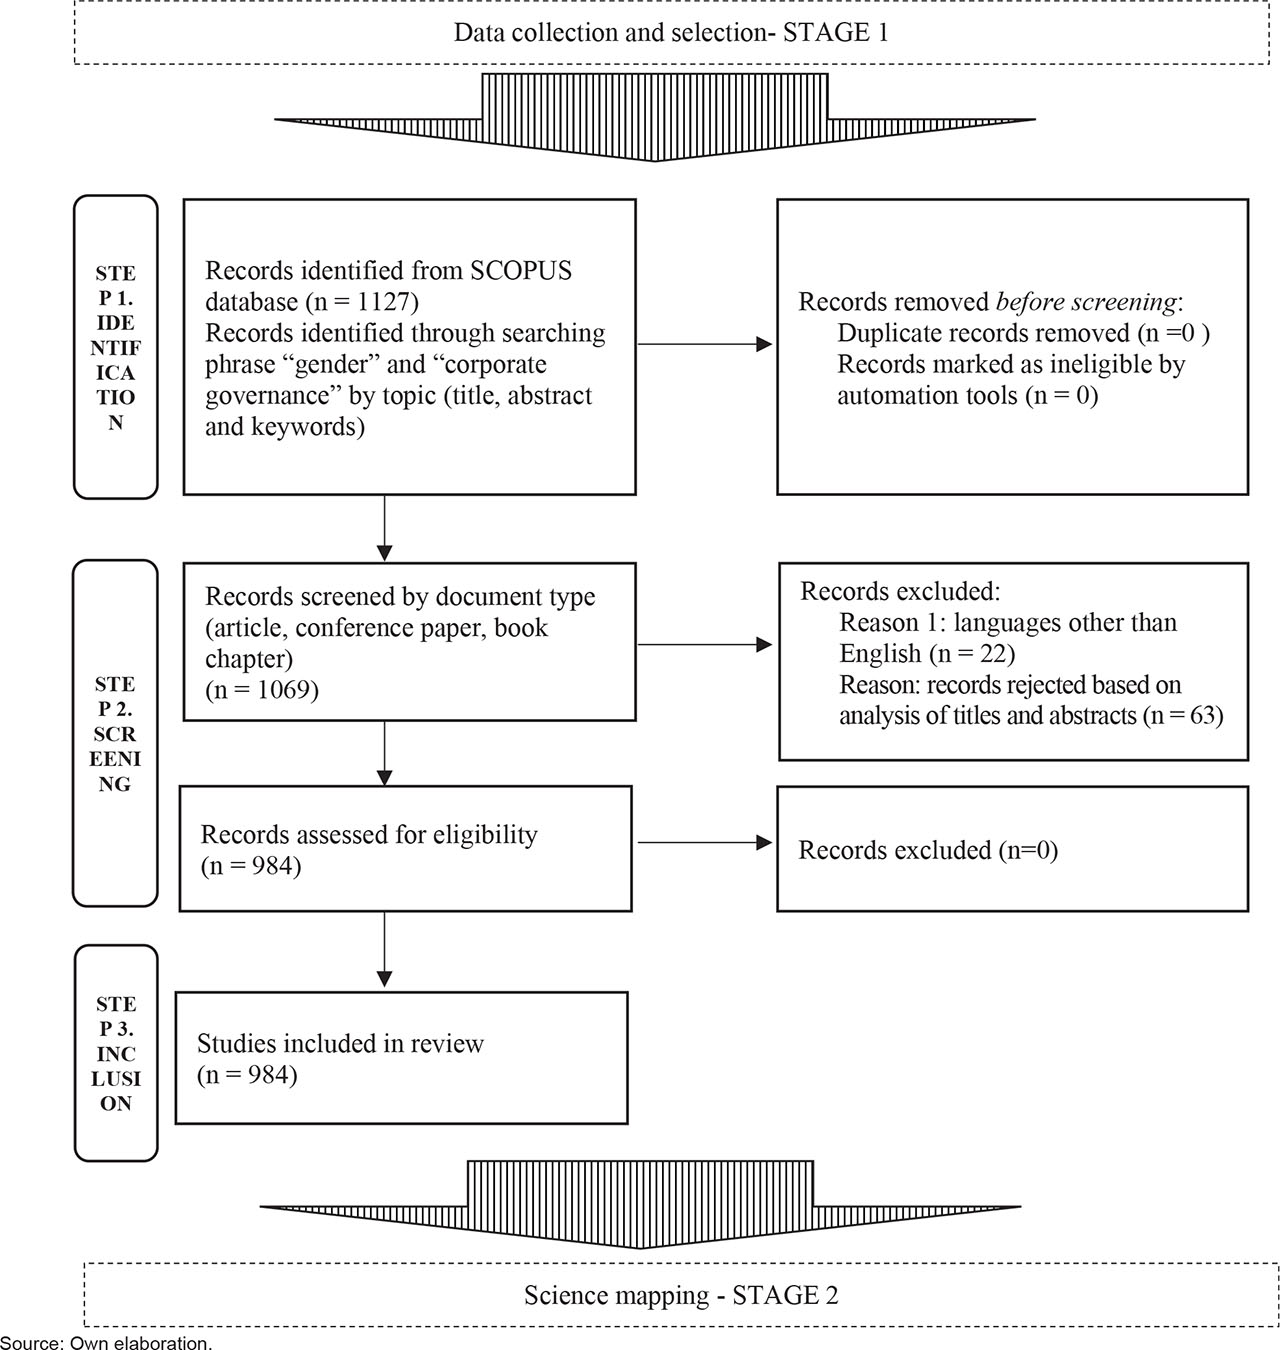
Figure 2.
Stage 1. Data collection and selection.
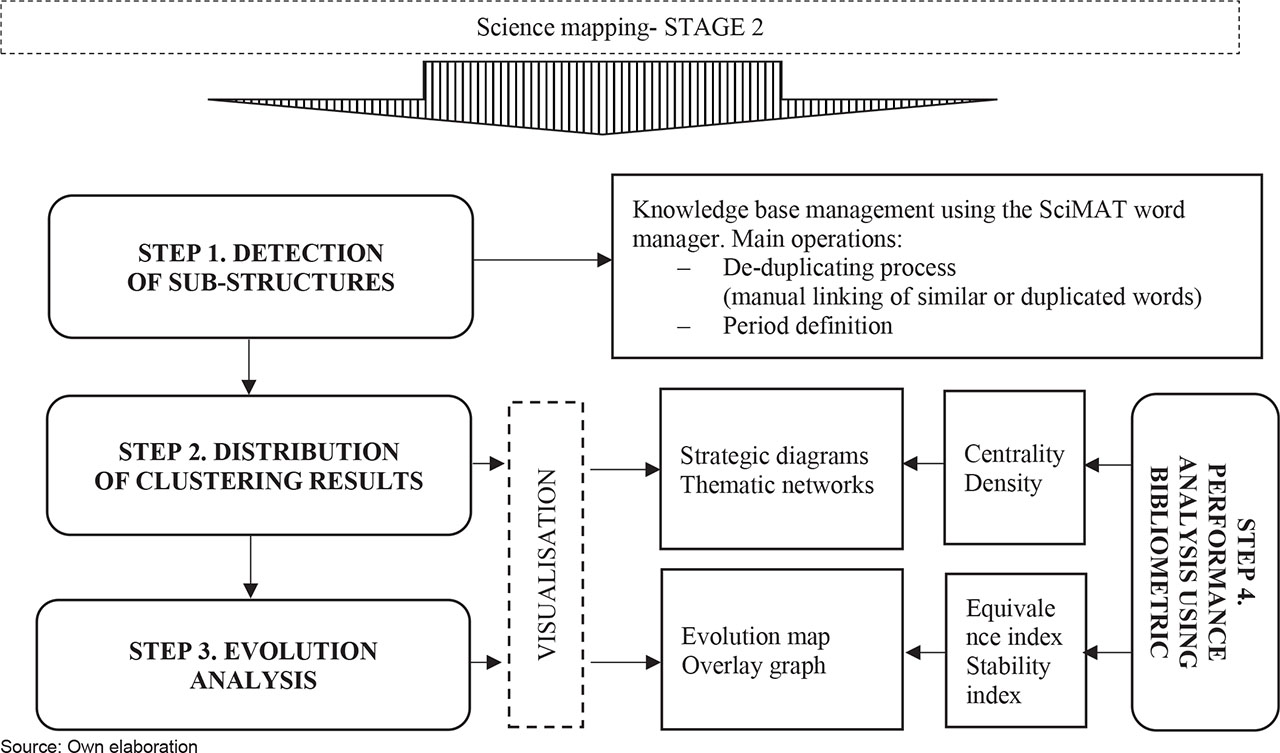
Figure 3.
Stage 2. Science mapping.
Table 2.
Formulas of indexes used in SciMAT analysis
| Measure | Formula | Description of Symbols |
|---|---|---|
| Equivalence index | Eij - the equivalence index; | |
| i, j, …. - keywords | ||
| Ci - the number of occurrences of the keyword “i”; | ||
| Cj - the number of occurrences of the keyword “j”; | ||
| Cij - the number of co-occurrences of the keywords “i” and “j”. | ||
| Centrality | c – centrality; | |
| u - an item belonging to the cluster; | ||
| v - an item belonging to other clusters. | ||
| Centrality range | cru – centrality range; | |
| cu – the original centrality values of cluster u | ||
| cmax, cmin – the maximum and minimum values within the dataset | ||
| Density | d- density; | |
| i, j - items belonging to the cluster; | ||
| n- the number of items in the theme | ||
| Density range | dru – centrality range; | |
| du – the original density values of cluster u | ||
| dmax, dmin – the maximum and minimum values within the dataset | ||
| Stability index | Sij - the stability index; | |
| t1, t2, …. - periods | ||
| nt1 – the number of keywords related to period t1; | ||
| nt2 - the number of keywords related to period t2; | ||
| nt1t2 - the number of keywords shared by periods t1 and t2. |
[i] Source: own elaboration based on (Cobo et al. 2011, 2018) (Callon et al. 1991)
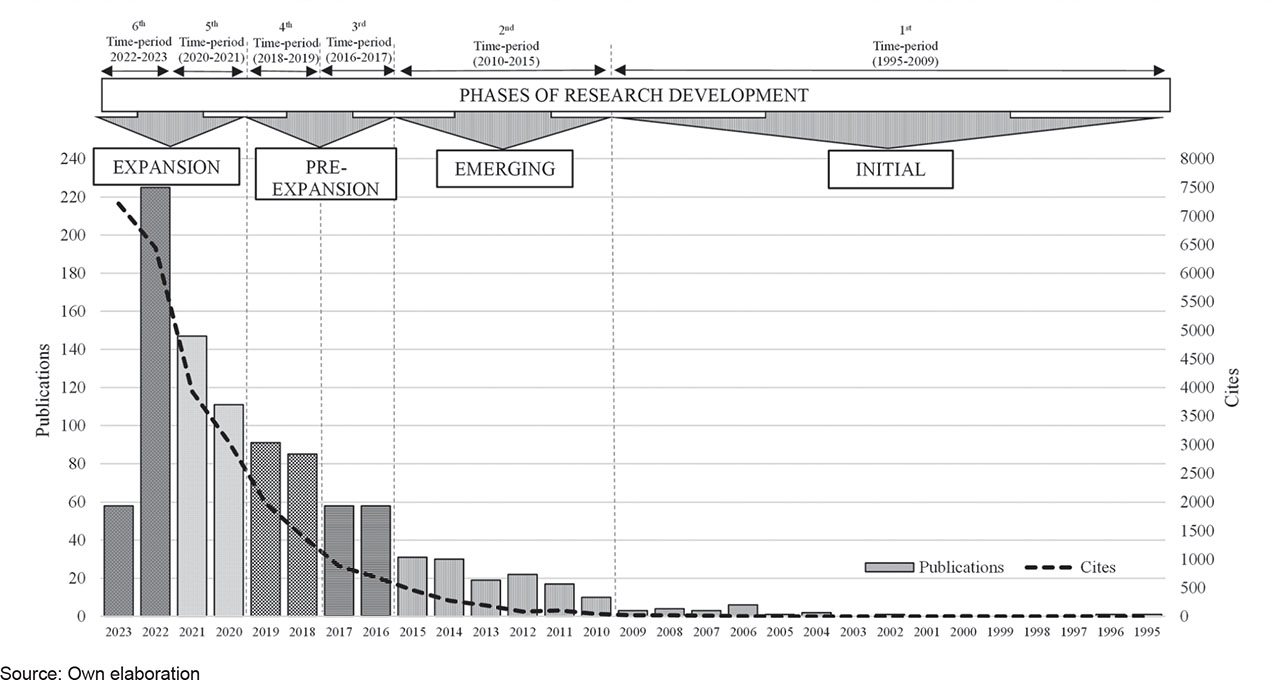
Figure 4.
Chronological distribution of documents in the dataset
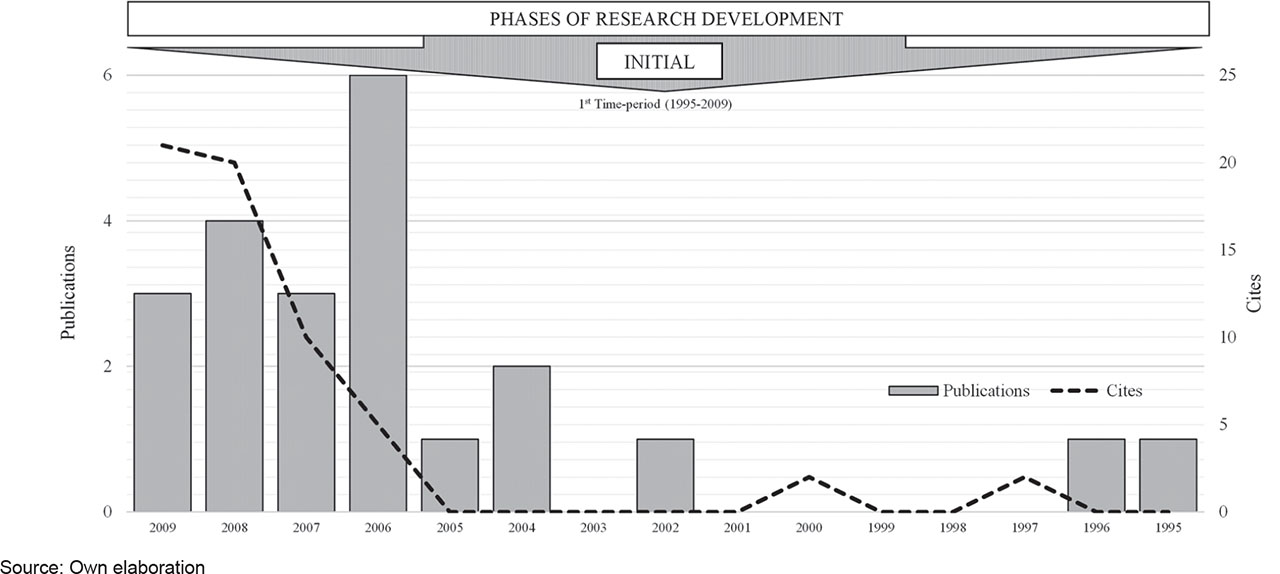
Figure 5.
The formulated research database: Initial phase.
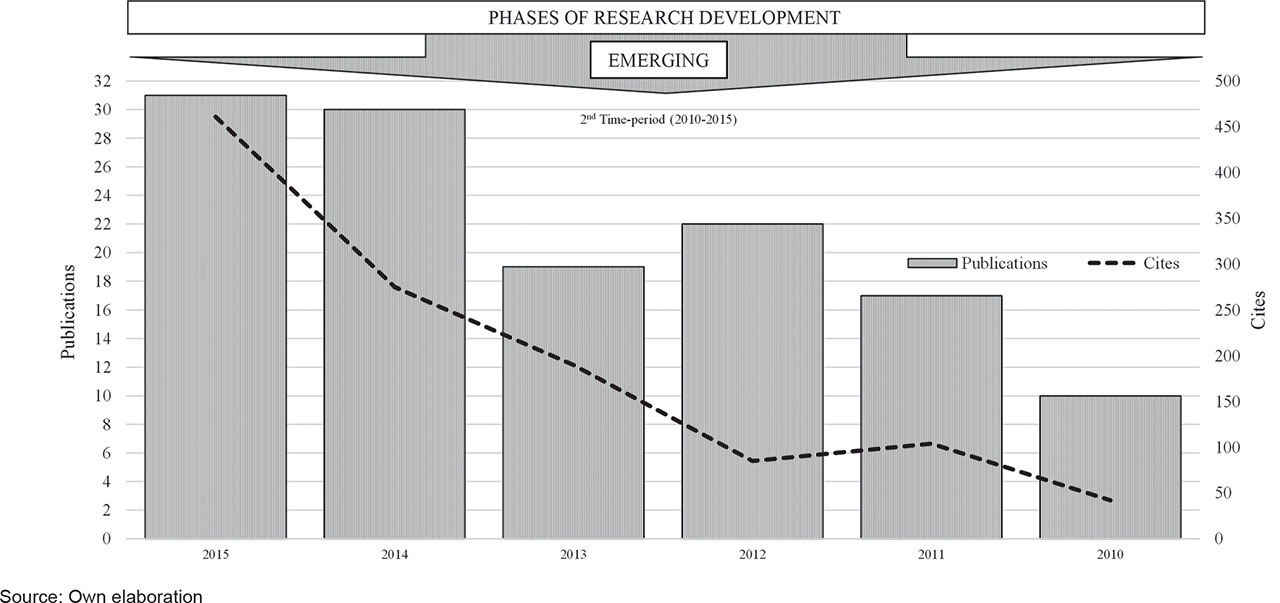
Figure 6.
The formulated research database: Emerging phase.
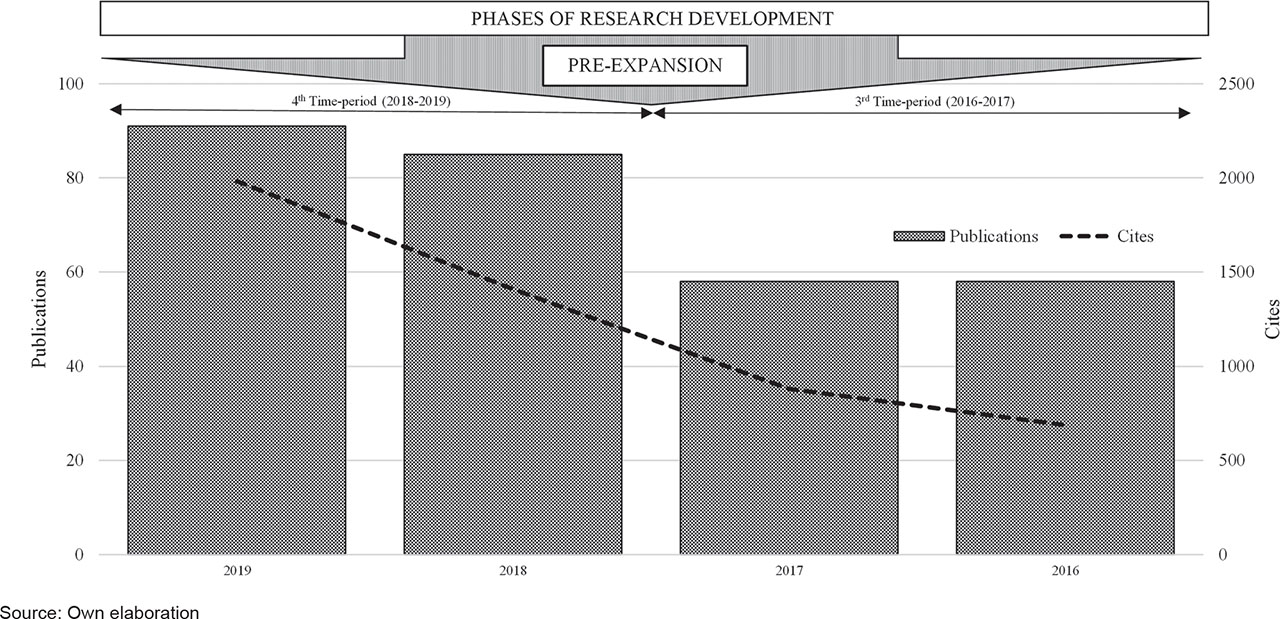
Figure 7.
The formulated research database: Pre-expansion phase.
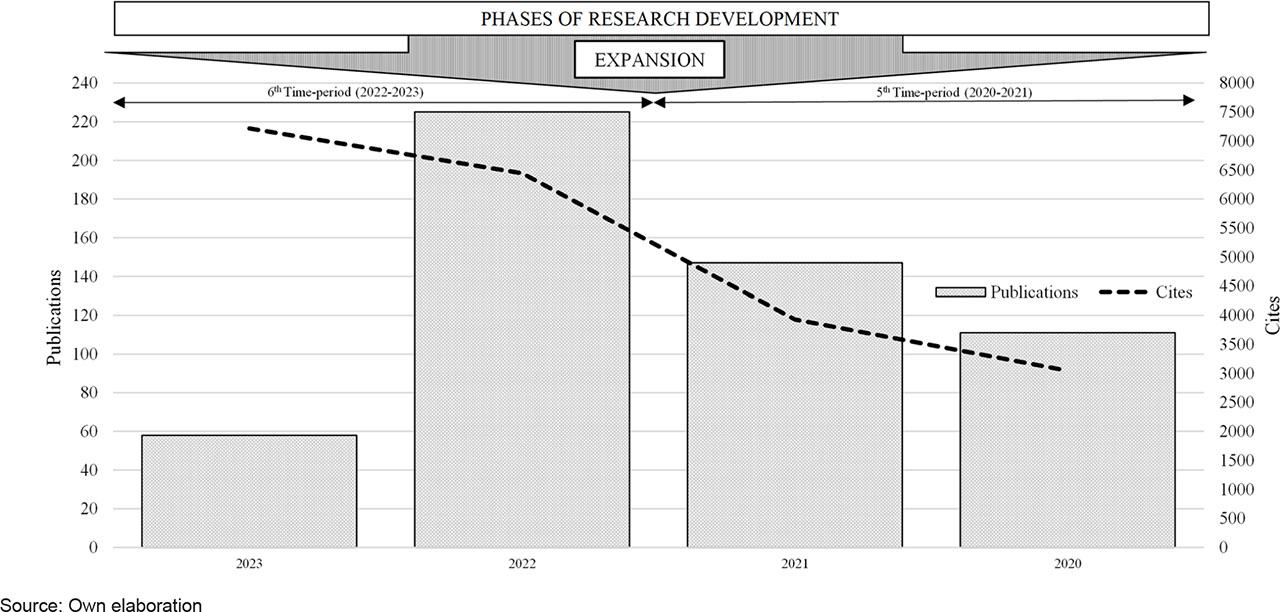
Figure 8.
The formulated research database: Expansion phase.
Table 3.
The top ten most frequently cited papers
| Rank | TITLE OF THE PAPER | AUTHOR | JOUR. | YEAR | TC | TCY |
|---|---|---|---|---|---|---|
| 1 | The gender and ethnic diversity of US boards and board committees and firm financial performance. | Carter, D. A., D’Souza, F., Simkins, B. J., & Simpson, W. G. | CG_IR | 2010 | 933 | 71,8 |
| 2 | Women directors on corporate boards: A review and research agenda. | Terjesen, S., Sealy, R., & Singh, V. | CG_IR | 2009 | 771 | 50,1 |
| 3 | Does board gender diversity improve the informativeness of stock prices? | Gul, F. A., Srinidhi, B., & Ng, A. C. | JAE | 2011 | 718 | 59,8 |
| 4 | Gender diversity, board independence, environmental committee, and greenhouse gas disclosure. | Liao, L., Luo, L., & Tang, Q. | BAR | 2015 | 703 | 87,9 |
| 5 | The contribution of women on boards of directors: Going beyond the surface | Nielsen, S., & Huse, M | CG_IR | 2010 | 622 | 47,8 |
| 6 | The role of the board in the dissemination of integrated corporate social reporting | Frias-Aceituno, J. V., Rodríguez-Ariza, L., & García-Sánchez, I. M. | CSR_EM | 2013 | 408 | 40,8 |
| 7 | Corporate governance and board composition: Diversity and independence of Australian boards | Kang, H., Cheng, M., & Gray, S. J. | CG_IR | 2007 | 407 | 25,4 |
| 8 | Gender-related boardroom dynamics: How Scandinavian women make and can make contributions on corporate boards | Huse, M., & Grethe Solberg, A. | WMR | 2006 | 388 | 22,8 |
| 9 | Does the presence of independent and female directors impact firm performance? A multi-country study of board diversity | Terjesen, S., Couto, E. B., & Francisco, P. M. | JMG | 2016 | 370 | 52,9 |
| 10 | Executive board composition and bank risk taking. | Berger, A. N., Kick, T., & Schaeck, K. | JCF | 2014 | 333 | 37 |
[i] Abbreviations: JOUR.= Journal; TC= Total citations; TCY= Total citations per year; CG_IR= Corporate Governance: An International Review; JAE= Journal of Accounting and Economics; BAR= The British Accounting Review; CSR_EM= Corporate Social Responsibility and Environmental Management; WMR= Women in Management Review; JMG= Journal of Management & Governance; JCF= Journal of Corporate Finance
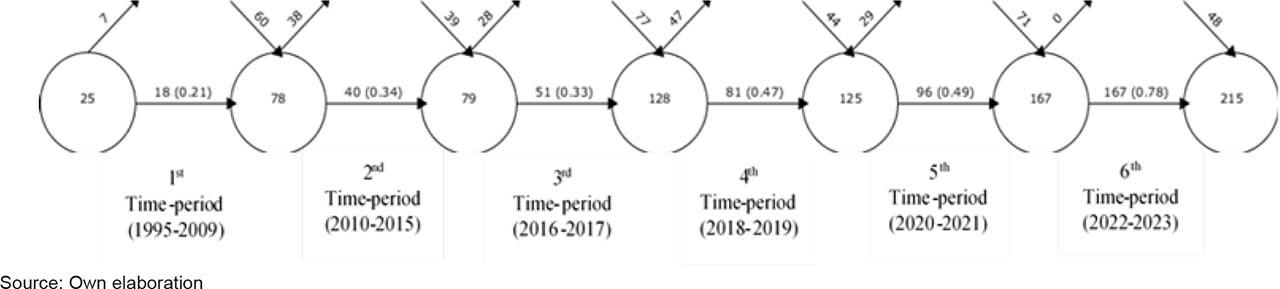
Figure 9.
Overlay graph.
Table 4.
The evolution of themes across the TCCM framework.
| TCCM Element/Time-period | 1st Time-period | 2nd Time-period | 3rd Time-period | 4th Time-period | 5th Time-period | 6th Time-period |
|---|---|---|---|---|---|---|
| Theory | Corporate governance theory (emphasis on supervision and management structure) | Corporate social responsibility (CSR) Resource dependency theory | Resource dependency theory Legitimacy theory | Resource dependency theory Legitimacy theory | Stakeholder theory Resource dependency theory | Resource-dependency theory Institutional theory Stakeholder theory |
| Context | No explicit geographic context – early, conceptual phase of the field | Focus on social and ethical dimensions of governance | Developing countries Emerging markets | Emerging markets Developing countries Europe | Emerging markets Developing countries Dual-board system Mergers Family business | Emerging markets Developing countries Malaysia Banking sector Sub-national institutions |
| Characteristics | Gender diversity Firm performance Audit committee Board composition Board members Gender Market value | Gender diversity Firm performance Gender quota | Corporate-governance Human Women-directors Top-management teams Audit committee Gender Corporate donation Market value Gender equity | Corporate governance Investment Women on boards Gender equity Financial reporting Non-performing loan Board attributes Internal controls | Corporate governance Audit committee Corporates Financial performance Female Sustainable Development Goals (SDG) Bank profitability Corporate philanthropy Women on boards Executive compensation | Corporate governance Corporate governance disclosure Audit fees Corporates Sustainable Development Goals (SDGs) Institutional environment Women on board Investment Independent director Critical mass Corporate donation |
| Methodology | Mainly descriptive and correlational analyses; limited quantitative approaches | Multivariate analysis | Increasing methodological complexity; cross-country empirical analyses (implicit use of panel data) | Empirical research ((panel data models, regression-based quantitative analyses)) | Empirical research, Multivariate analysis Panel data regression models | Empirical research (quantitative studies using panel data and multivariate analysis) |
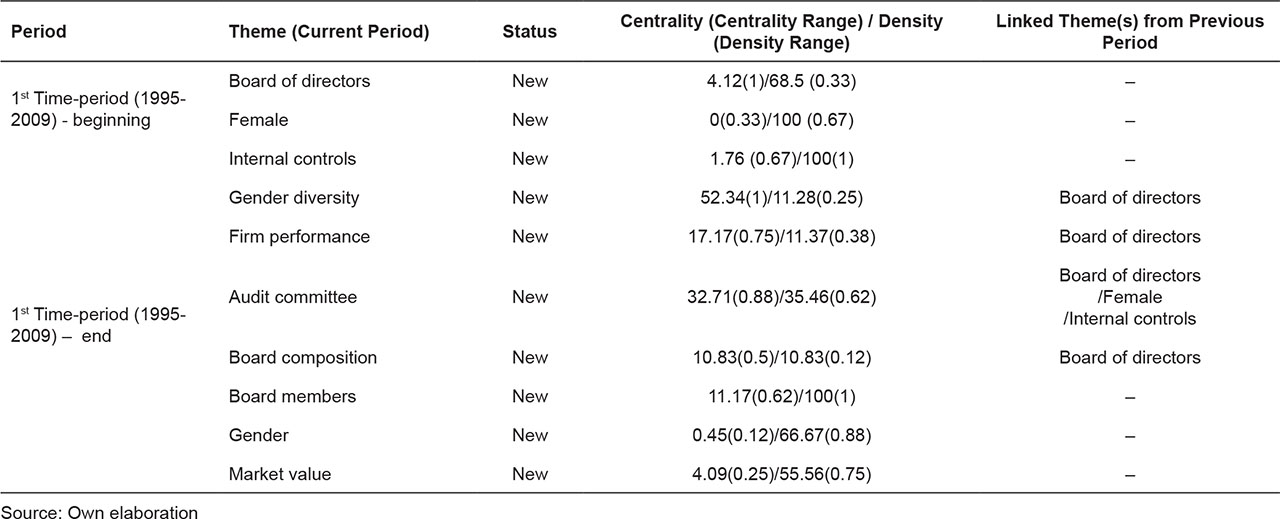
Figure 11.
Initial phase of the thematic evolution: First time-period results (1995–2009).
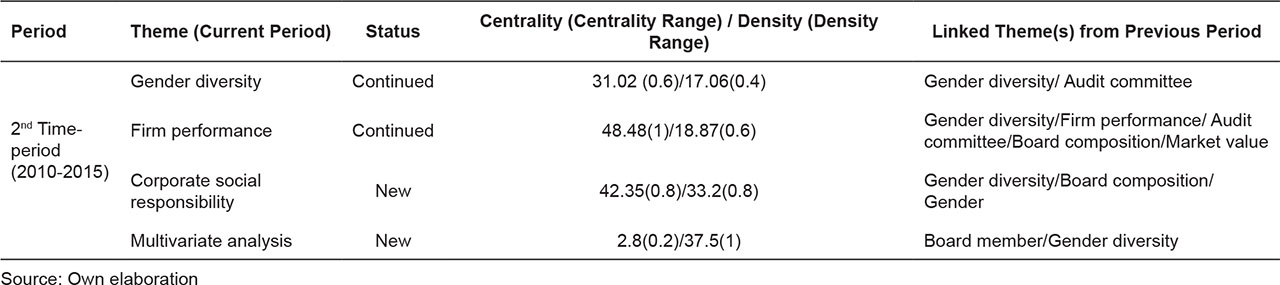
Figure 12.
Emerging phase of the thematic evolution: end of the Second time-period results (2010–2015).
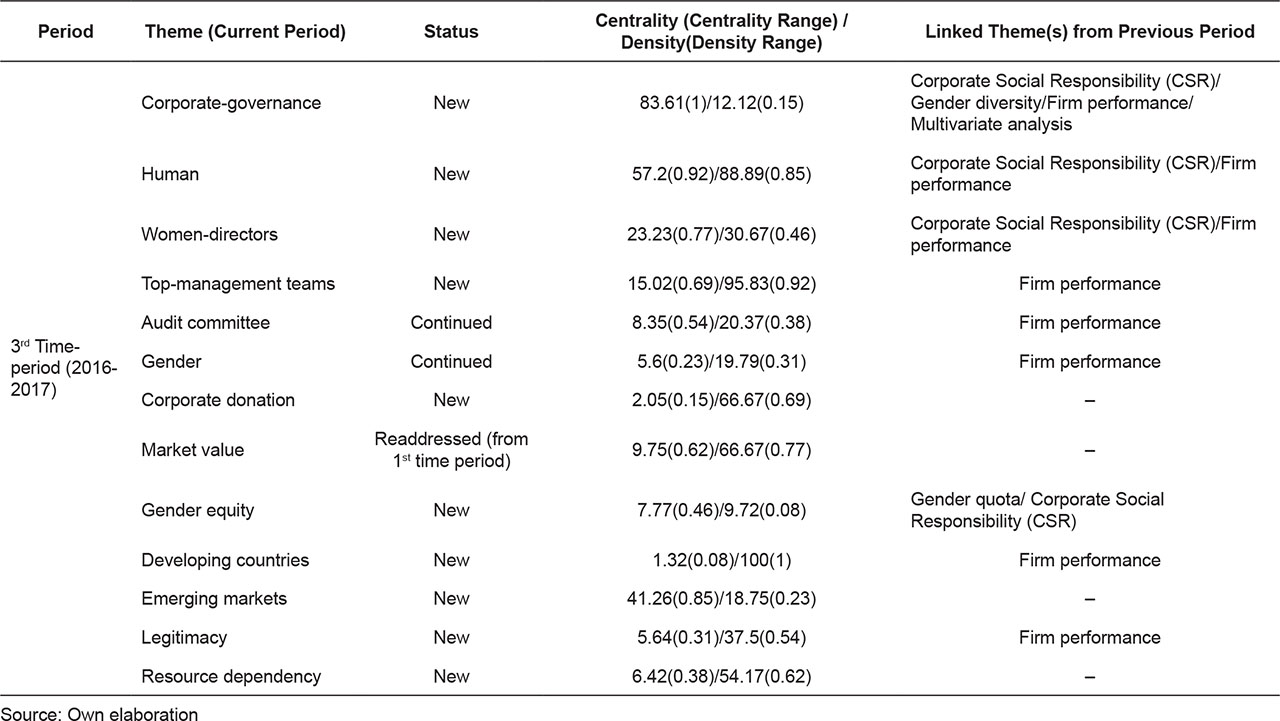
Figure 13.
First pre-expansion phase of the thematic evolution: Third time-period results (2016–17).
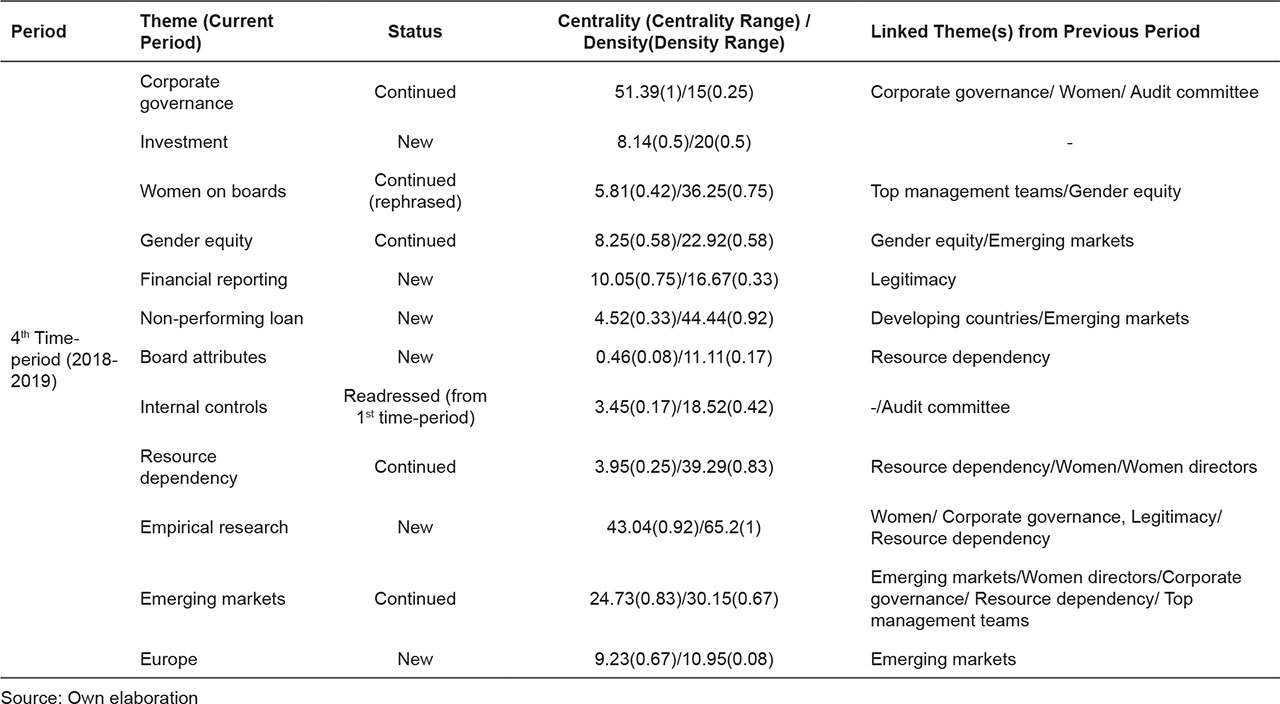
Figure 14.
Second pre-expansion phase of the thematic map: Fourth time-period results (2018–2019).
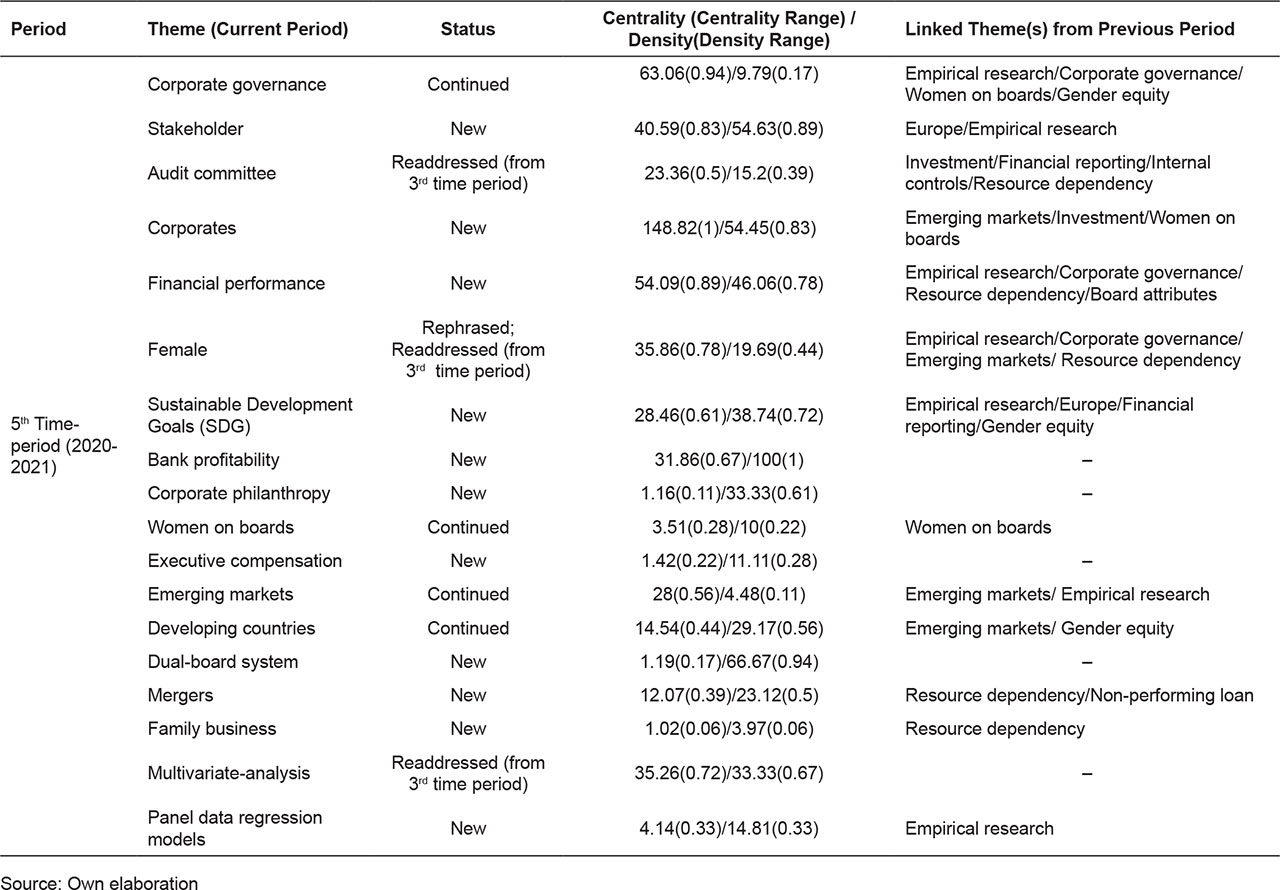
Figure 15.
First expansion phase of the thematic evolution map: Fifth time-period results (2020–2021).
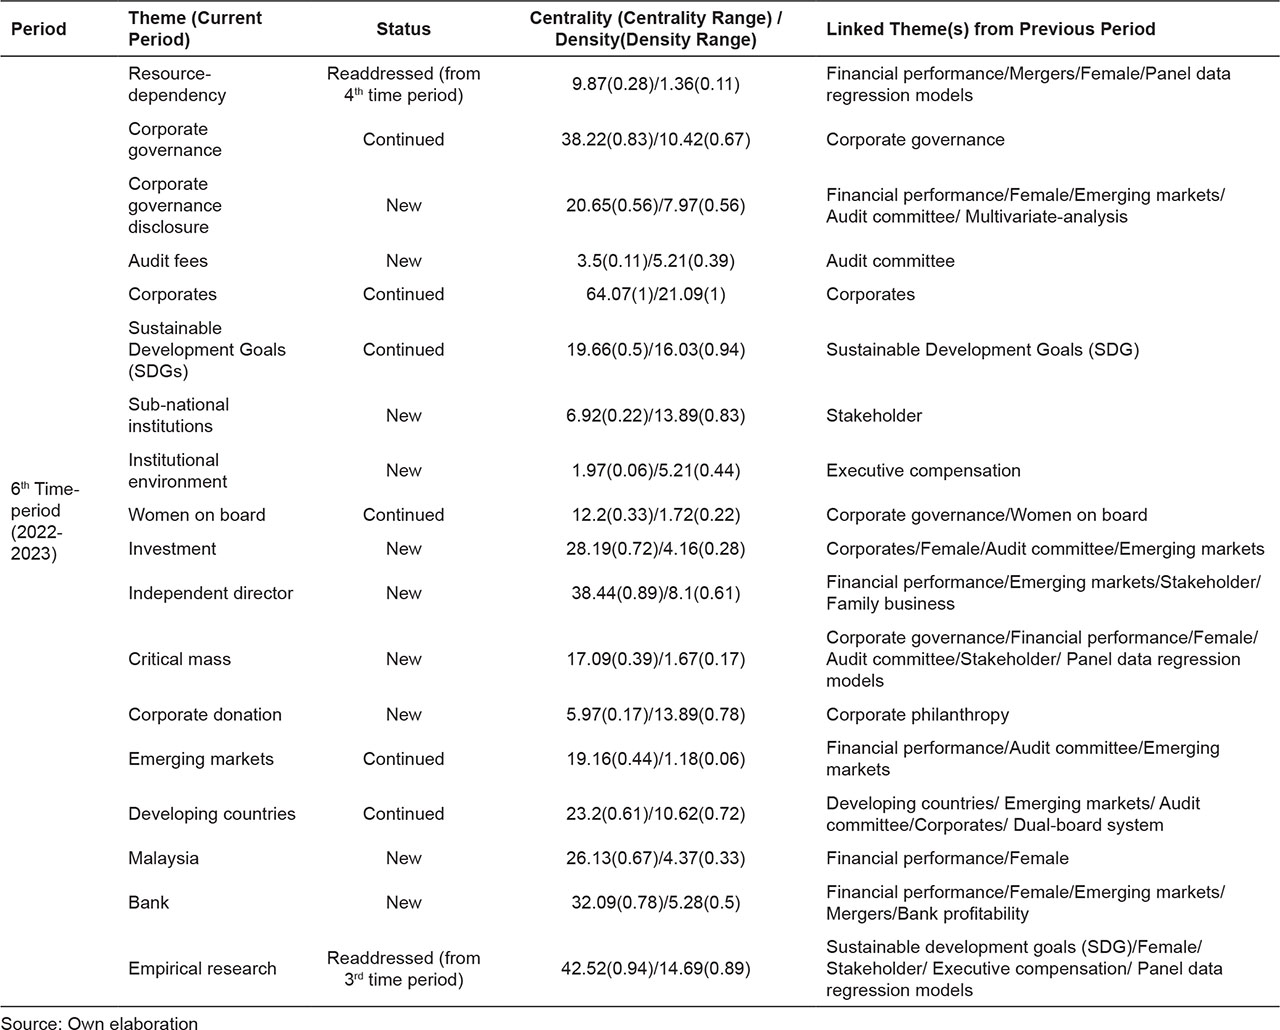
Figure 16.
Second expansion phase of the thematic evolution map: Sixth time-period results (2022–2023).
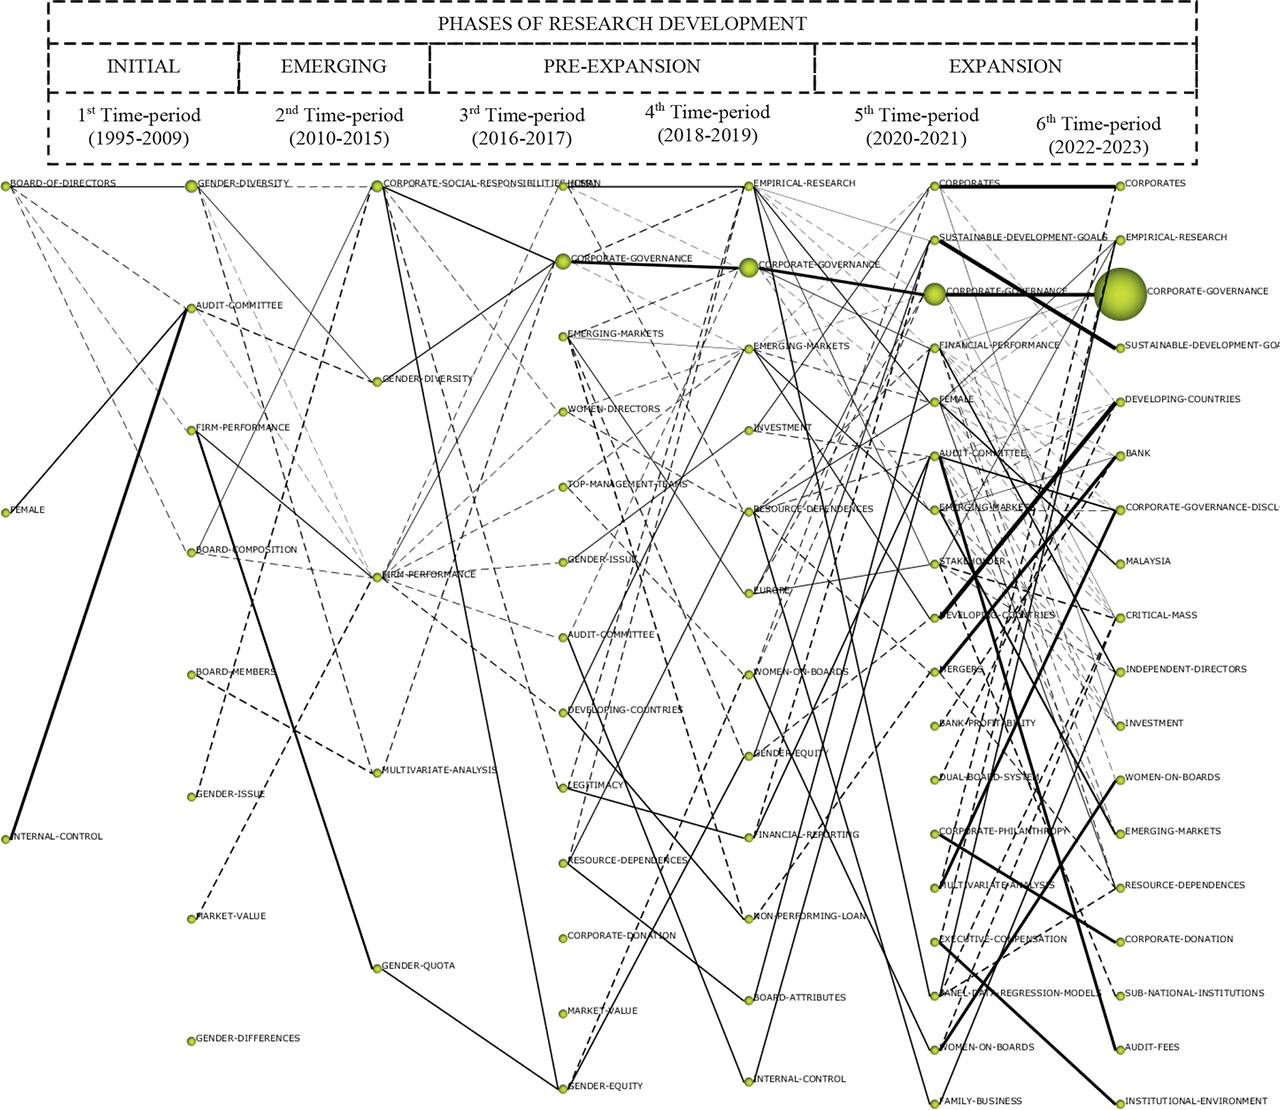
Figure A1.
The thematic evolution map