
Figure 1.

Figure 2.

Figure 3.

Figure 4.

Figure 5.
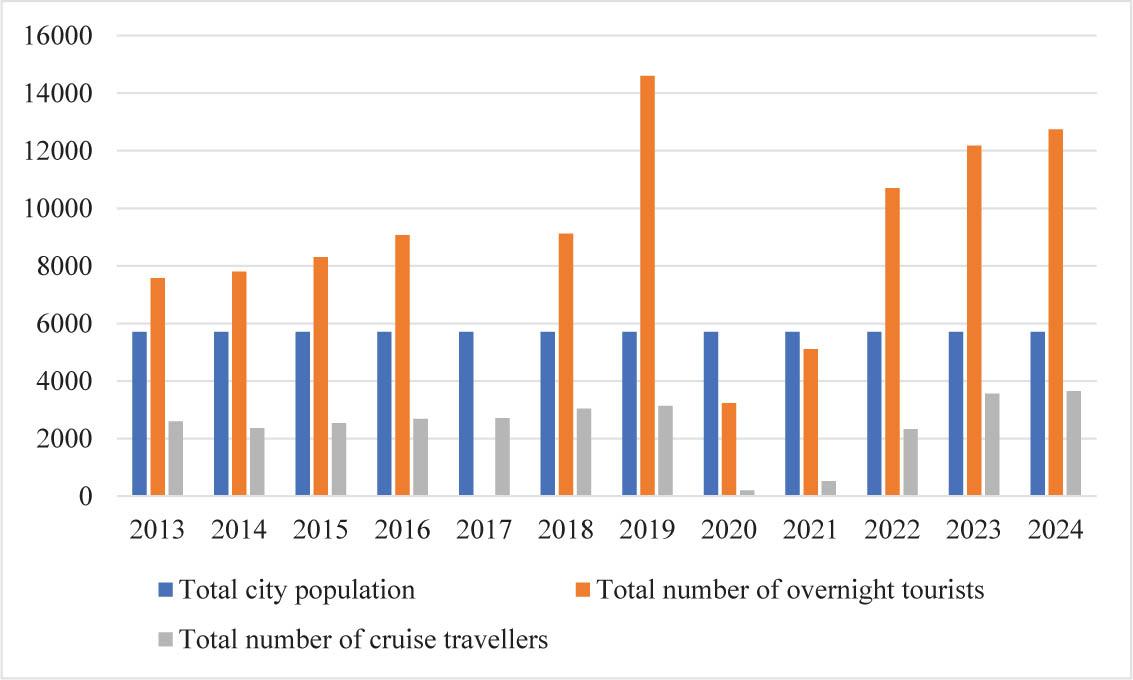
Figure 6.
The cruise ship traffic in the surveyed destinations from 2013 to 2024
| Year | The City of Venice | The City of Barcelona | The City of Dubrovnik | |||
|---|---|---|---|---|---|---|
| No of cruise travelers | No of cruise ship calls | No of cruise travelers | No of cruise ship calls | No of cruise travelers | No of cruise ship calls | |
| 2013 | 1.815.823 | 548 | 2.599.232 | 835 | 1.136.503 | 843 |
| 2014 | 1 733.839 | 488 | 2.364.292 | 767 | 894.216 | 752 |
| 2015 | 1.582.481 | 521 | 2.540.302 | 749 | 830.684 | 475 |
| 2016 | 1.605.660 | 529 | 2.683.594 | 758 | 831.730 | 639 |
| 2017 | 1.427.812 | 466 | 2.712.247 | 778 | 748.918 | 539 |
| 2018 | 1 560,58 | 502 | 3 042,22 | 830 | 732,43 | 414 |
| 2019 | 1,611,341 | 500 | 3,137,918 | 800 | 804,881 | 622 |
| 2020 | 5,237 | 6 | 198,842 | 53 | 5,041 | 64 |
| 2021 | 31,685 | 52 | 520,854 | 271 | 116,975 | 191 |
| 2022 | 258,294 | 261 | 2,329,332 | 805 | 400,273 | 403 |
| 2023 | 541,341 | 367 | 3,568,901 | 803 | 549,041 | 489 |
| 2024 | 597,351 | 400 | 3,655,981 | 791 | 632,513 | 625 |
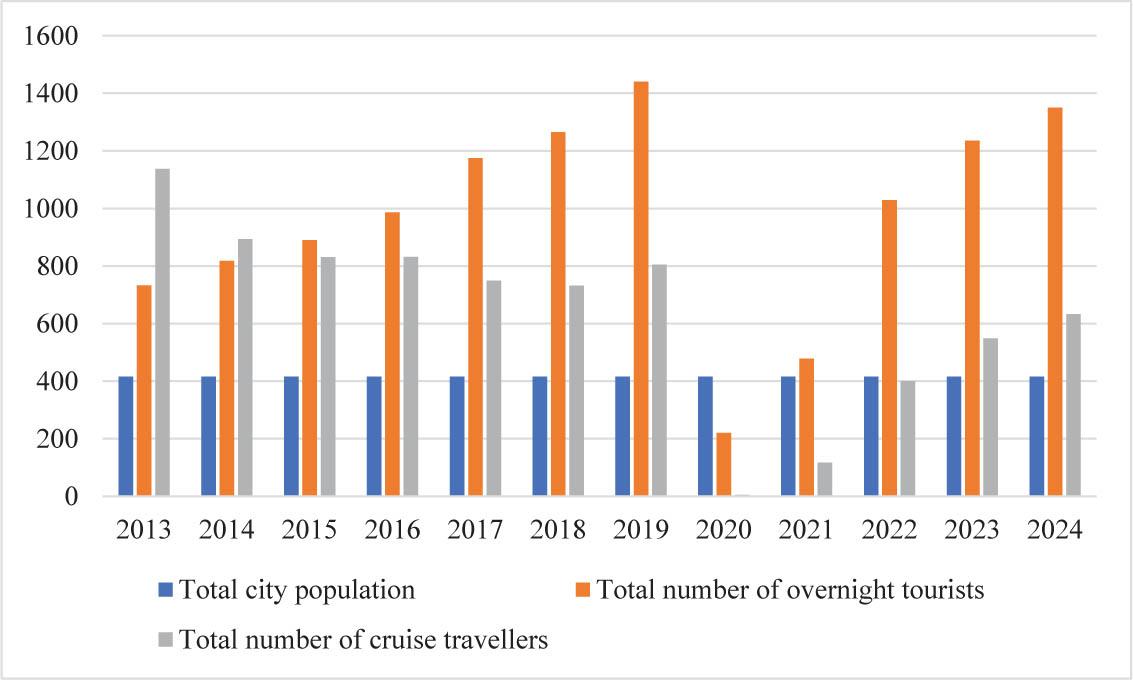
The percentage share of cruise travelers in total arrivals in the surveyed destinations from 2013 to 2024 (in 1,000s)**
| Year | The City of Venezia | The City of Barcelona | The City of Dubrovnik | ||||||
|---|---|---|---|---|---|---|---|---|---|
| Overnight tourists | Cruise travelers | Cruise travelers vs. Overnight tourists | Overnight tourists | Cruise travelers | Cruise travelers vs. Overnight tourists | Overnight tourists | Cruise travelers | Cruise travelers vs. Overnight tourists | |
| 2013 | 4 252 | 1.816 | 43% | 7 572 | 2 599 | 34% | 733 | 1 137 | 155% |
| 2014 | 4 281 | 1 734 | 41% | 7 800 | 2 364 | 30% | 818 | 894 | 109% |
| 2015 | 4 496 | 1.582 | 35% | 8 303 | 2 540 | 31% | 890 | 831 | 93% |
| 2016 | 4 646 | 1.606 | 35% | 9 065 | 2 684 | 30% | 987 | 832 | 84% |
| 2017 | 5 035 | 1.428 | 28% | 8 884 | 2 712 | 31% | 1 175 | 749 | 64% |
| 2018 | 5 255 | 1 561 | 30% | 9 117 | 3 042 | 33% | 1 265 | 732 | 58% |
| 2019 | 5 523 | 1,611 | 29% | 14 600 | 3 138 | 21% | 1 440 | 805 | 56% |
| 2020 | 1 338 | 5 | 0% | 3 233 | 199 | 6% | 220 | 5 | 2% |
| 2021 | 2 121 | 32 | 2% | 5 108 | 521 | 10% | 478 | 117 | 24% |
| 2022 | 4 646 | 258 | 6% | 10 704 | 2 329 | 22% | 1 029 | 400 | 39% |
| 2023 | 5 665 | 541 | 10% | 12 178 | 3 569 | 29% | 1 235 | 549 | 44% |
| 2024 | 5 877 | 597 | 10% | 12 743 | 3 656 | 29% | 1 350 | 633 | 47% |