
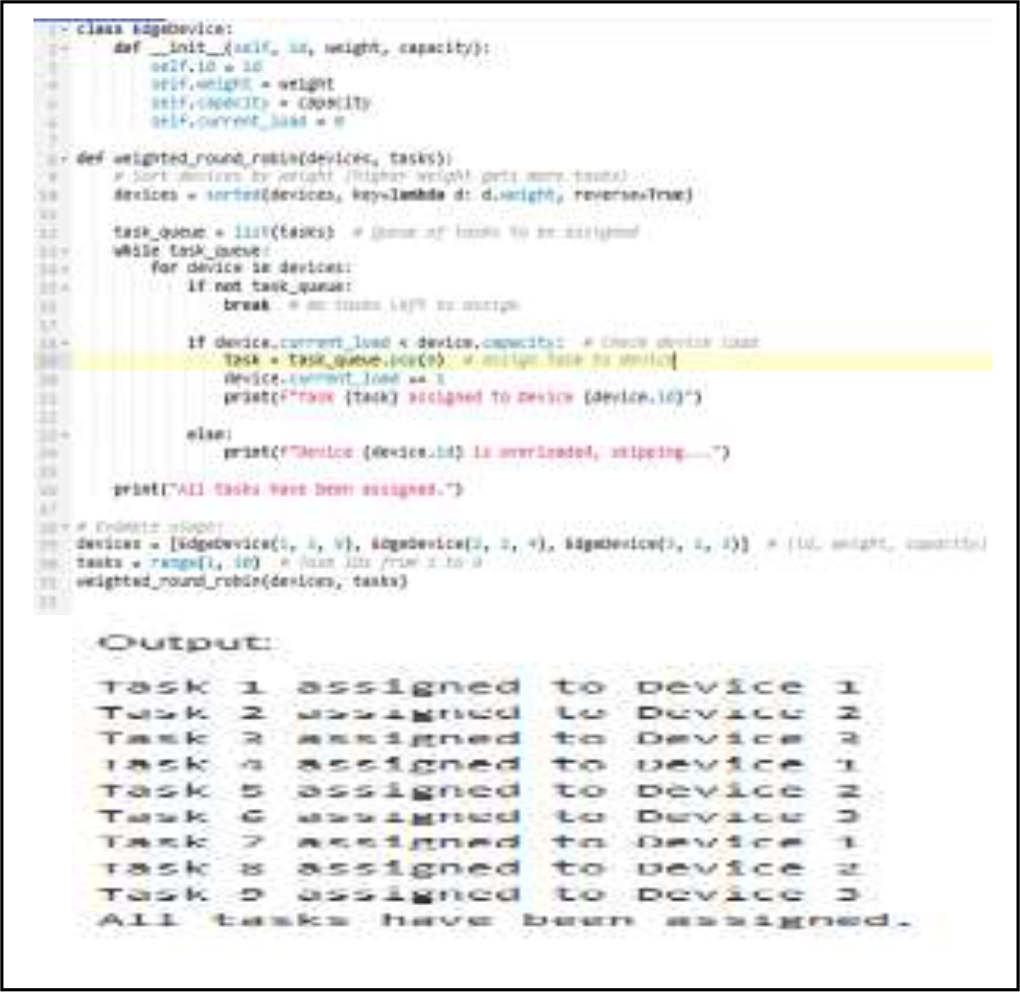
Figure 1.
Pseudo-code for Load Balancing Algorithm and its output
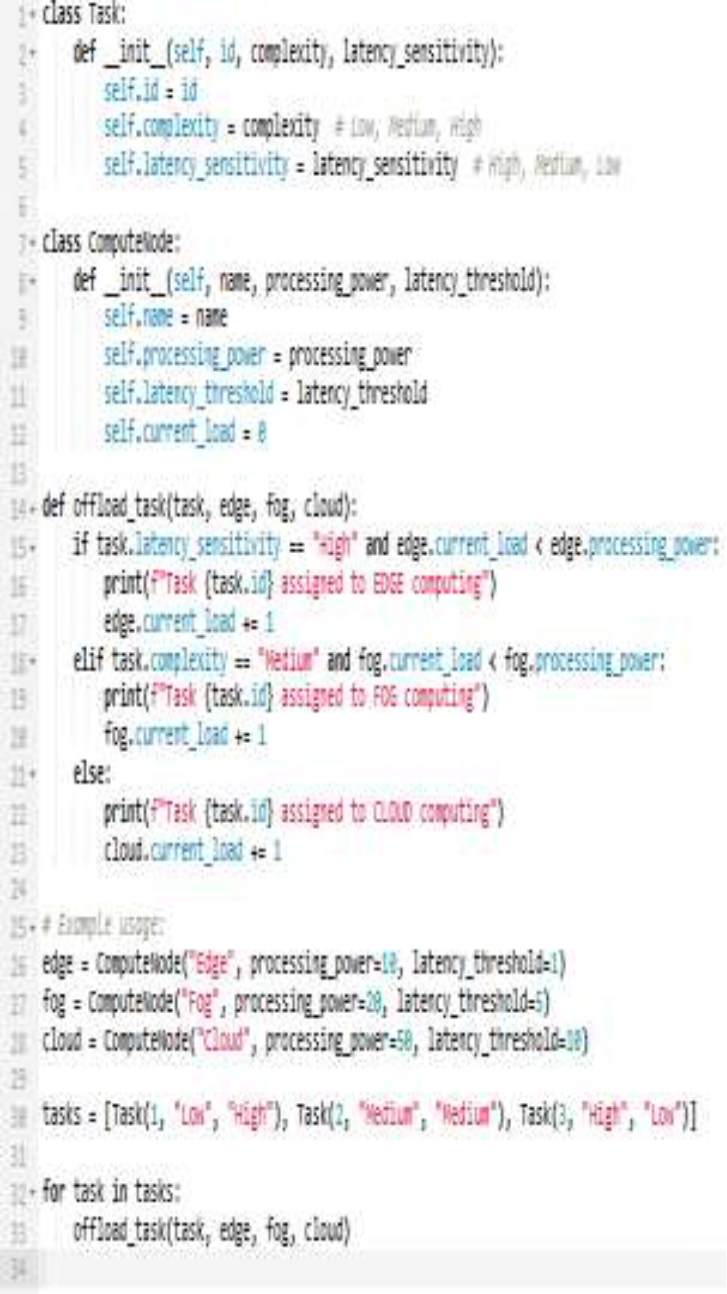
Figure 2.
Flowchart for the Load Balancing Algorithm
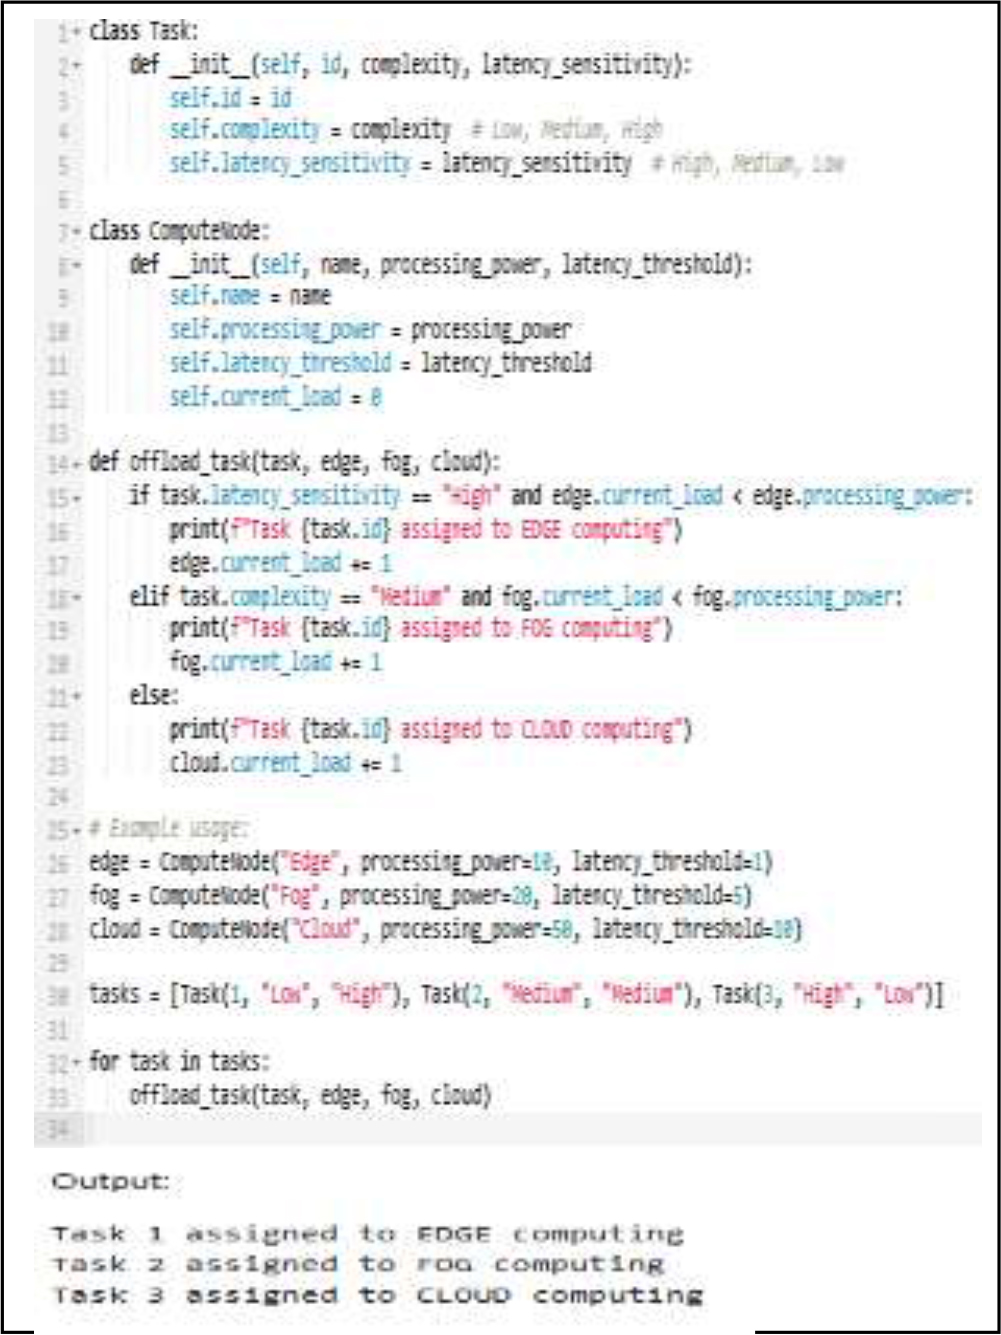
Figure 3.
Pseudo-code for task offloading algorithm and its output.
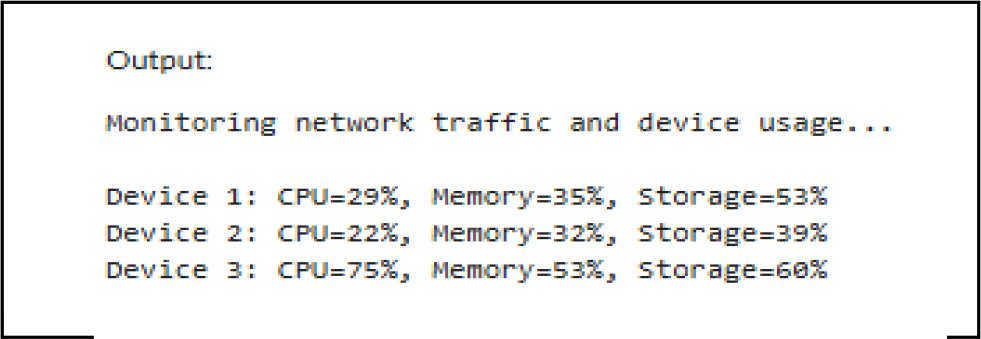
Figure 4.
Outputs of Pseudo-Code for Dynamic Resource Allocation.
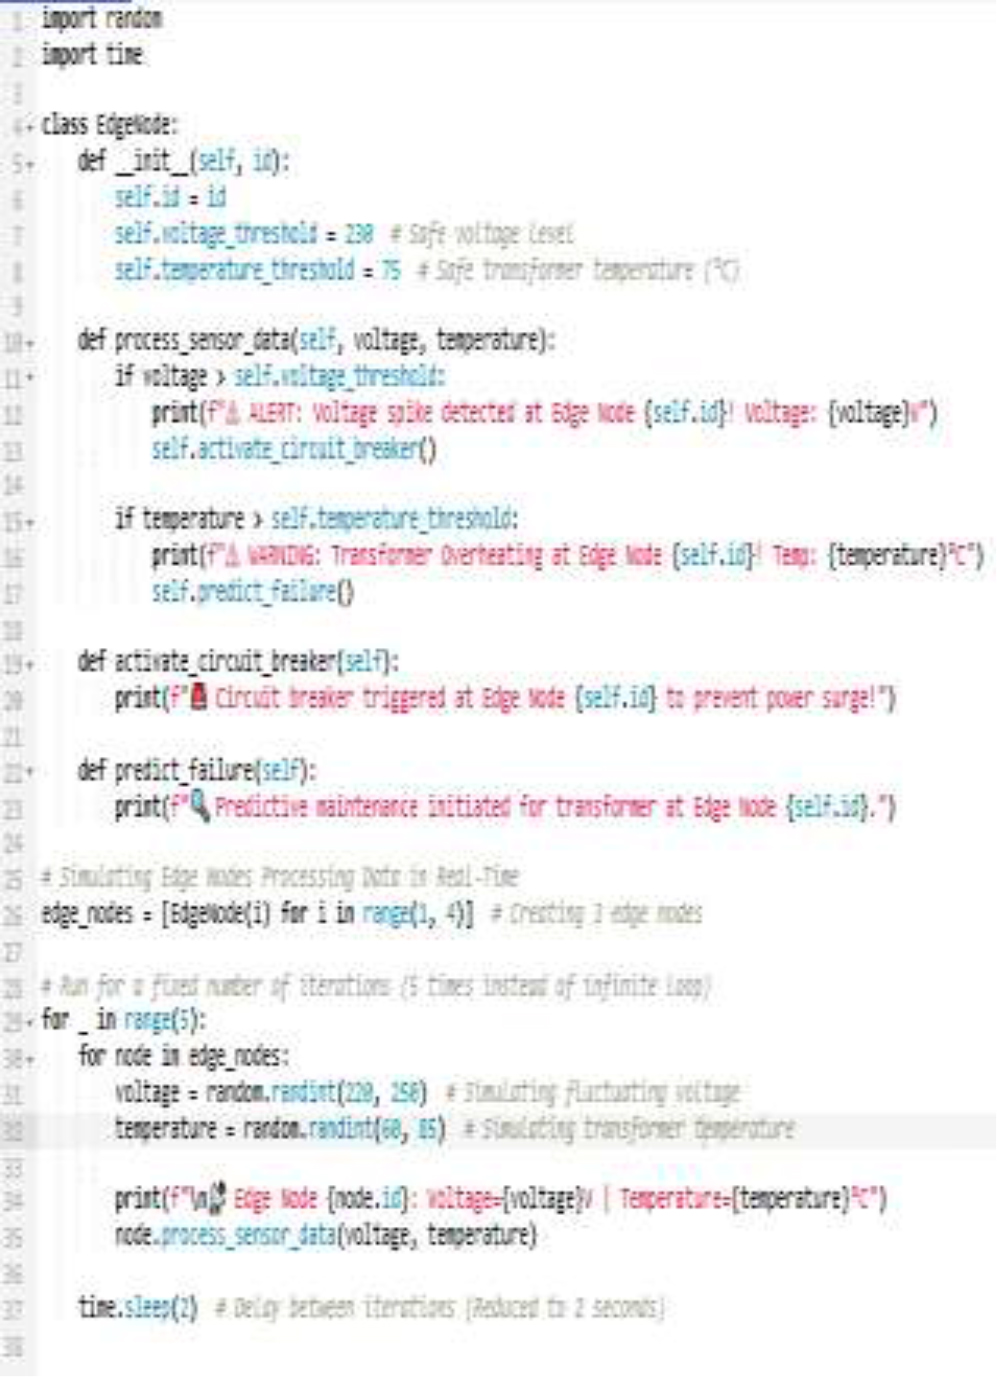
Figure 5.
Code for Edge-Based Power Grid Monitoring
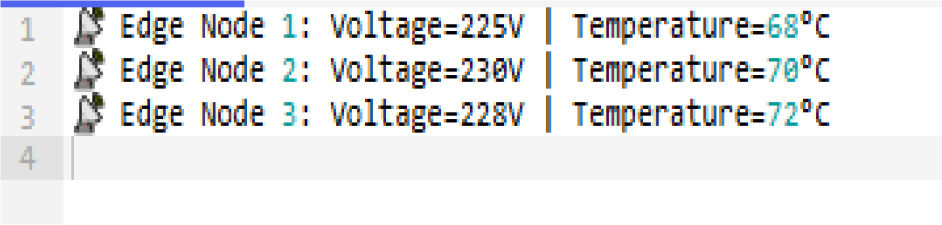
Figure 6.
Output. Scenario 1: Normal Conditions (No Alert): All values are within safe limits, so no actions are taken.
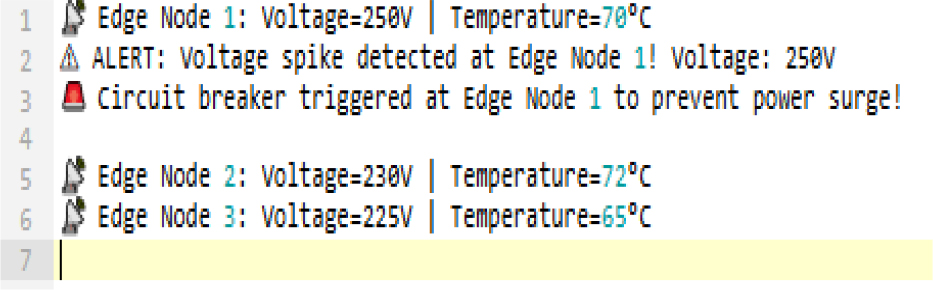
Figure 7.
Output. Scenario 2: Voltage Spike Detected (Trigger Circuit Breaker): Edge Node 1 detects high voltage (250V): Triggers circuit breaker to prevent damage.
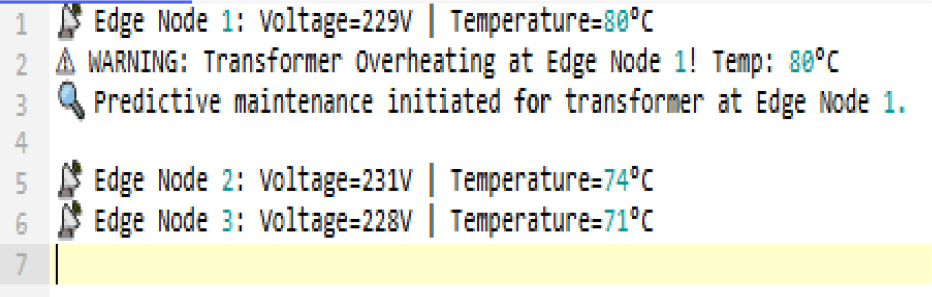
Figure 8.
Output. Scenario 3: Transformer Overheating Detected (Predictive Maintenance Alert): Edge Node 1 detects transformer overheating (80°C) → Triggers predictive maintenance.
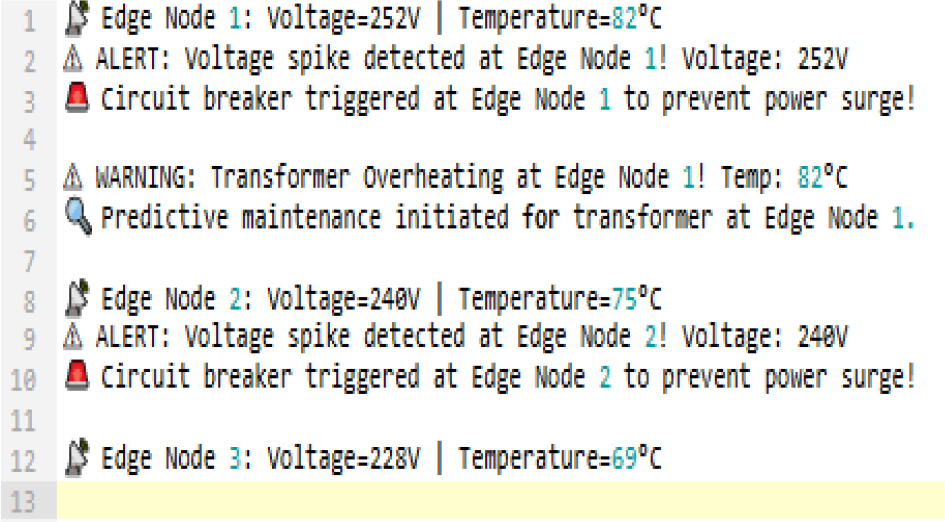
Figure 9.
Output. Scenario 4: Multiple Alerts Triggered: Both high voltage & overheating detected at Edge Node 1 and 2: Multiple actions taken.
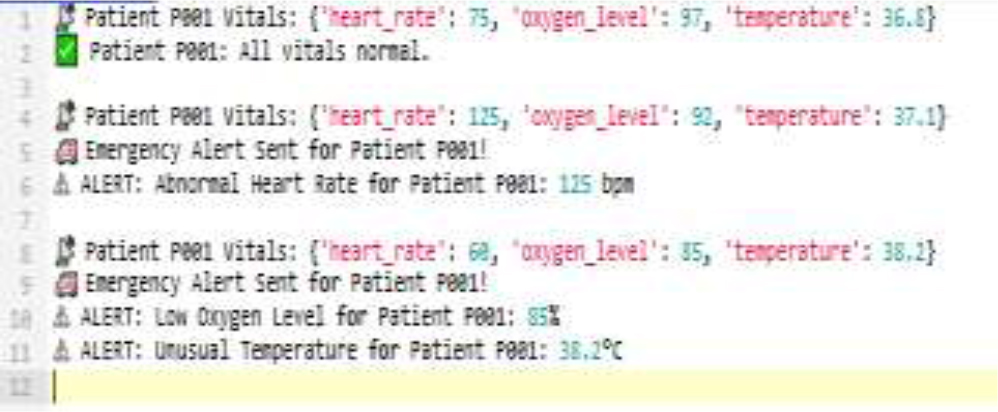
Figure 10.
Output of Pseudo-Code for autonomous Vehicle Edge Processing.
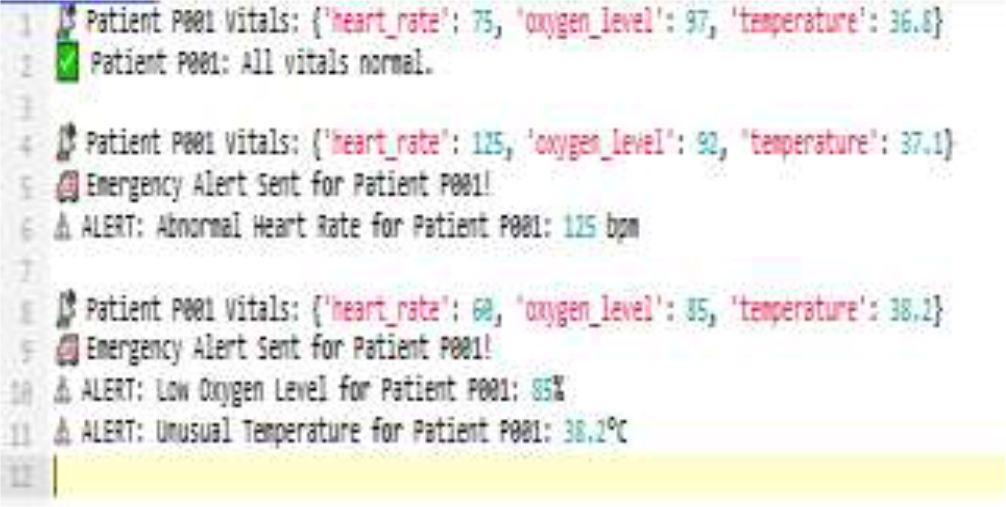
Figure 11.
Output of pseudo-code for Remote Health Monitoring.
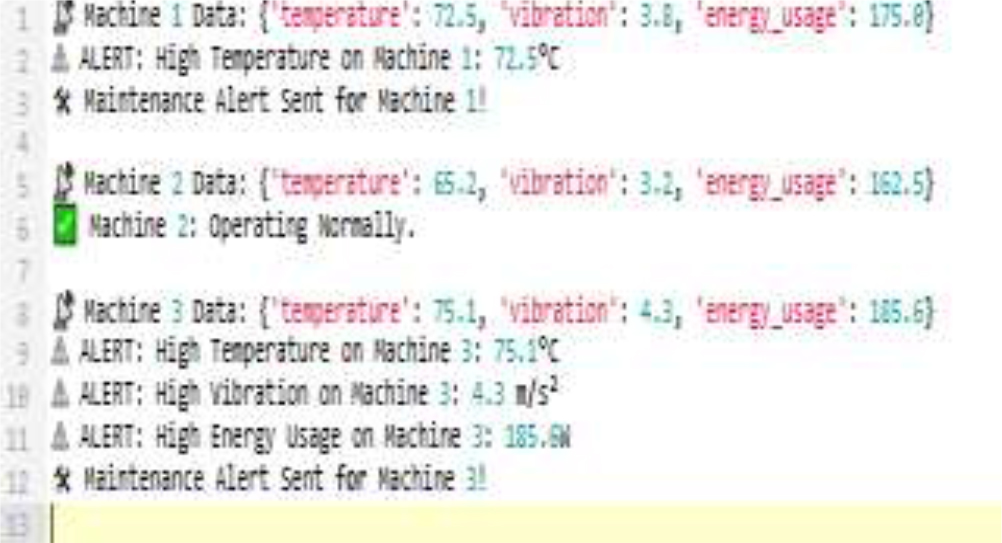
Figure 12.
Output of pseudocode for industrial automation.
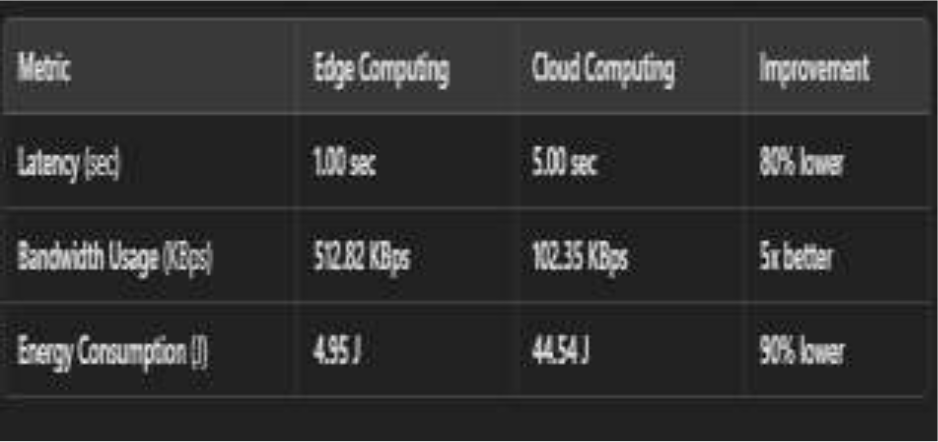
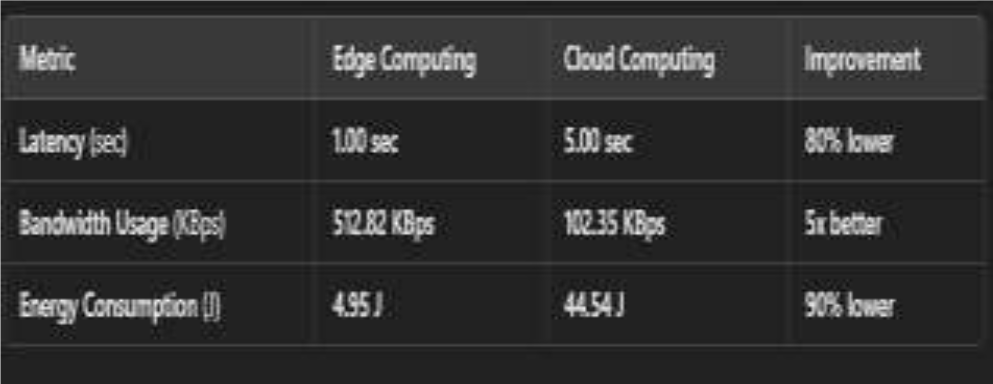
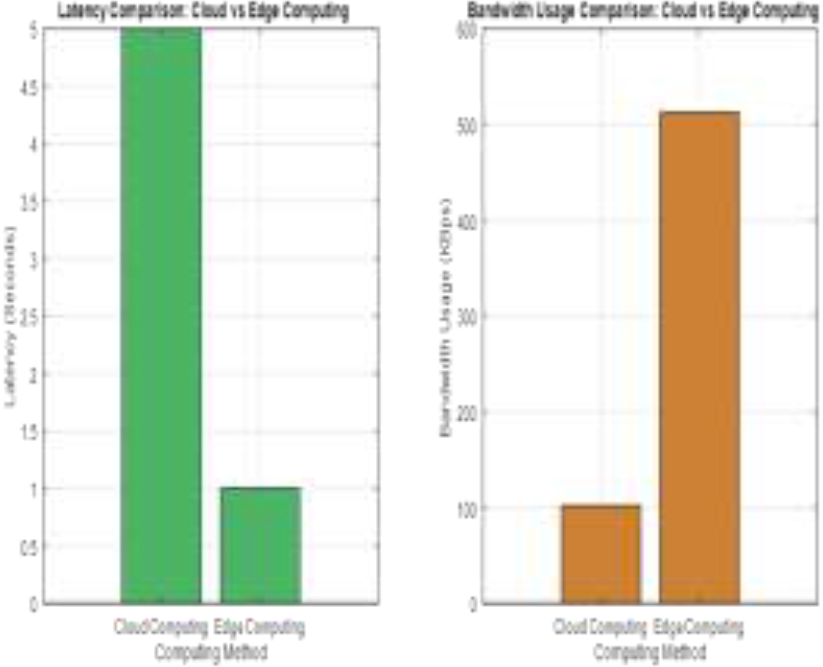
Figure 13.
Latency and Bandwidth Comparison
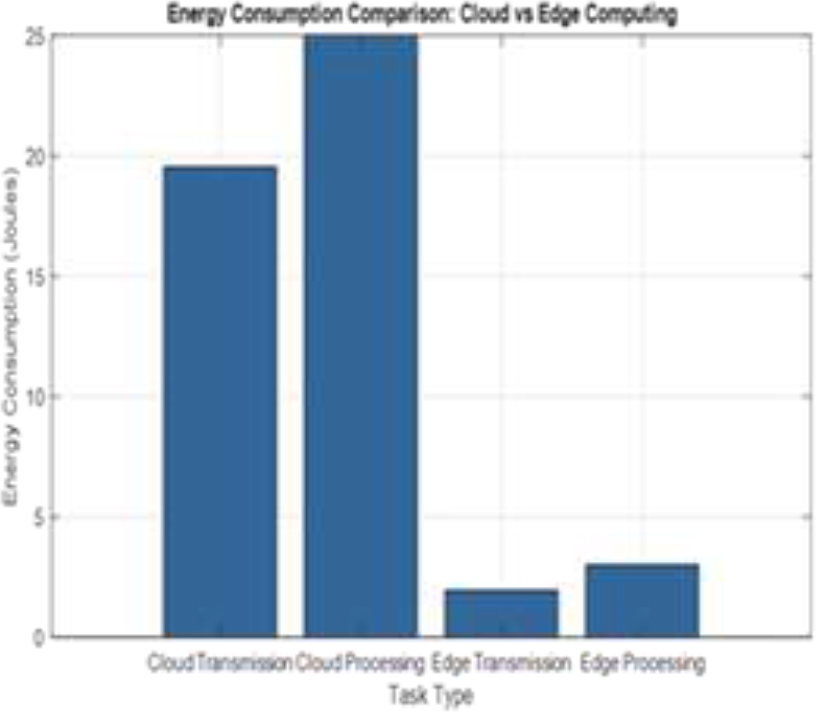
Figure 14.
Energy consumption Comparison
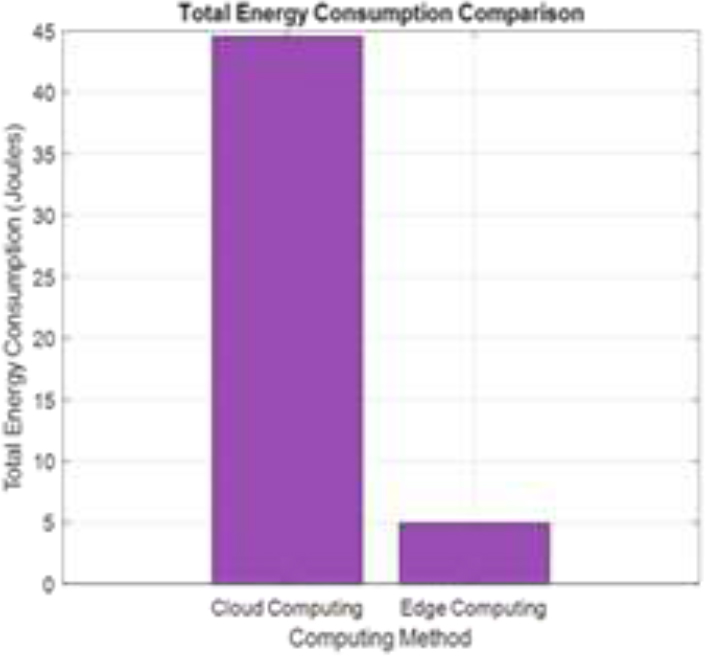
Figure 15.
Total Energy consumption Comparison