
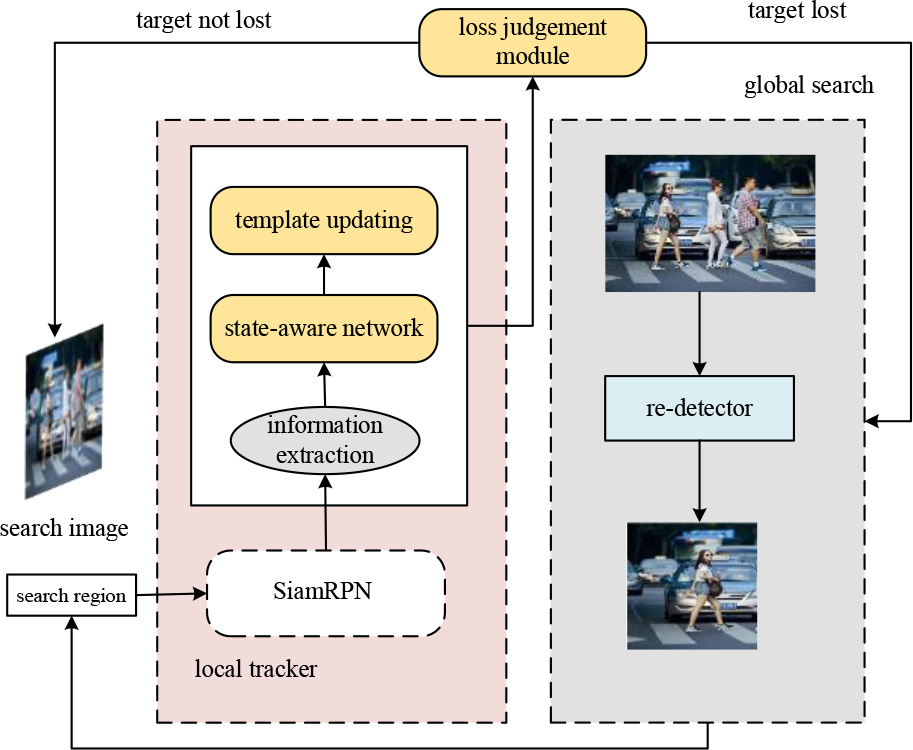
Figure 1.
Block diagram of long-term target tracking algorithm
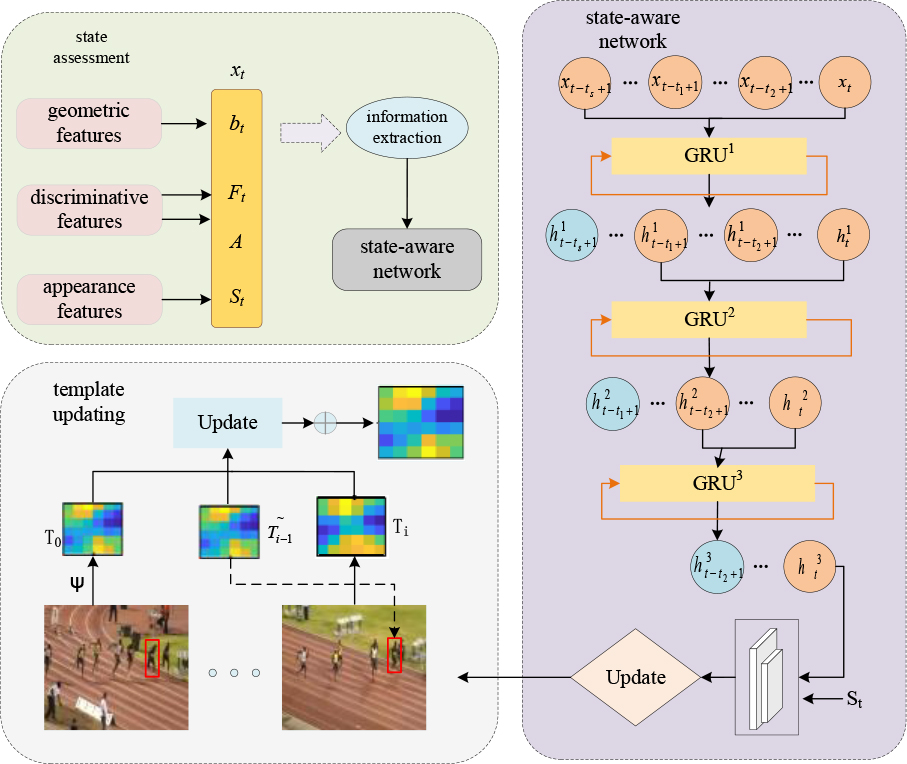
Figure 2.
Template updater based on state judgment
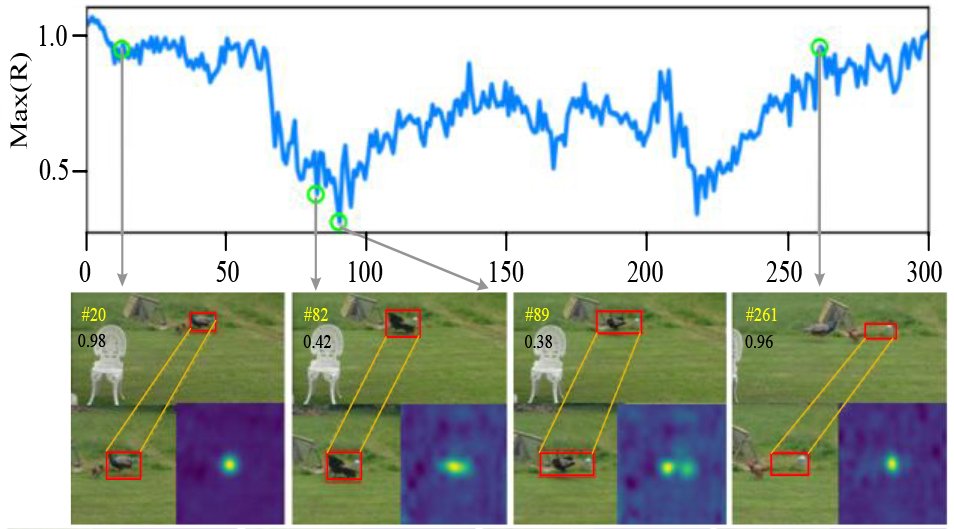
Figure 3.
Confidence score chart
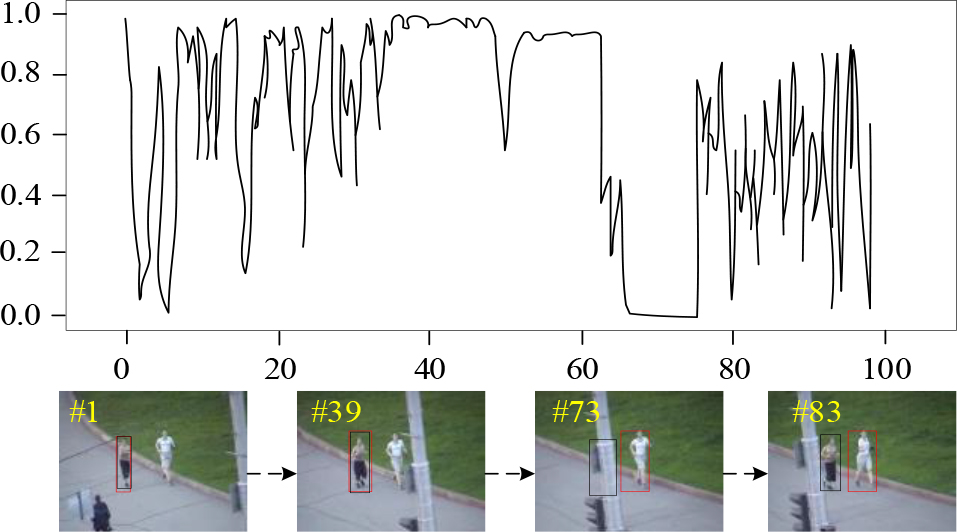
Figure 4.
SiamRPN tracking results
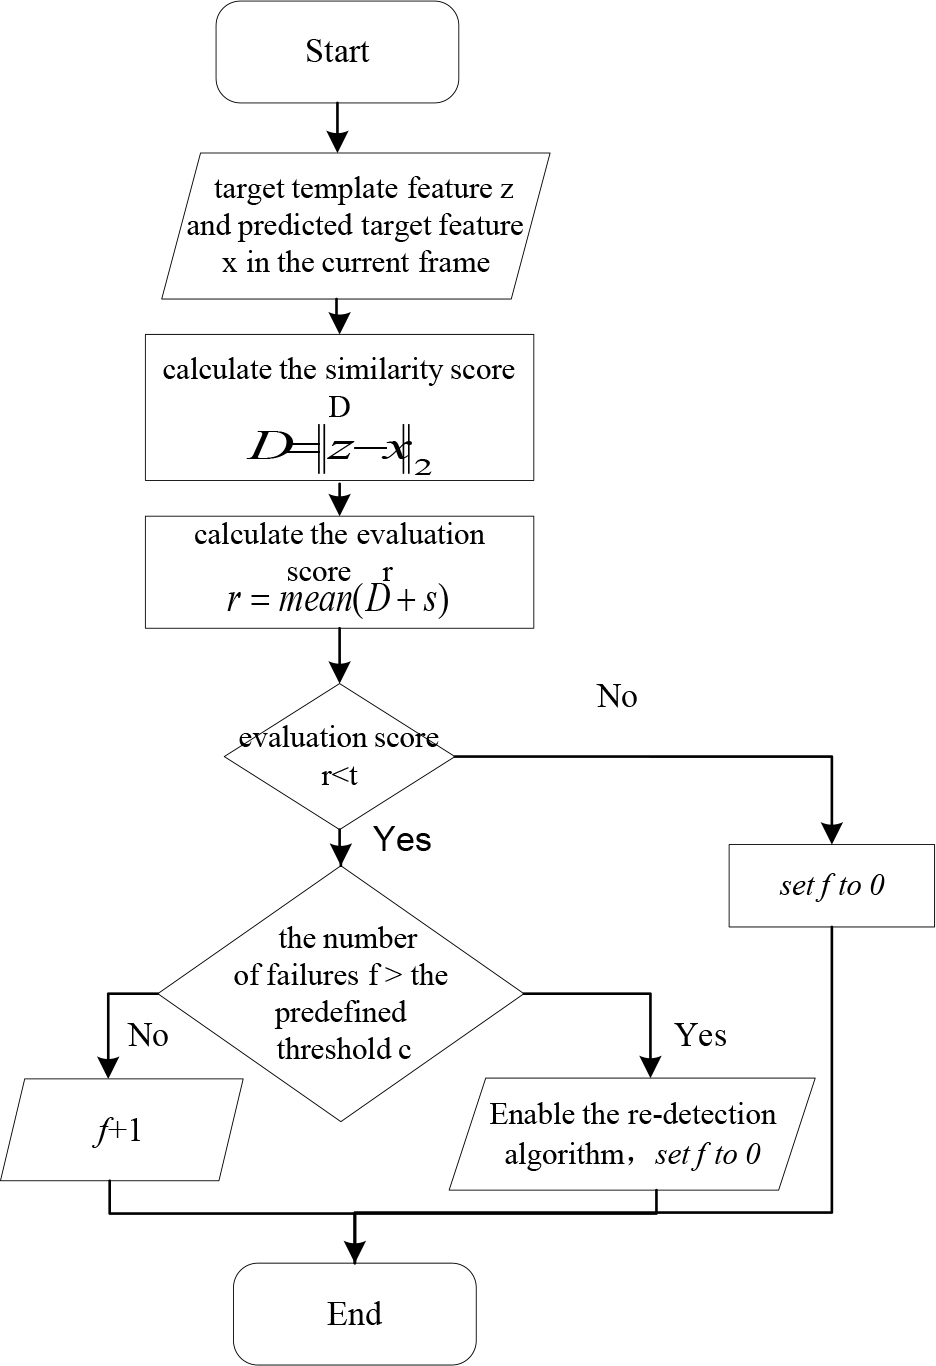
Figure 5.
Flow chart of target loss judgment mechanism
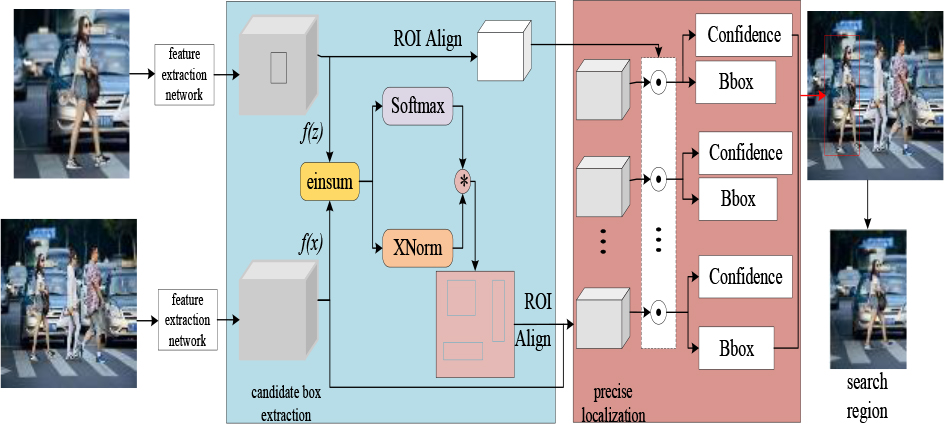
Figure 6.
Template-based re-detection algorithm
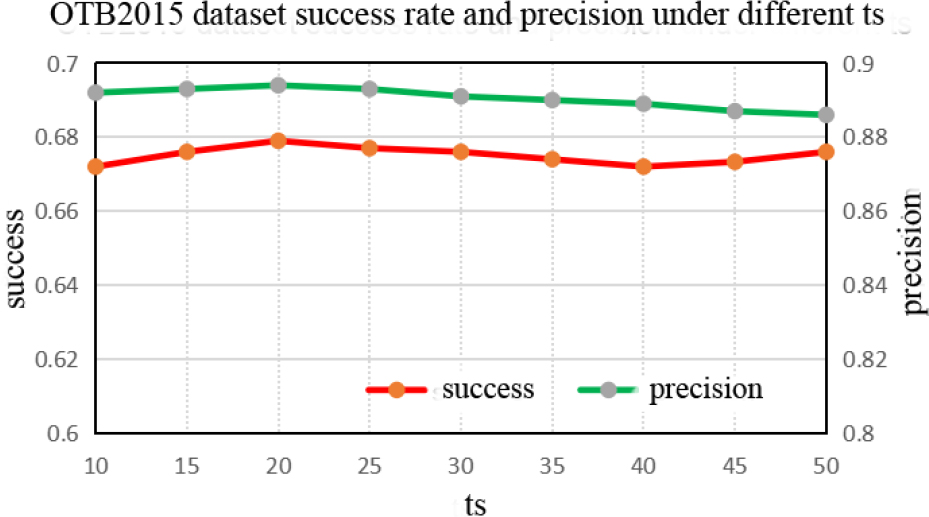
Figure 7.
Different ts corresponding success rates and accuracy
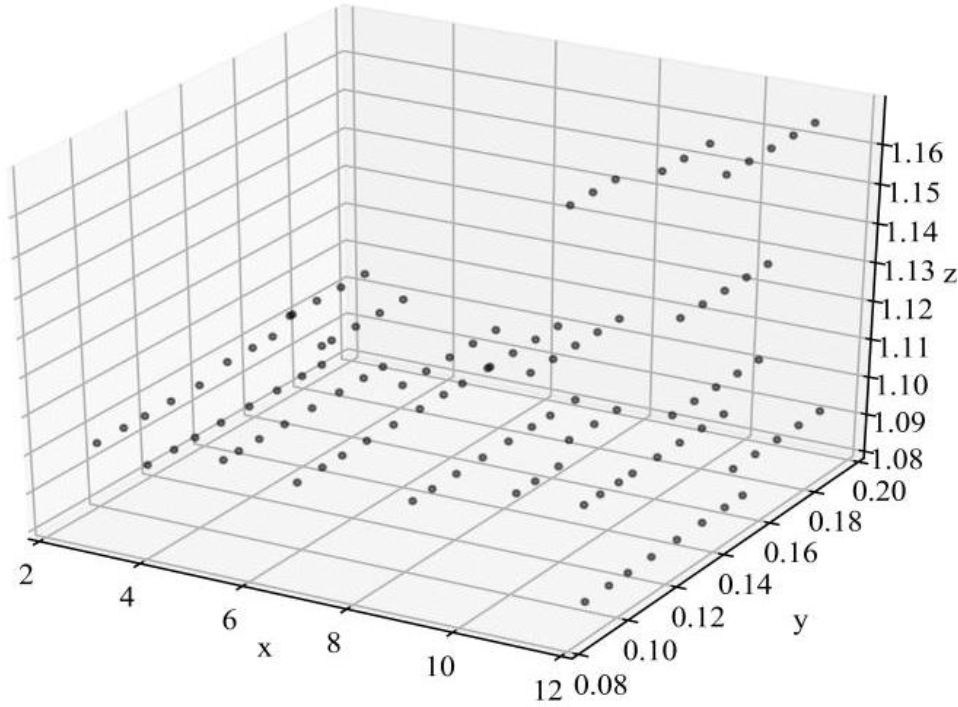
Figure 8.
Results of parameter optimization
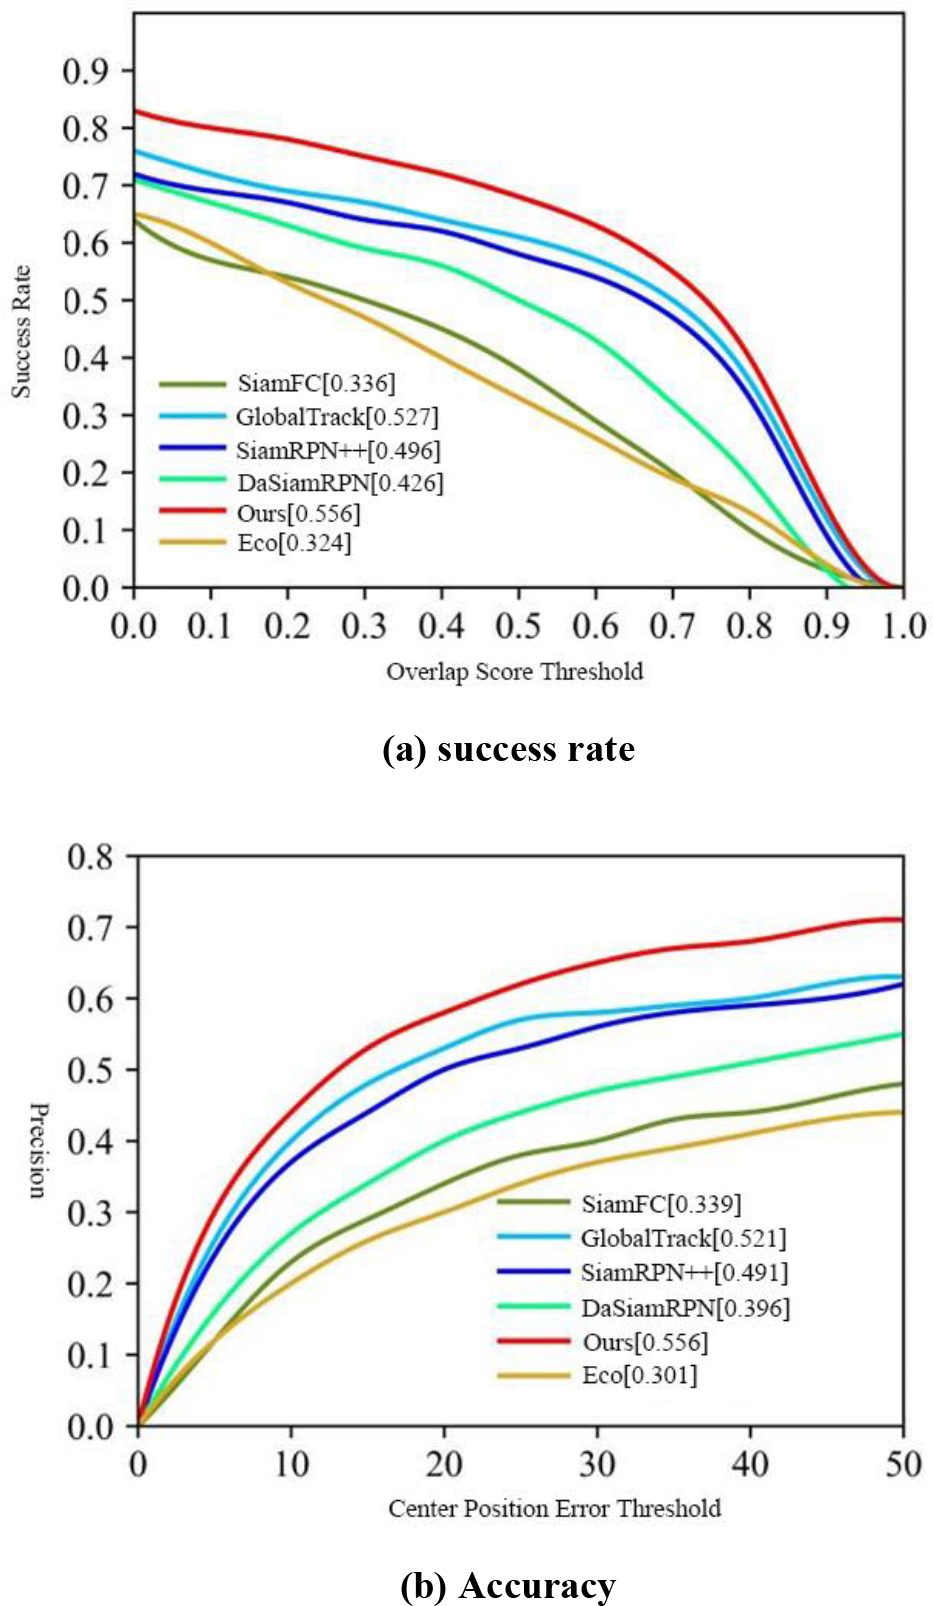
Figure 9.
Diagram of LaSOT experimental results
TABLE I.
Experimental Results on VOT2018_LT
| Algorithm | F-value | Accuracy | Frame rate | Recall rate |
|---|---|---|---|---|
| SiamFC | 0.429 | 0.628 | 84 | 0.323 |
| MBMD | 0.613 | 0.636 | 4 | 0.576 |
| DASiamRPN_LT | 0.604 | 0.625 | 63 | 0.585 |
| SPLT | 0.614 | 0.629 | 26 | 0.602 |
| SiamRPN++ | 0.625 | 0.646 | 35 | 0.606 |
| Ours | 0.644 | 0.659 | 28 | 0.626 |
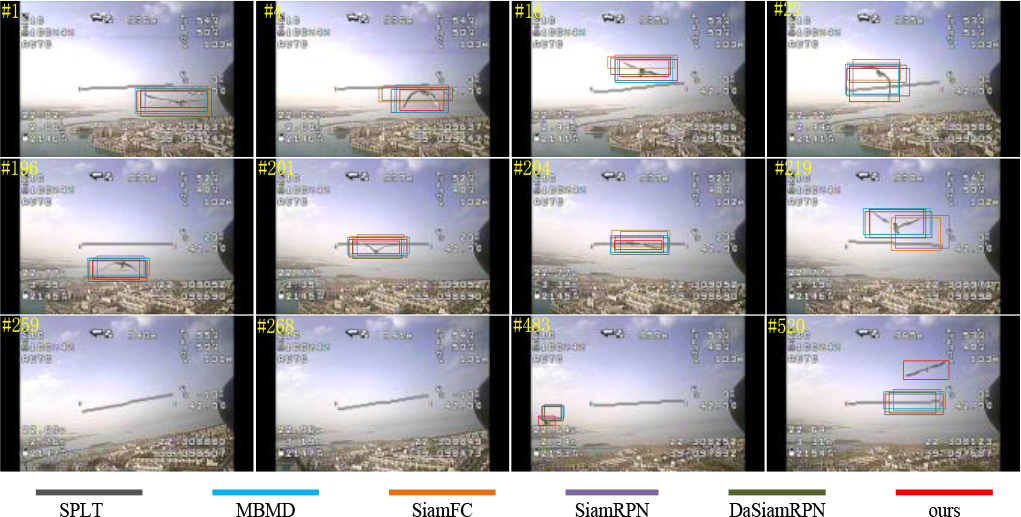
Figure 10.
Results of qualitative analysis of bird1 video sequence
TABLE II.
Introduction of 2 groups of video sequences
| Video Sources | Name | Number of frames | Type of challenge |
|---|---|---|---|
| VOT2018_LT | Yamaha | 3143 | Out of sight, occlusion, deformation |
| VOT2018_LT | bird1 | 2437 | Analogue interference, out of view, blocking |
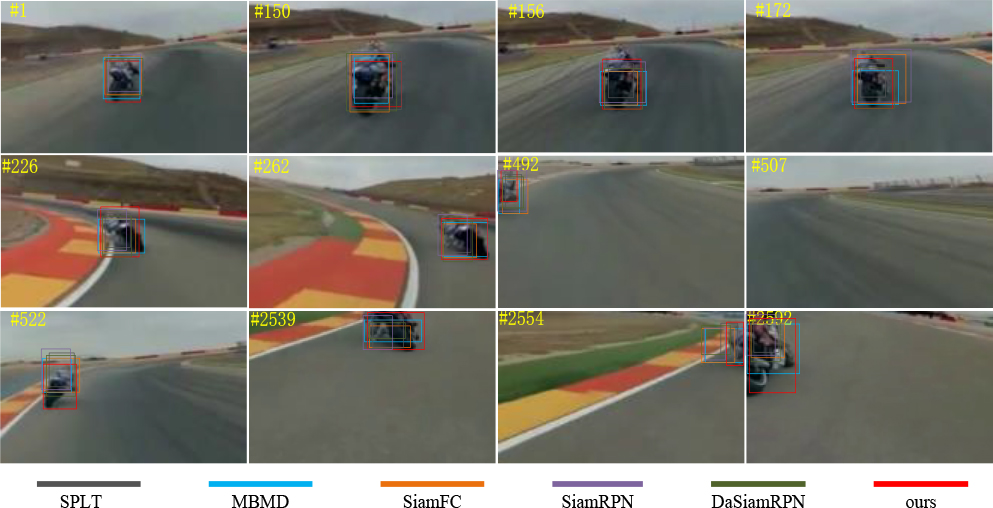
Figure 11.
yamaha video sequence qualitative analysis results
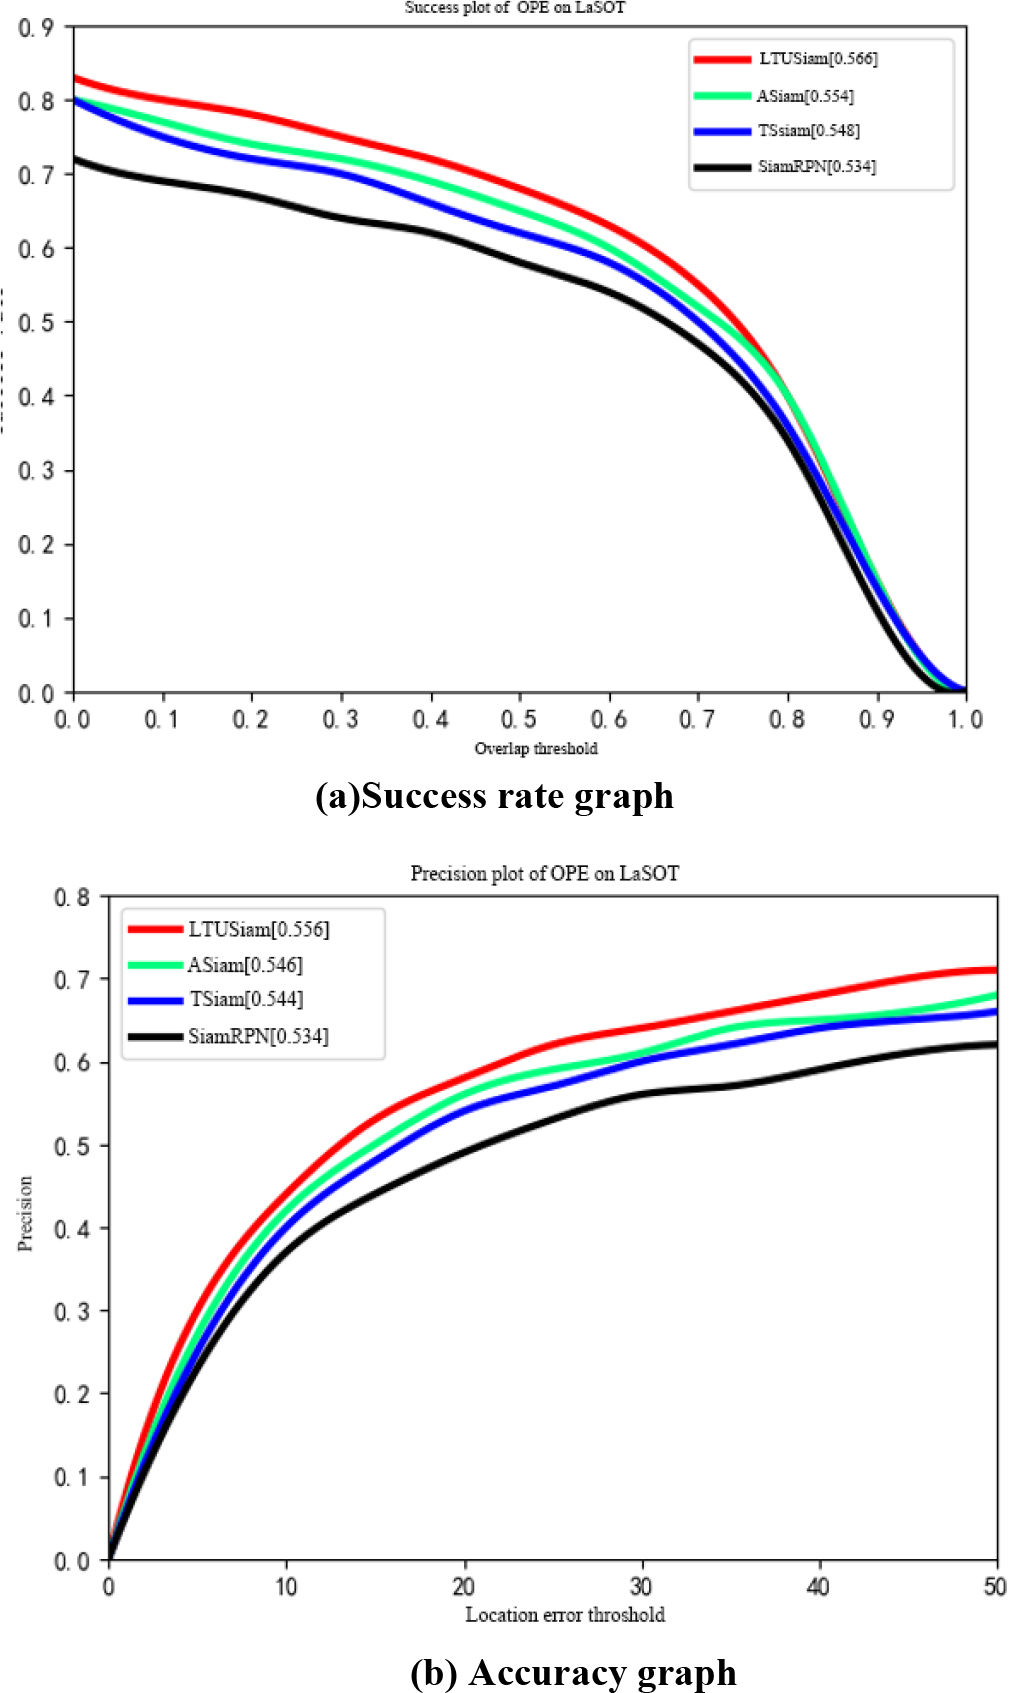
Figure 12.
Ablation experiment results