
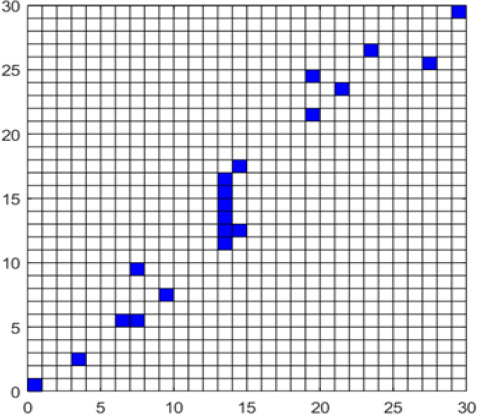
Figure 1.
Raster map model
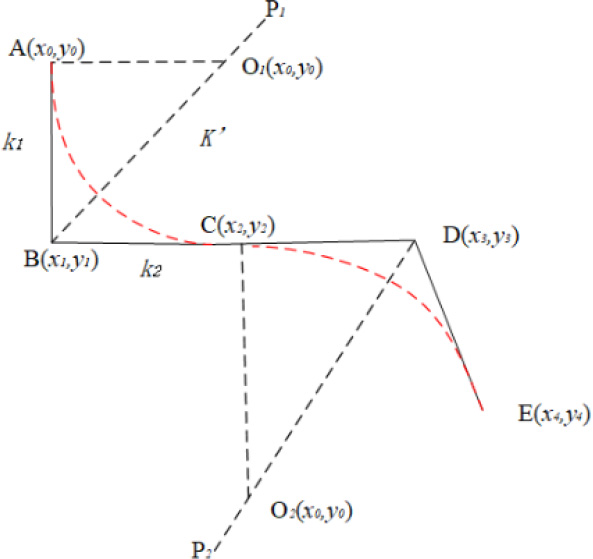
Figure 2.
A-Star algorithm smoothing processing diagram
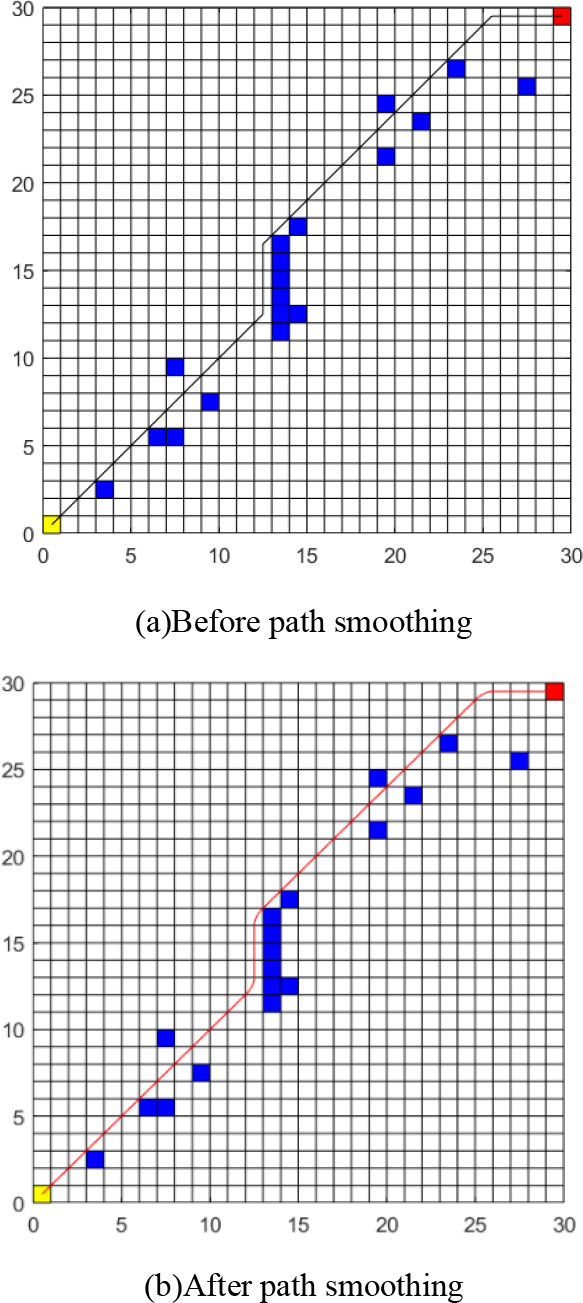
Figure 3.
A-Star algorithm path smoothing results in 30×30 environment
Table I.
Comparison of the effects of A-Star algorithm improvement
| Algorithm | Path length/m | Time for path finding/s | Number of expansion nodes | Is there a turning point |
|---|---|---|---|---|
| A-Star | 22.42 | 5.9 | 166 | Yes |
| Improved A-Star | 21.56 | 5.5 | 59 | No |
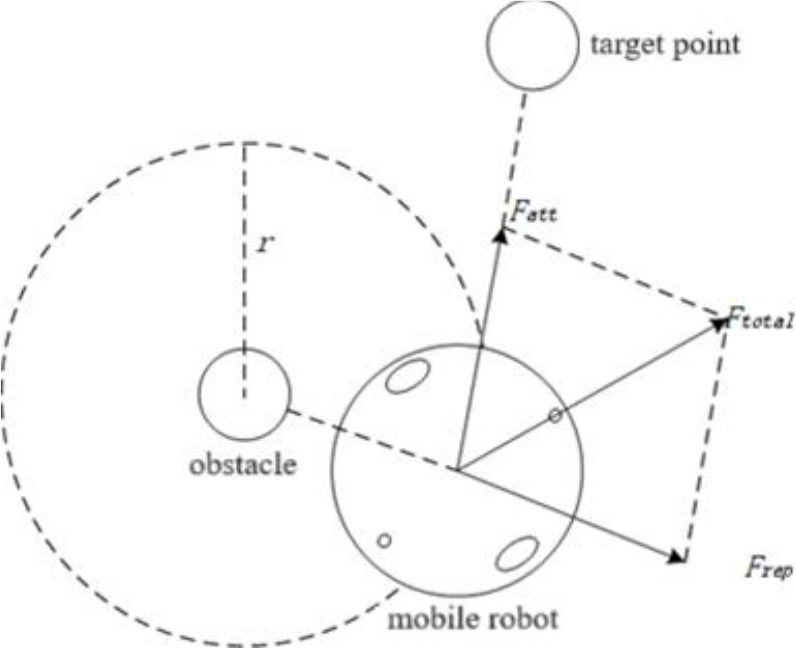
Figure 4.
Force analysis diagram of mobile robot
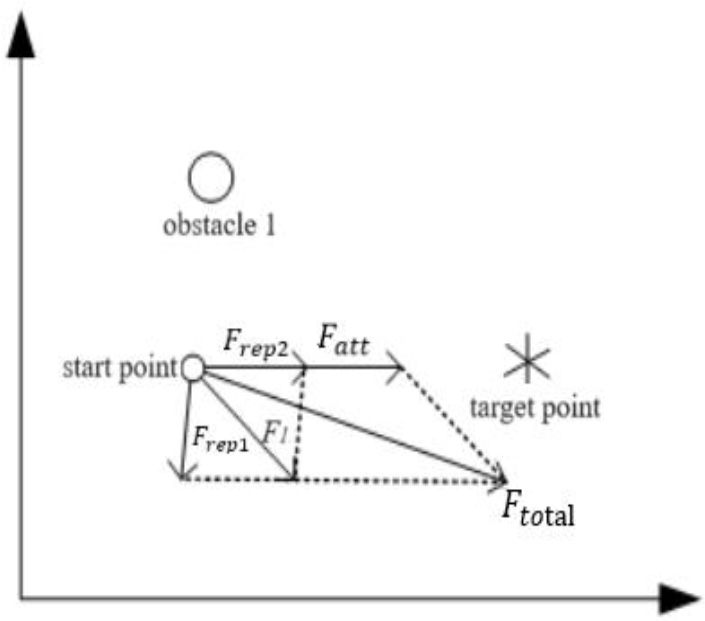
Figure 5.
Modified repulsion field parameters force analysis
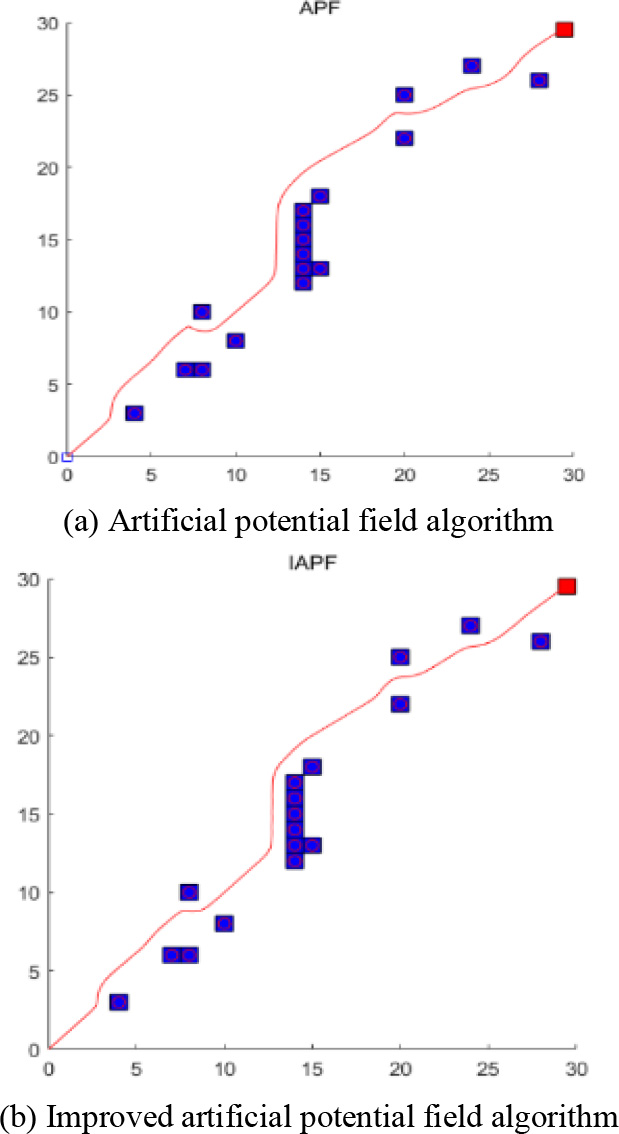
Figure 6.
Path planning comparison
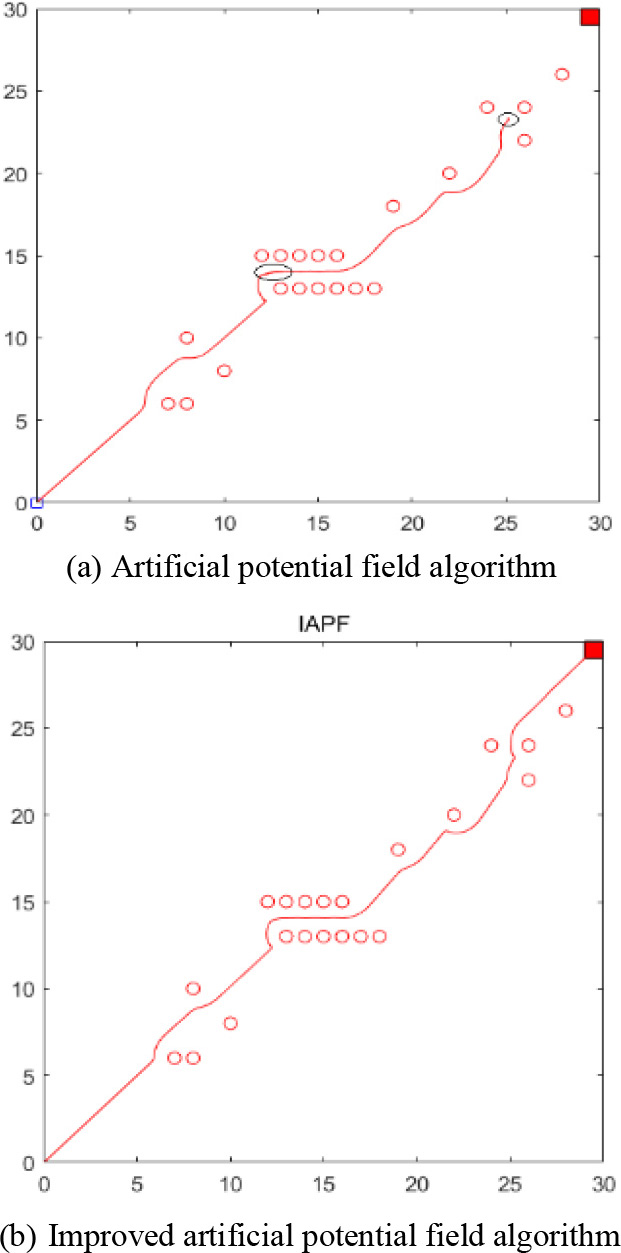
Figure 7.
Complex obstacle test comparison
Table II.
Comparison results of improved algorithm
| Experiment Name | Algorithm | Path length/m | Run time/s | Number of cycles |
|---|---|---|---|---|
| Path planning testing | APF | 49.970710 | 6.186677 | 447 |
| IAPF | 48.003037 | 5.430491 | 440 | |
| Complex obstacle testing | APF | ∞ | ∞ | ∞ |
| IAPF | 51.519690 | 6.801836 | 451 |
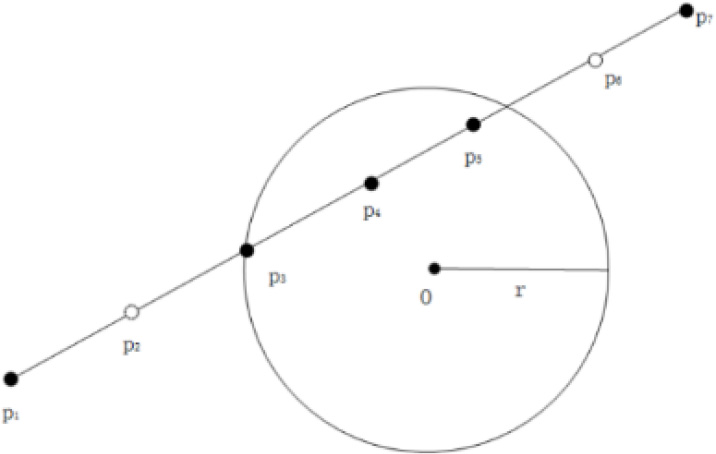
Figure 8.
Hybrid algorithm model diagram
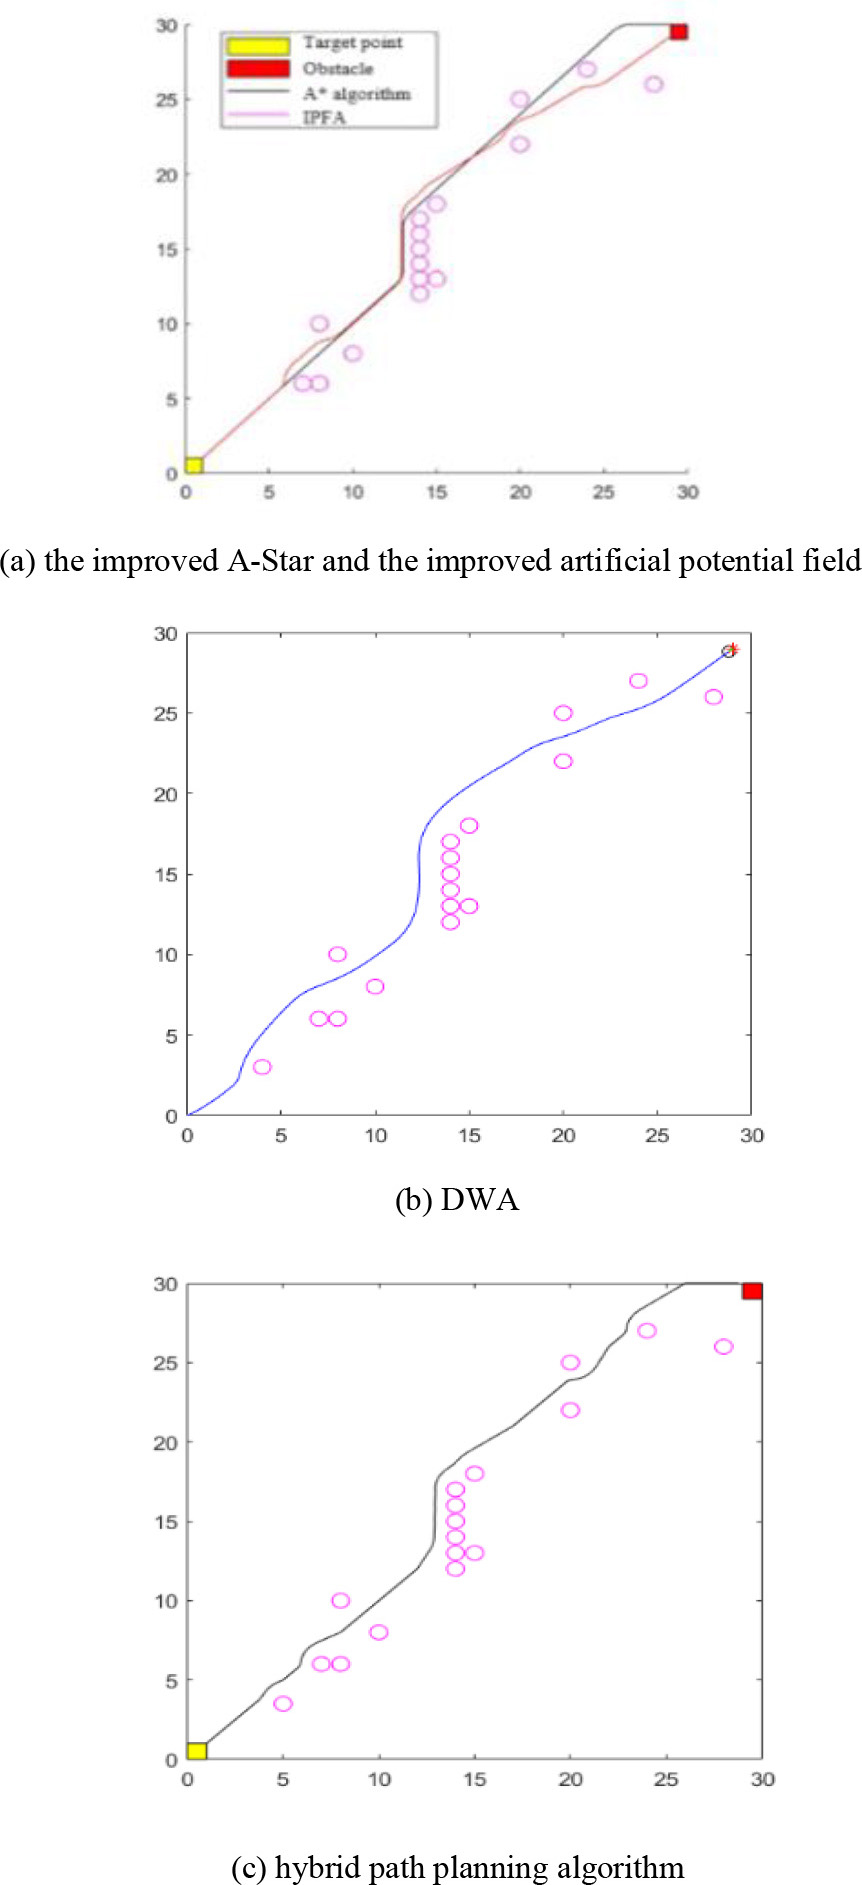
Figure 9.
Static path comparison diagram
Table III.
Algorithm comparison in static environment
| Algorithm | Path length/m | Search time/s | Does the algorithm have the ability to handle dynamic obstacles |
|---|---|---|---|
| A-Star | 45.36 | 6.72 | No |
| IAPF | 48.00 | 10.43 | Yes |
| DWA | 48.86 | 28.21 | Yes |
| Hybrid algorithm | 46.54 | 8.14 | Yes |
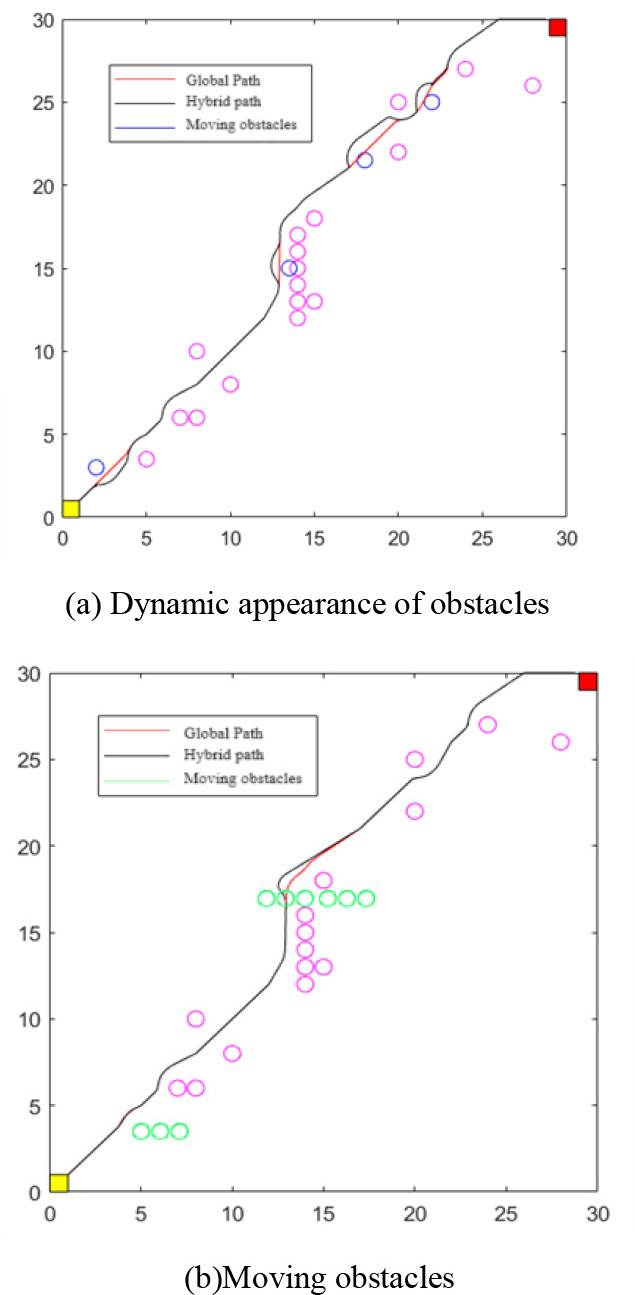
Figure 10.
Dynamic path planning diagram
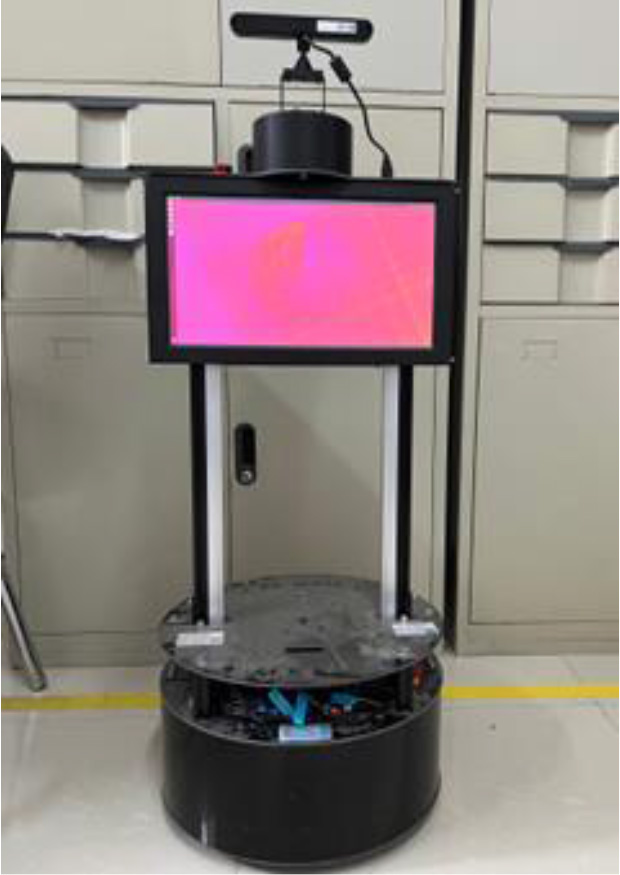
Figure 11.
Hands-free robot platform
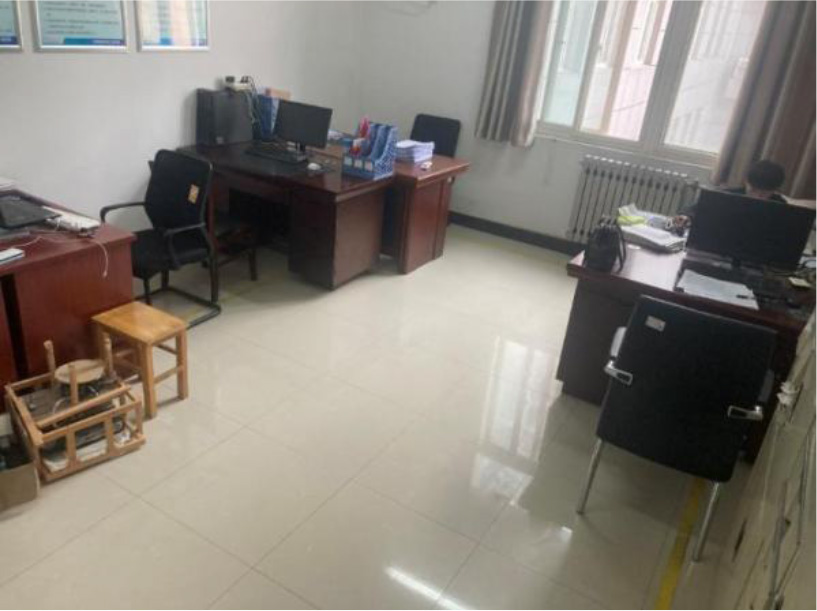
Figure 12.
Actual test scenario
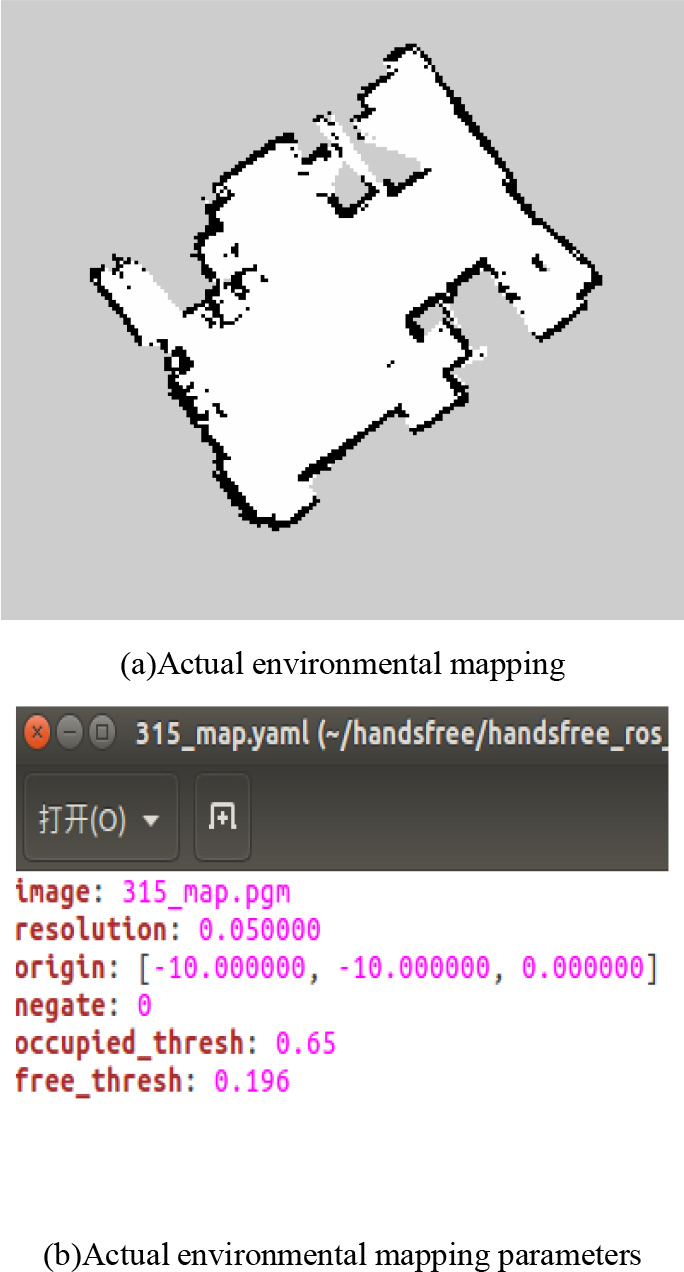
Figure 13.
Actual scene construction effect
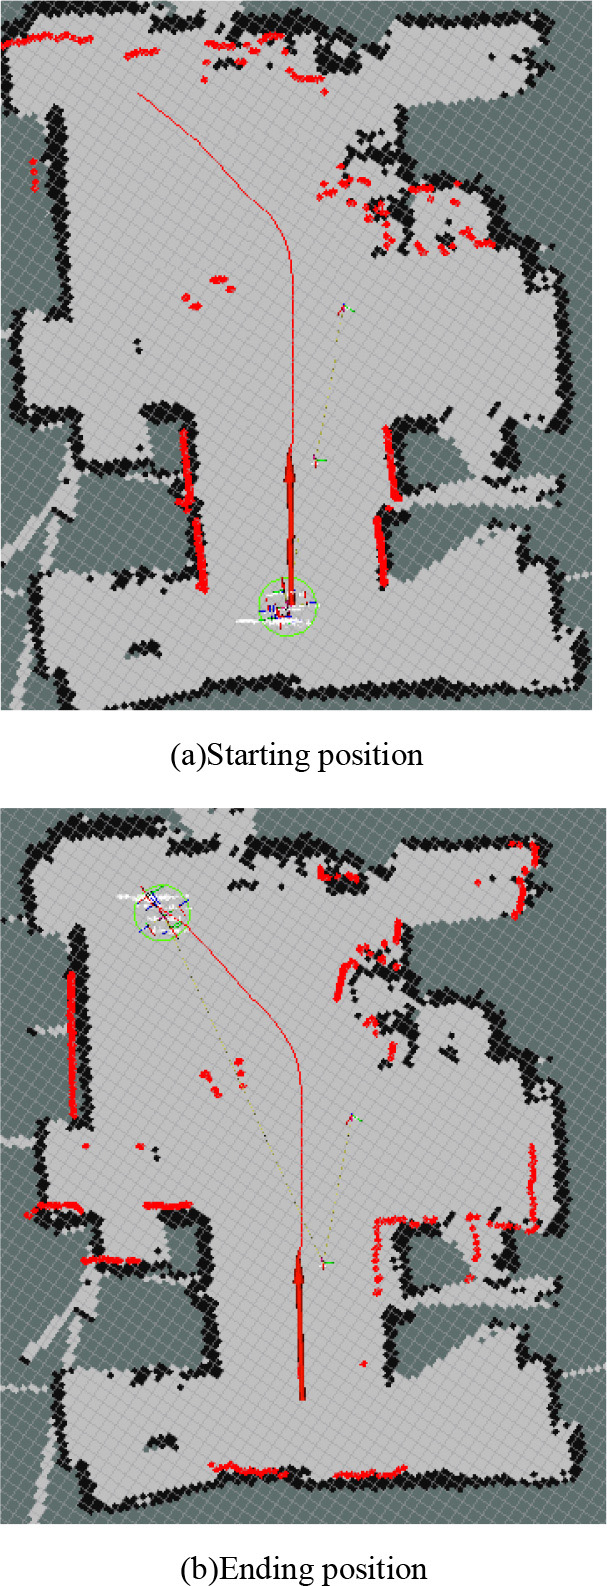
Figure 14.
A-Star Hybrid DWA algorithm path planning
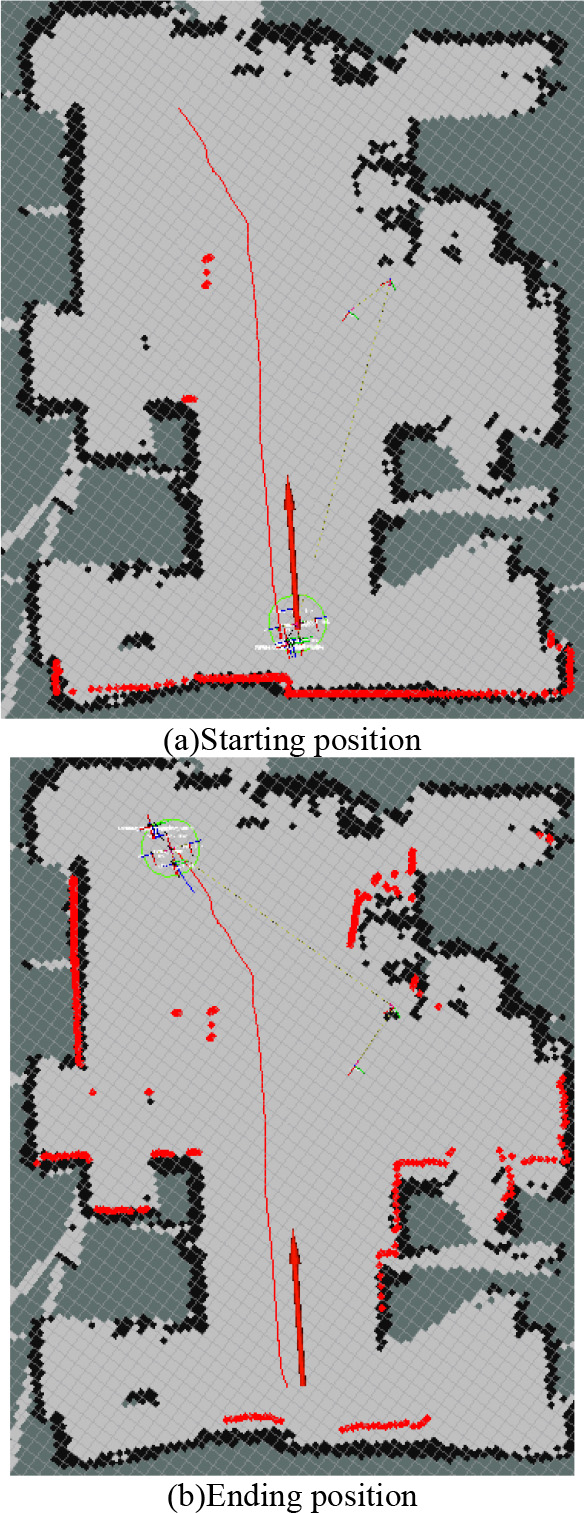
Figure 15.
Improved A-Star hybrid improved artificial potential field algorithm