
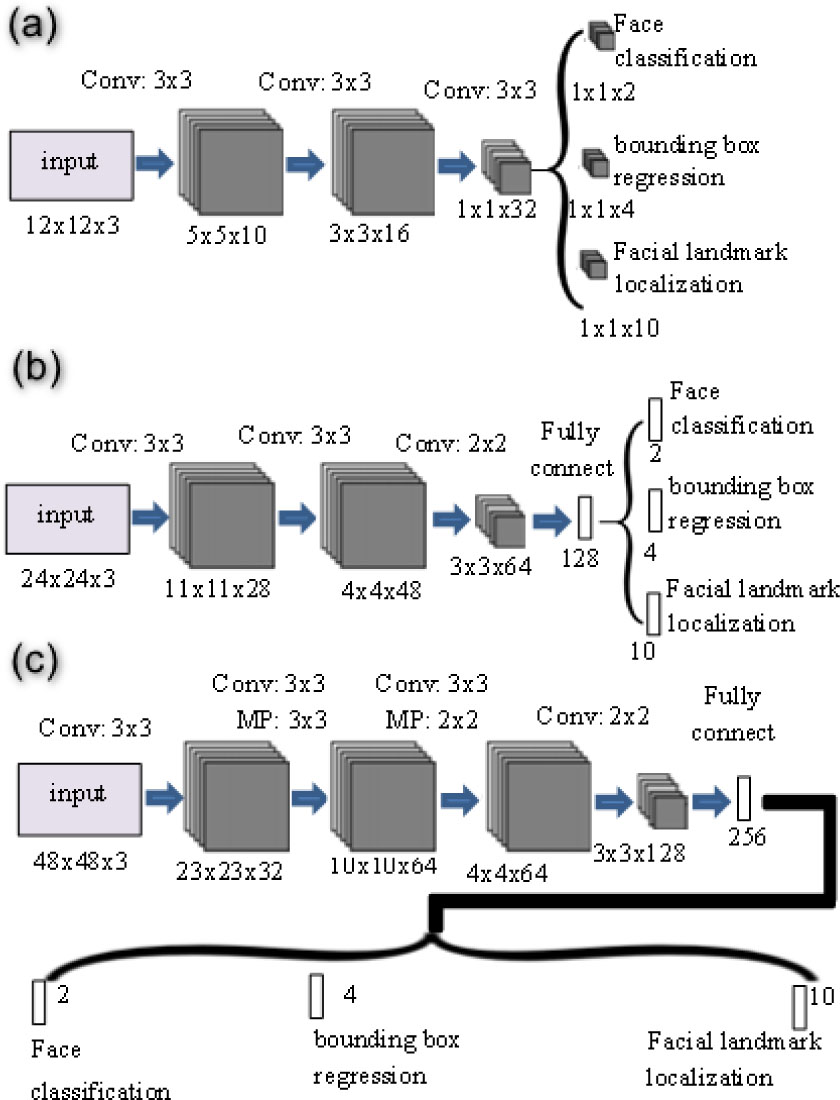
Figure 1.
MTCNN's architecture: (a) P-Net (b) R-Net and (c) O-Net
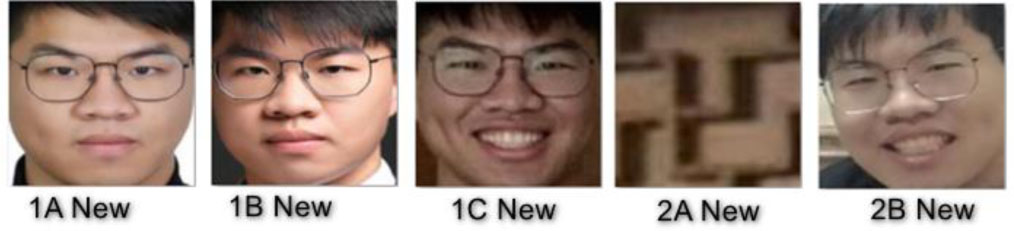
Figure 2.
Examples of corrupt data from MTCNN
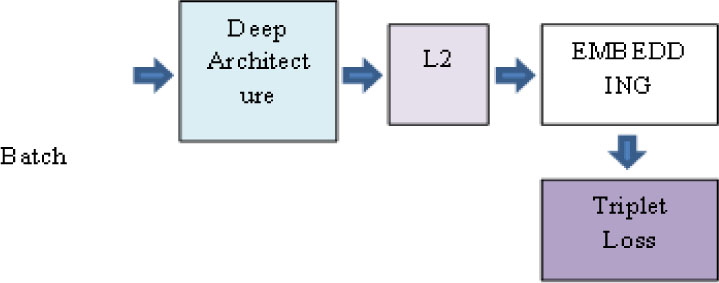
Figure 3.
FaceNet's high level model structure
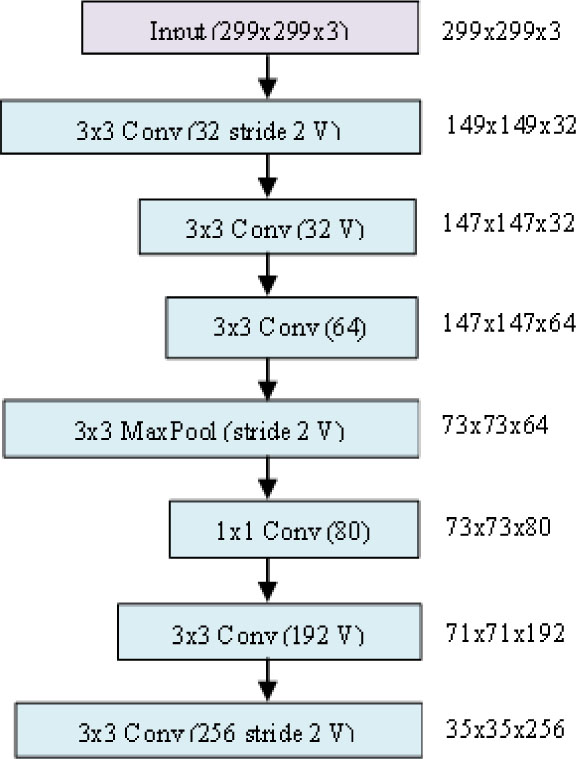
Figure 4.
Inception-ResNet
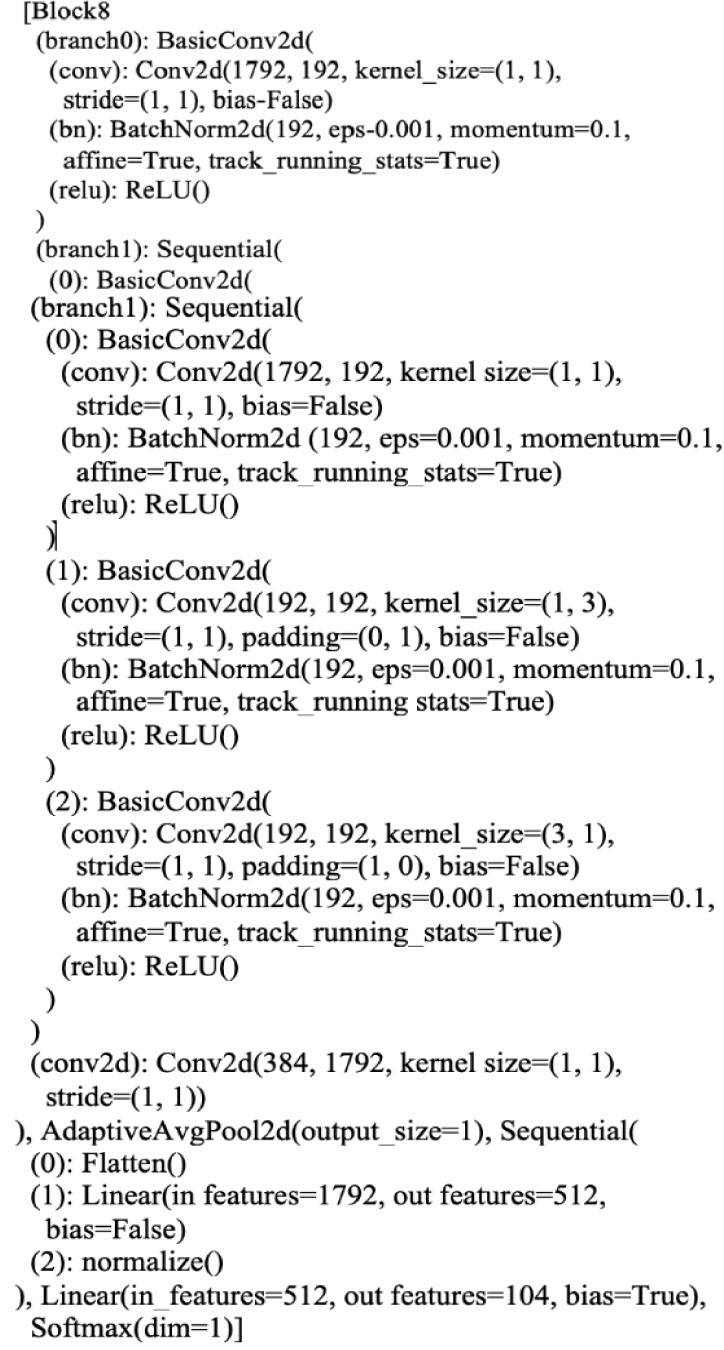
Figure 5.
Six-final layers
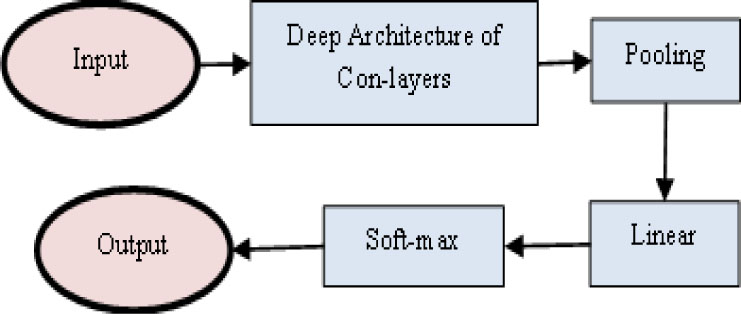
Figure 6.
A-ResNet Architecture
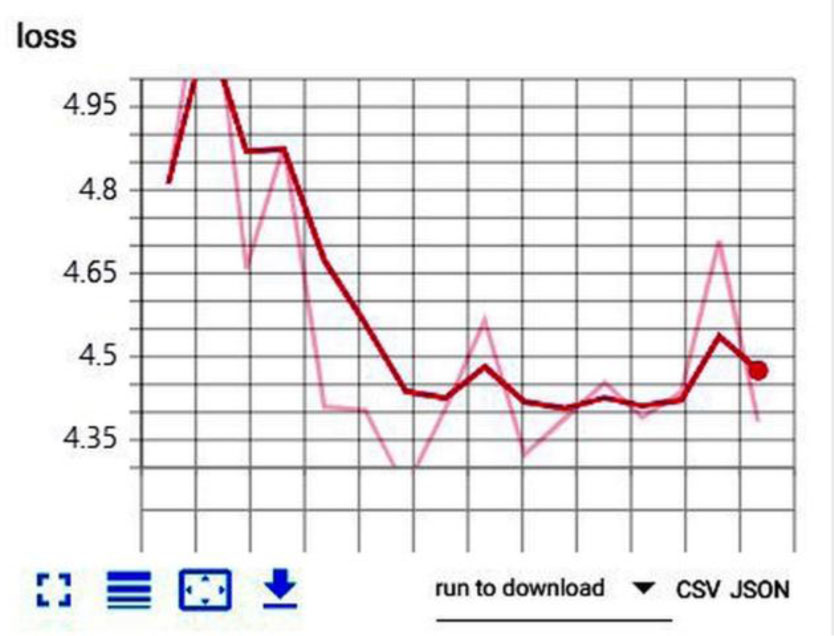
Figure 7.
RMS tracking loss in TensorboradX
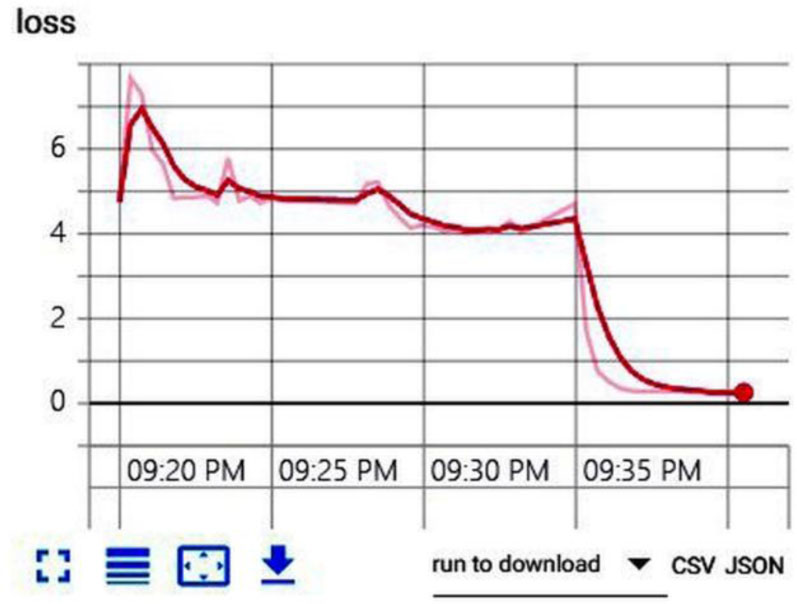
Figure 8.
Adam tracking loss in TensorboradX
TABLE II.
Records of combination for ResNet
| Epochs | Batch size | True Positive | Train FPS |
|---|---|---|---|
| 10 | 16 | 20 | 426.4 |
| 24 | 16 | 25 | 421.7 |
| 24 | 32 | 40 | 278.6 |
| 24 | 64 | 74 | 151.2 |
| 32 | 64 | 70 | 160.7 |
| 24 | 128 | 79 | 148.9 |
| 32 | 128 | 76 | 232.4 |
| 24 | 256 | 69 | 182.5 |
| 32 | 256 | 76 | 192.8 |
| 64 | 256 | 75 | 154.3 |
TABLE III.
Records of combination for A-ResNet
| Epochs | Batch size | True Positive | Train FPS |
|---|---|---|---|
| 24 | 64 | 70 | 151.9 |
| 24 | 128 | 81 | 170.4 |
| 32 | 128 | 85 | 254.4 |
| 32 | 256 | 76 | 209.8 |
| 64 | 256 | 76 | 194.3 |
TABLE VI.
Recognition rate based on LFW database
| Recognition | Correct Times | Wrong Times | Correct Image Accuracy | Incorrect Image Accuracy |
|---|---|---|---|---|
| At 15 pixels | 84 | 20 | 80.76% | 19.24% |
| At 20 pixels | 86 | 18 | 82.69% | 17.31% |
| At 30 pixels | 88 | 16 | 84.61% | 15.39% |
| At 35 pixels | 90 | 14 | 86.53% | 13.47% |
| At 45 pixels | 92 | 12 | 88.46% | 11.54% |
TABLE VII.
Recognition rate based on LFW database
| Recognition at 45 px | Correct Times | Wrong Times | Correct Image Accuracy | Incorrect Image Accuracy |
|---|---|---|---|---|
| Front facing | 87 | 17 | 83.65% | 16.35% |
| Facing 30’ Right | 89 | 15 | 85.57% | 14.43% |
| Facing 30’ Left | 91 | 13 | 87.50% | 12.5% |
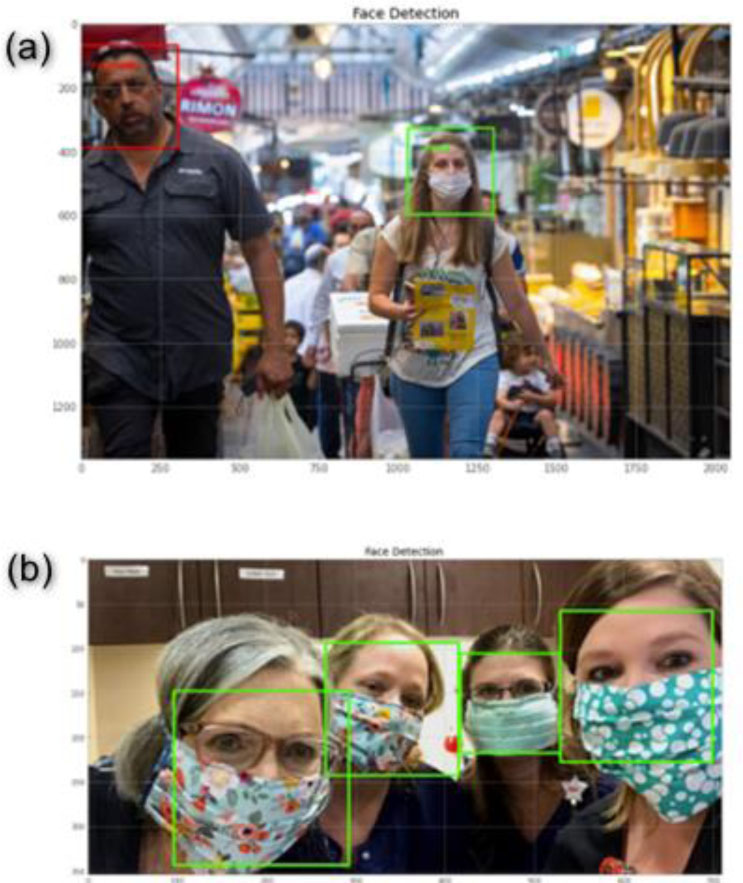
Figure 9.
System fully utilised to identify (a) faces and (b) face masks