
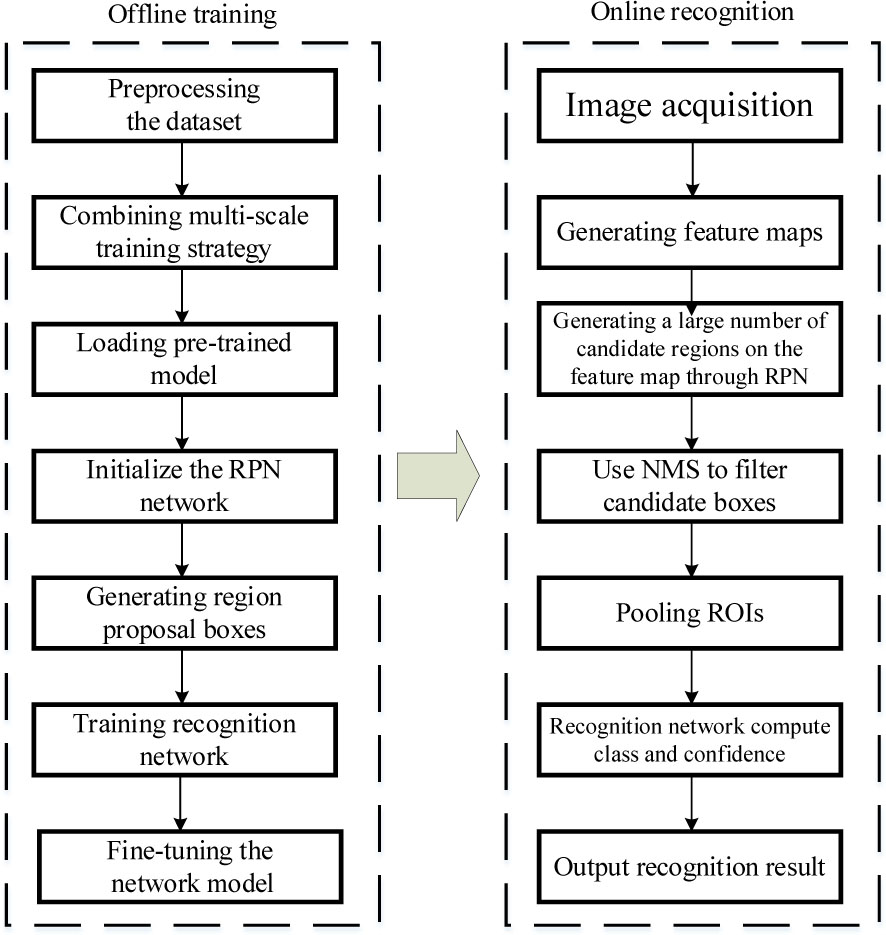
Figure 1.
Algorithm flow chart for the ship recognition.
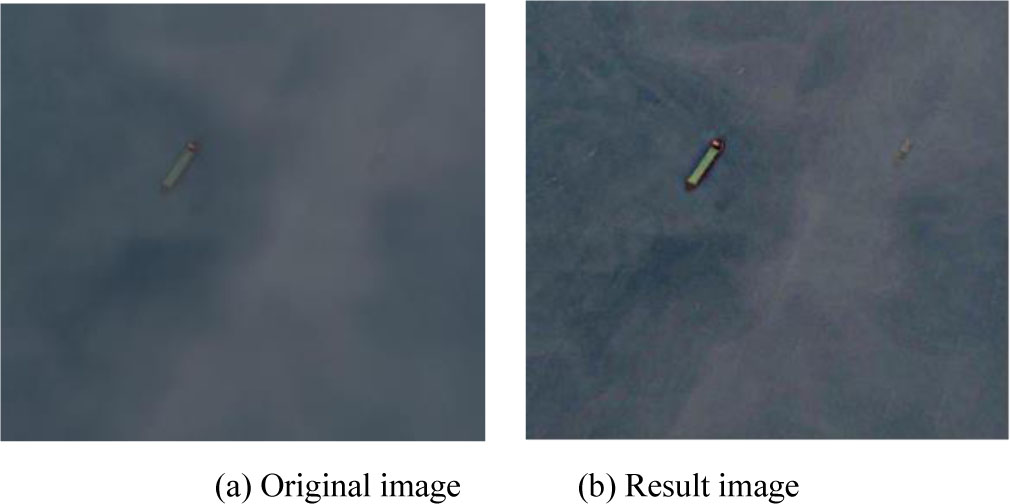
Figure 2.
Result image after defogging.
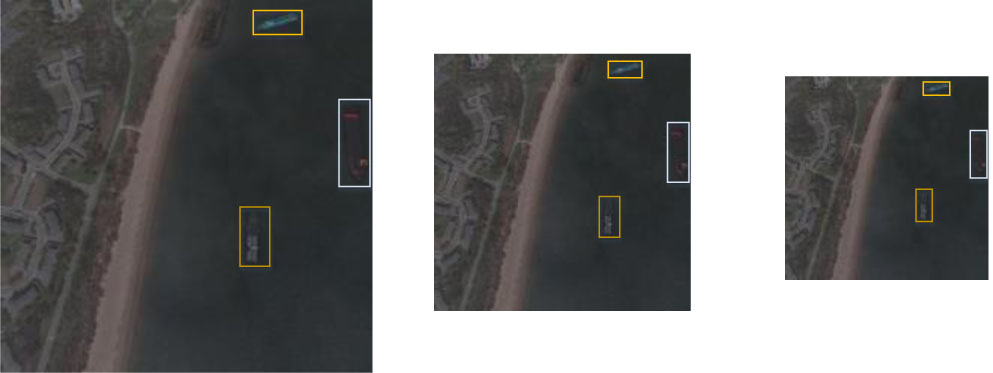
Figure 3.
Multi-scale training sample images.
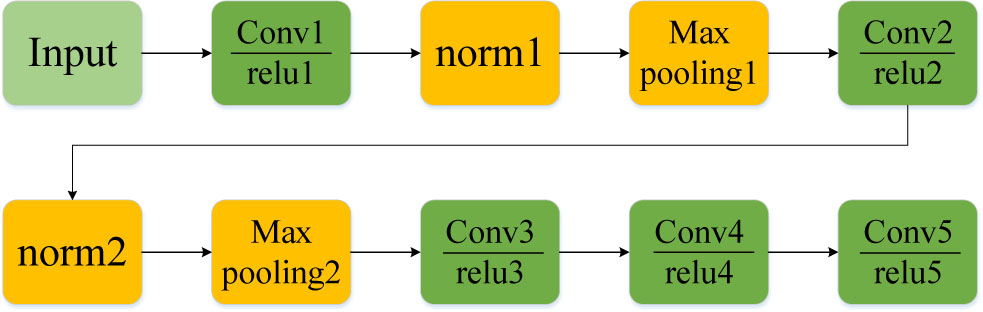
Figure 4.
Feature extraction network structure.
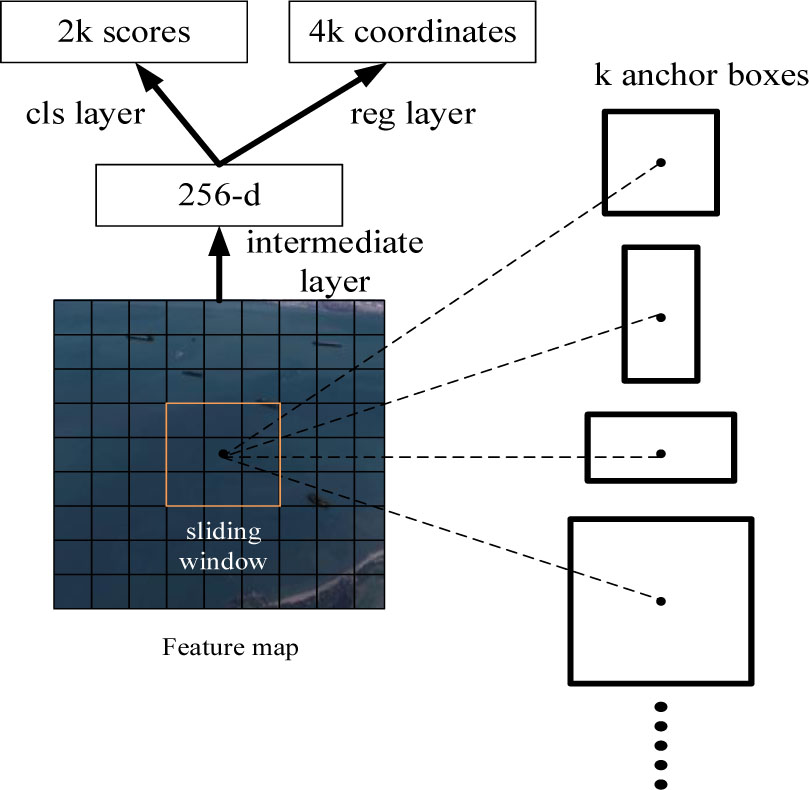
Figure 5.
Region proposal network structure.
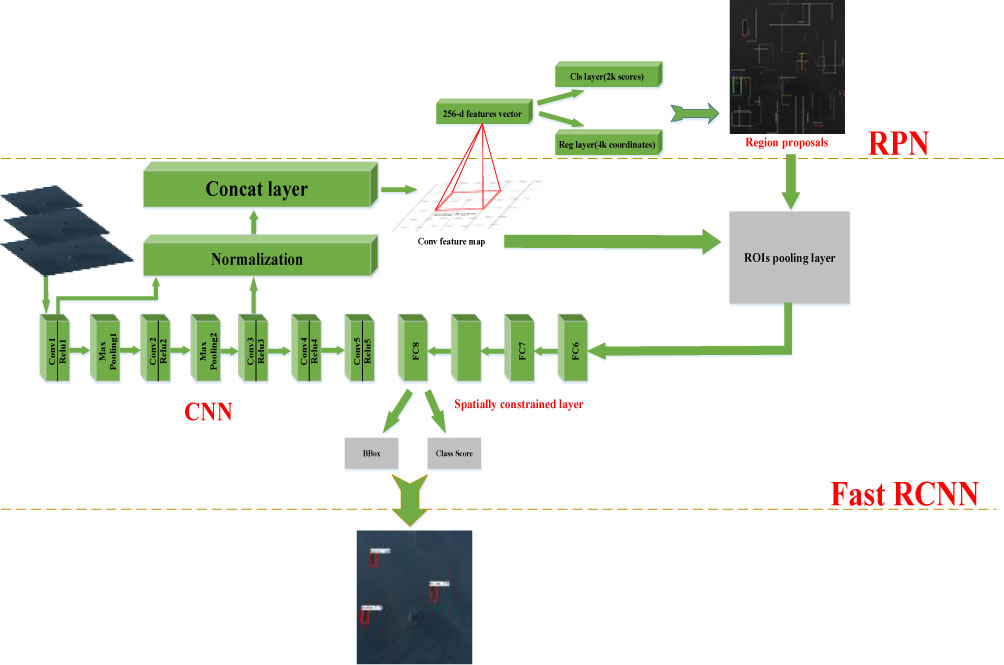
Figure 6.
The architecture of proposed multi-scale Faster R-CNN for ship recognition. The simplified CNN model is surrounded by green boxes.
TABLE I.
Faster R-CNN Training Process
| Training stage | Network | Number of iterations |
|---|---|---|
| 1 | RPN | 40000 |
| 2 | Fast RCNN | 40000 |
| 3 | RPN | 80000 |
| 4 | Fast RCNN | 40000 |
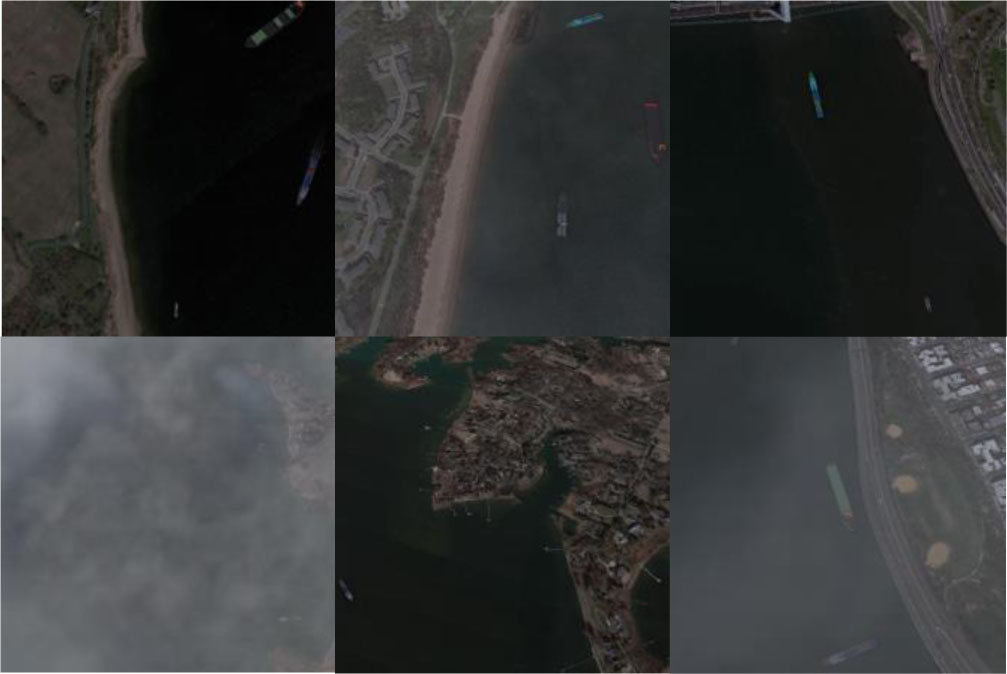
Figure 7.
Part of the sample images (huochuan is cargo ship, youlun is cruise ship, yuchuan is fishing ship, youting is yacht).
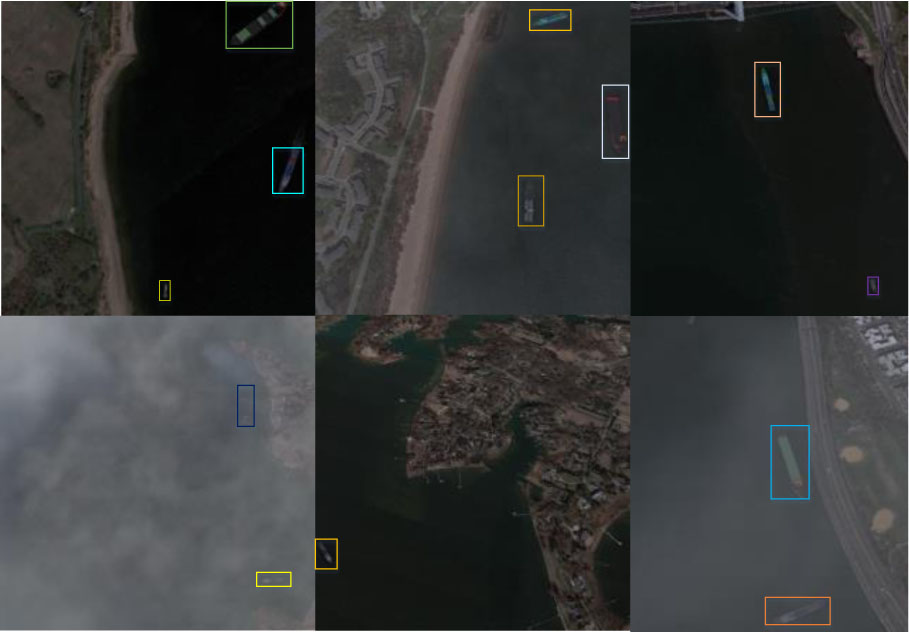
Figure 8.
The ROIs of some training samples.
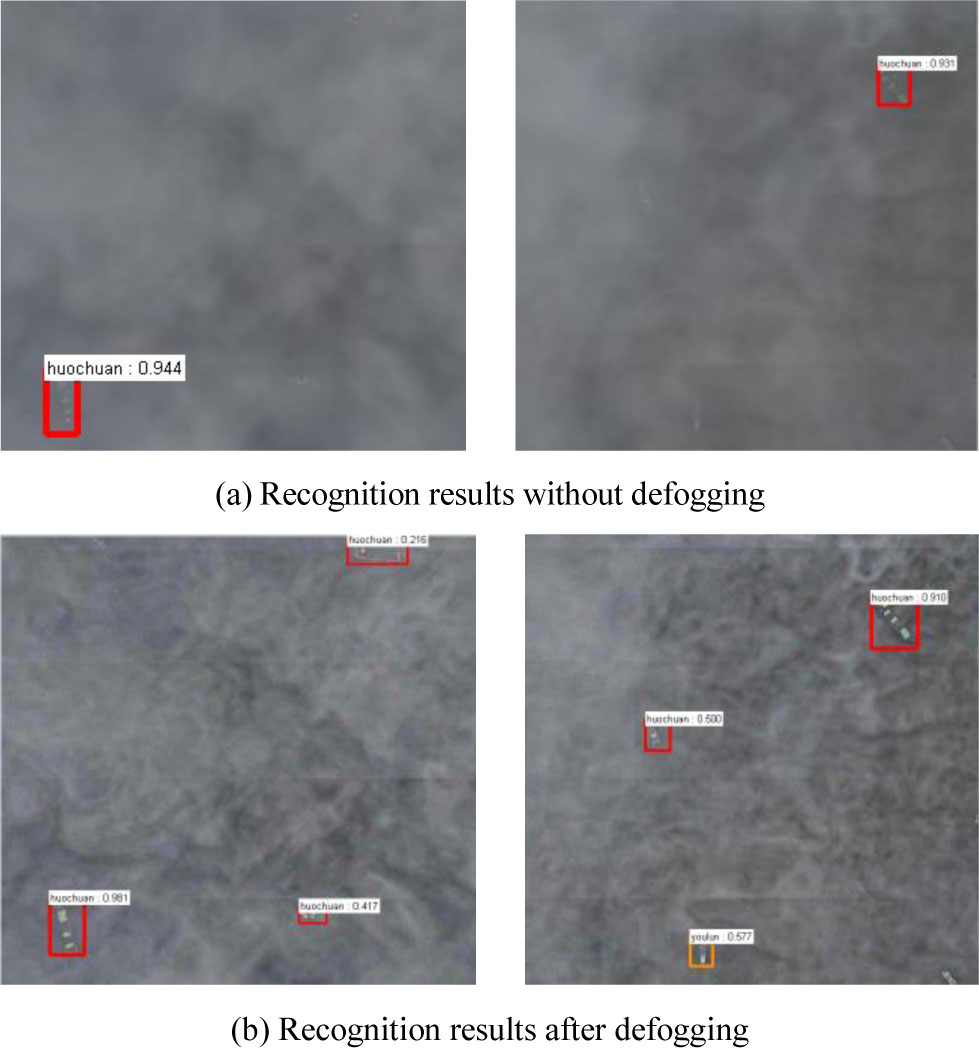
Figure 9.
Comparison of ship recognition experiment with fog.
TABLE II.
Comparison of recognition efficiency of the two algorithms
| Detection Method | TP | FP | TN | precision/% | recall/% |
|---|---|---|---|---|---|
| Faster R-CNN | 297 | 40 | 44 | 88.13 | 87.1 |
| Our | 313 | 18 | 28 | 94.56 | 91.78 |
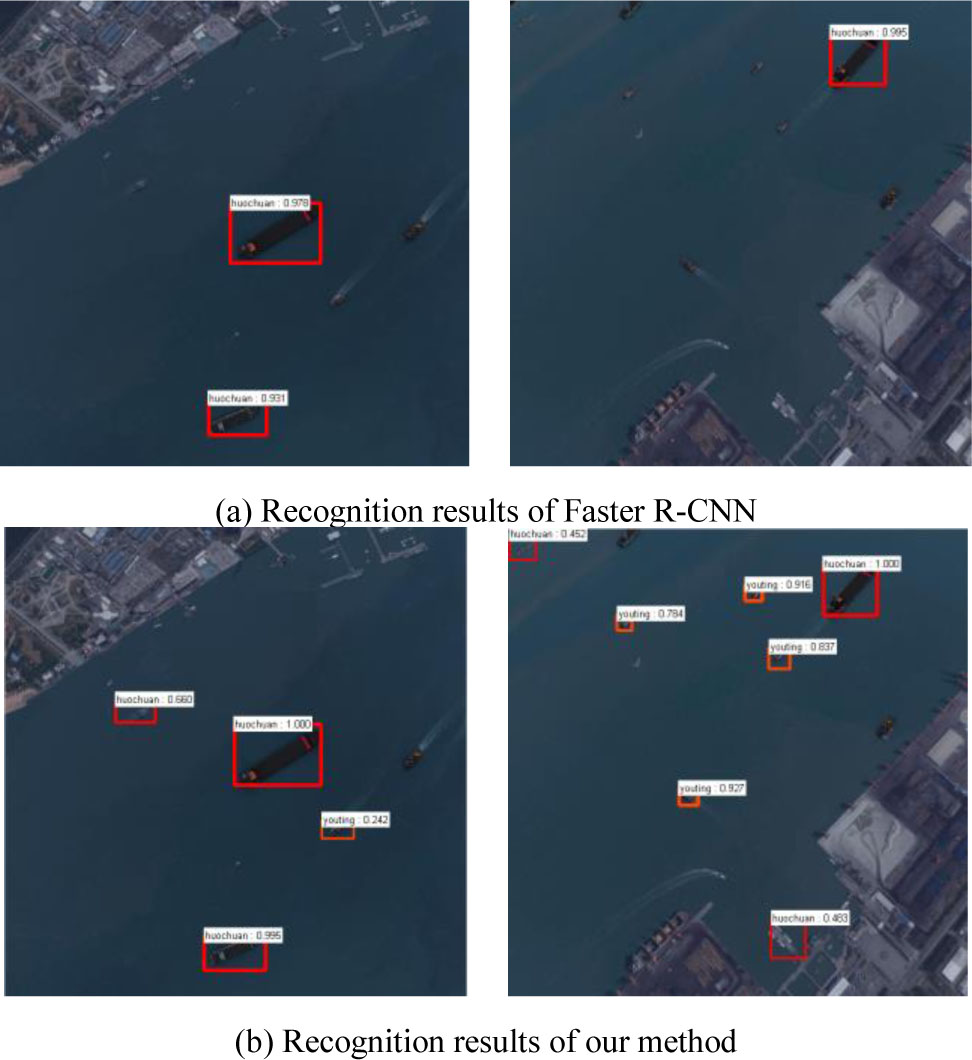
Figure 10.
Comparison of two algorithms in the same sea state.
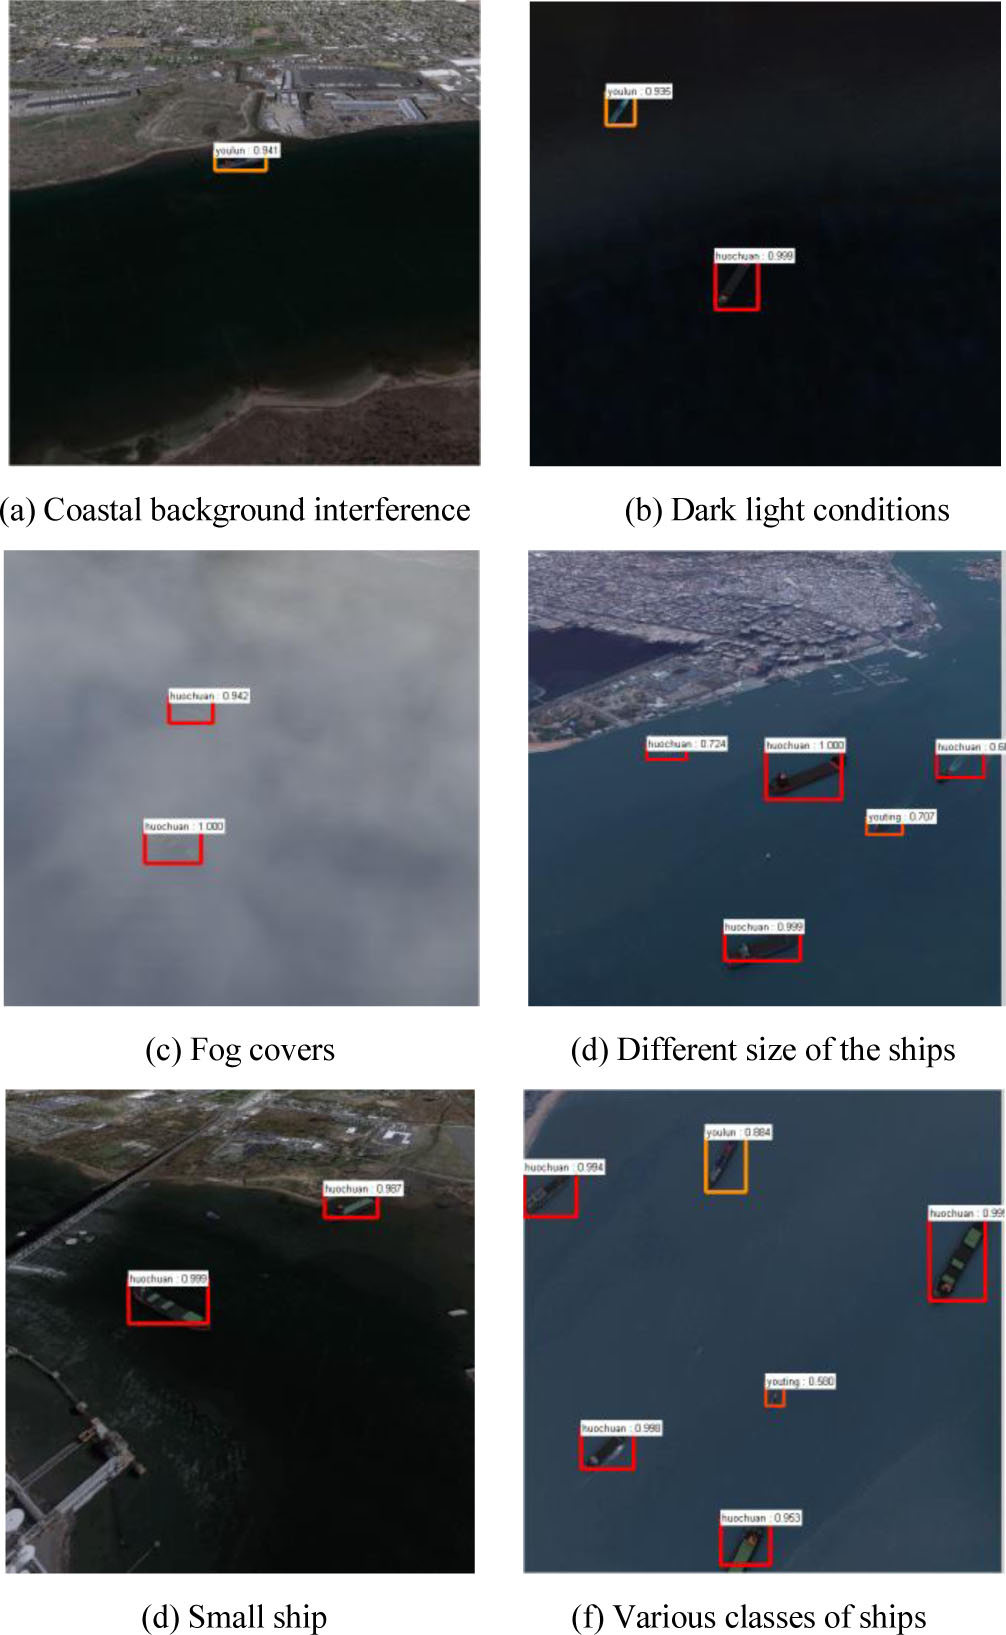
Figure 11.
Recognition results under various sea states.