
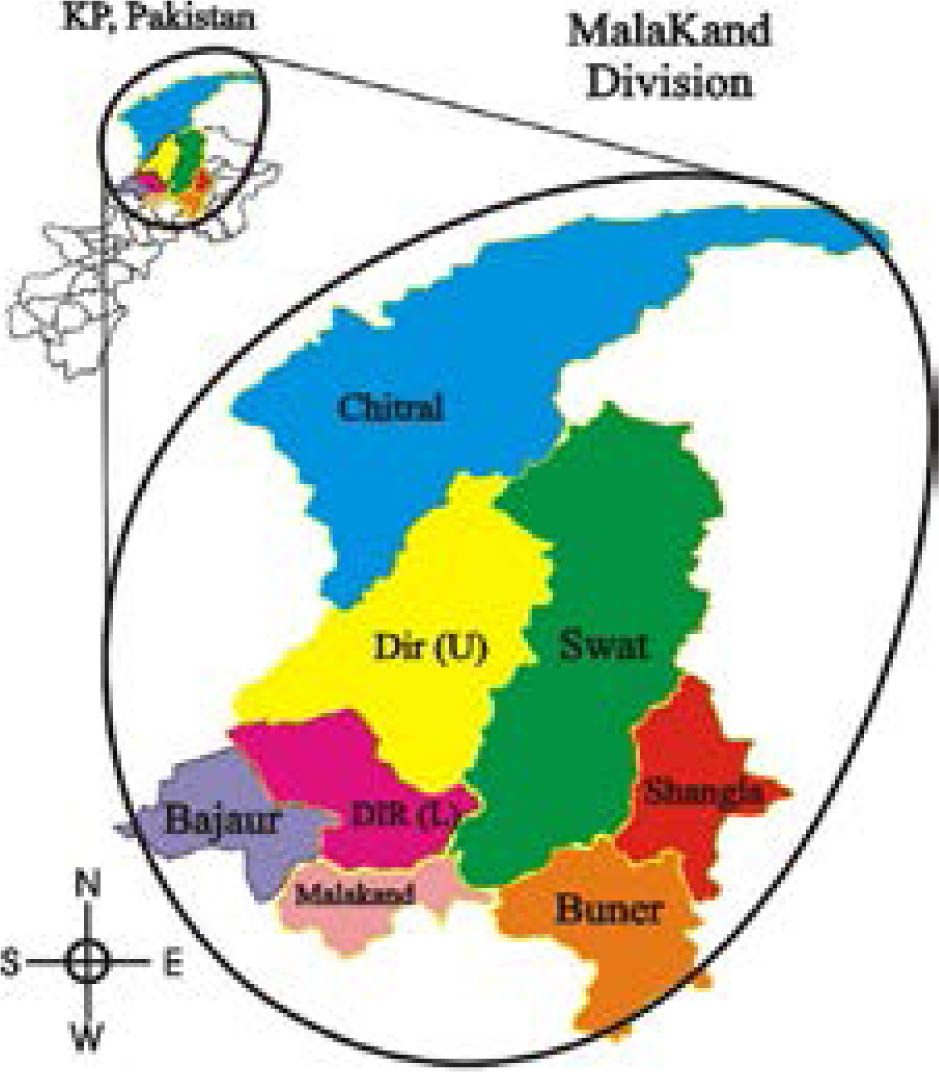
Fig. 1.
The figure shows different locations of study area.
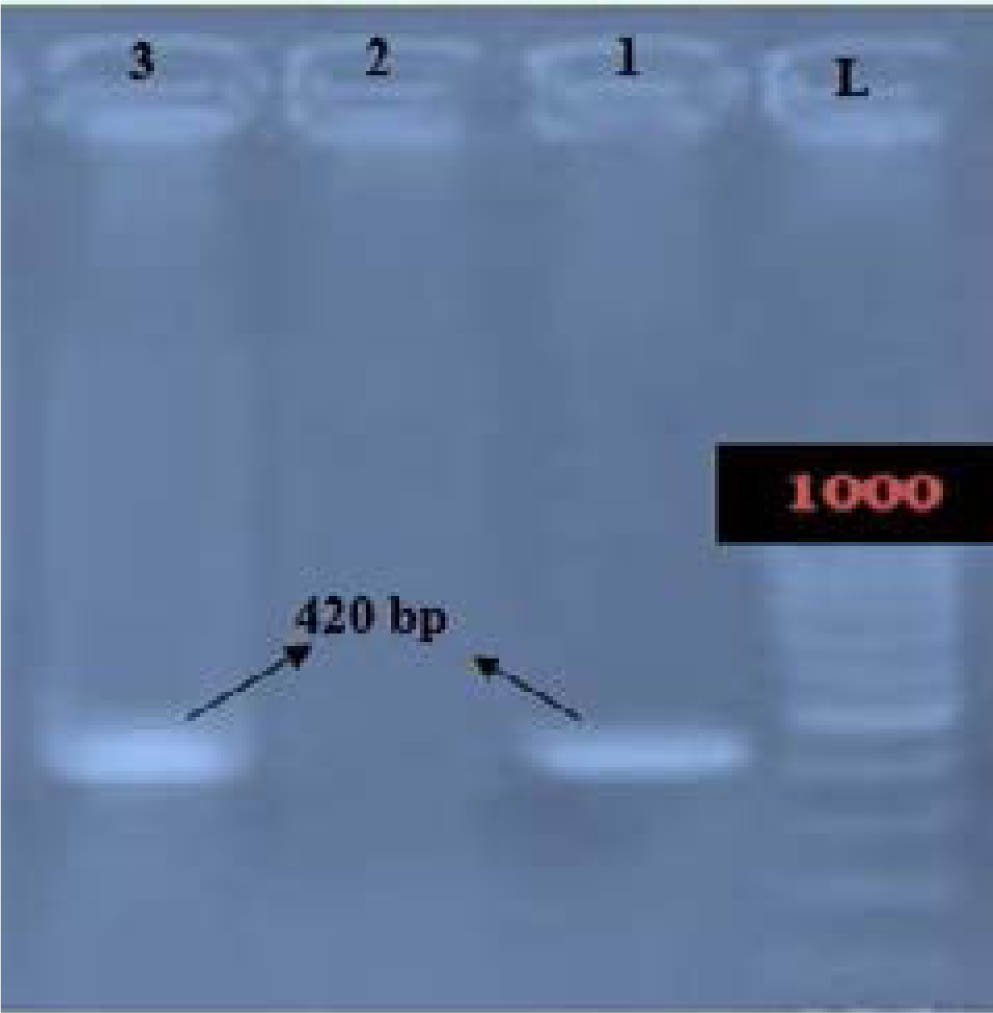
Fig. 2.
Agarose gel electrophoresis showing PCR amplification of ITS region of F. gigantica.
Table 1.
Overall prevalence of Fascioliasis in sheep and goats.
| S/No | Type of Host | Total Sample Examine | Total positive | Overall prevalence % |
|---|---|---|---|---|
| 1 | Sheep | 1307 | 51 | 3.9 % |
| 2 | Goat | 1274 | 26 | 2.04 % |
Table 2.
Overall prevalence of Fasciolides trematodes species in sheep and goats.
| Parasite species | Total samples of Sheep (1307) | Total samples of Goats (1274) | ||
|---|---|---|---|---|
| Positive samples | Prevalence % | Positive samples | Prevalence % | |
| F. hepatica | 42 | 3.21 | 19 | 1.49 |
| F. gigantica | 9 | 0.68 | 7 | 0.54 |
Table 3.
Shows the risk factors associated with the prevalence of fascioliasis.
| Risk Factors | Variables | Sheep (1307) | Goats (1274) | P-value | ||||
|---|---|---|---|---|---|---|---|---|
| Sample | Positive % | Prevalence % | Sample | Positive | Prevalence % | |||
| Sex | Male | 526 | 23 | 4.372 | 508 | 10 | 1.96 | 0.611 |
| Female | 781 | 28 | 3.58 | 766 | 16 | 2.088 | ||
| Age | <1.5 years | 268 | 19 | 7.08 | 312 | 9 | 2.88 | 0.003 |
| >1.5 years | 1039 | 32 | 3.07 | 962 | 17 | 1.76 | ||
| Area | Dir (U) | 200 | 23 | 11.5 | 250 | 10 | 4 | 0.97 |
| Dir (L) | 445 | 20 | 4.49 | 395 | 7 | 1.77 | ||
| Bajaur | 101 | 1 | 0.99 | 114 | 2 | 1.75 | ||
| Swat | 100 | 1 | 1 | 100 | 1 | 1 | ||
| Buner | 150 | 2 | 1.33 | 150 | 2 | 1.33 | ||
| Shangla | 83 | 1 | 1.20 | 65 | 1 | 0.60 | ||
| Malakand | 150 | 2 | 1.33 | 109 | 2 | 1.83 | ||
| Chitral | 78 | 1 | 1.28 | 91 | 1 | 1.11 | ||
| Grazing system | Grazing | 504 | 16 | 3.17 | 507 | 10 | 1.97 | 0.32 |
| Stall fed | 803 | 35 | 4.35 | 767 | 16 | 2.08 | ||
| Health condition | Healthy | 1018 | 34 | 3.33 | 1041 | 14 | 1.34 | 0.0001 |
| Emaciated | 289 | 17 | 5.88 | 233 | 12 | 5.15 | ||
| Drinking water source | Open | 427 | 19 | 4.44 | 412 | 10 | 2.42 | 0.039 |
| Bore | 225 | 4 | 1.77 | 167 | 2 | 1.19 | ||
| Stream | 388 | 21 | 5.41 | 358 | 9 | 2.51 | ||
| Tap water | 267 | 7 | 2.62 | 337 | 5 | 1.48 | ||
| Season | Autumn | 294 | 10 | 3.40 | 308 | 6 | 1.94 | 0.0004 |
| Winter | 216 | 4 | 1.85 | 199 | 2 | 1.005 | ||
| Spring | 319 | 6 | 1.88 | 331 | 5 | 1.51 | ||
| Summer | 478 | 31 | 6.48 | 436 | 13 | 2.98 | ||
| Treatment | Treated | 320 | 7 | 2.18 | 308 | 4 | 1.29 | 0.036 |
| Untreated | 987 | 44 | 4.45 | 966 | 22 | 2.277 | ||
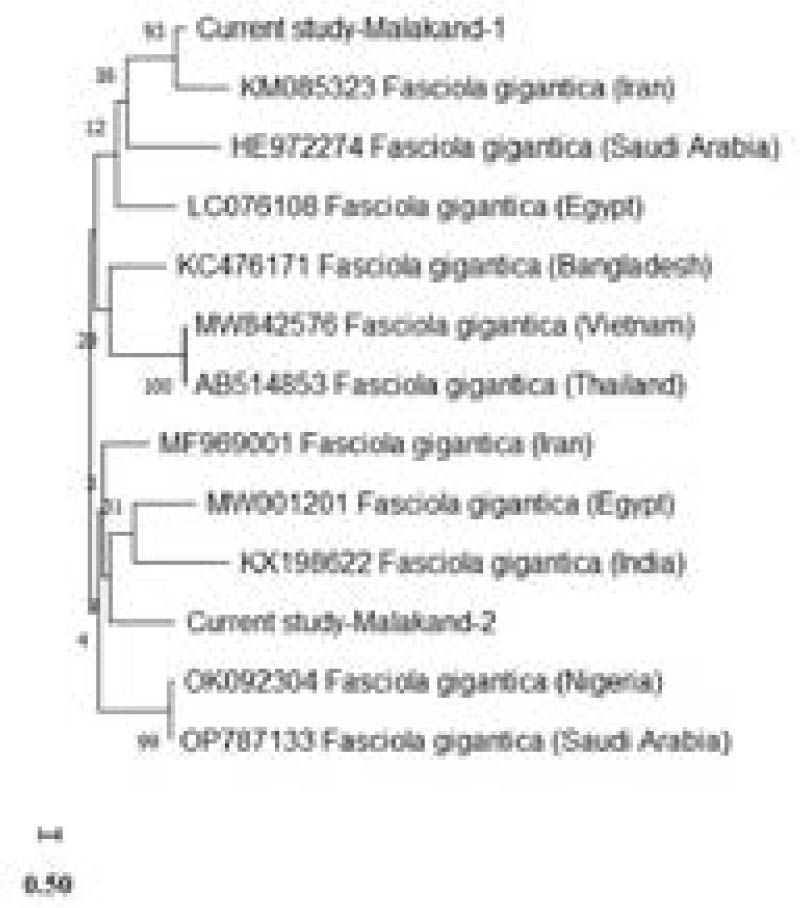
Fig. 3.
Phylogenetic tree of F. gigantica in goats and sheep utilising the ITS marker. The generated tree depicts the genetic relationships among the isolates of the present investigation and reference sequences from various regions. Bootstrap values are provided at branch points indicating the confidence levels of the groups.