
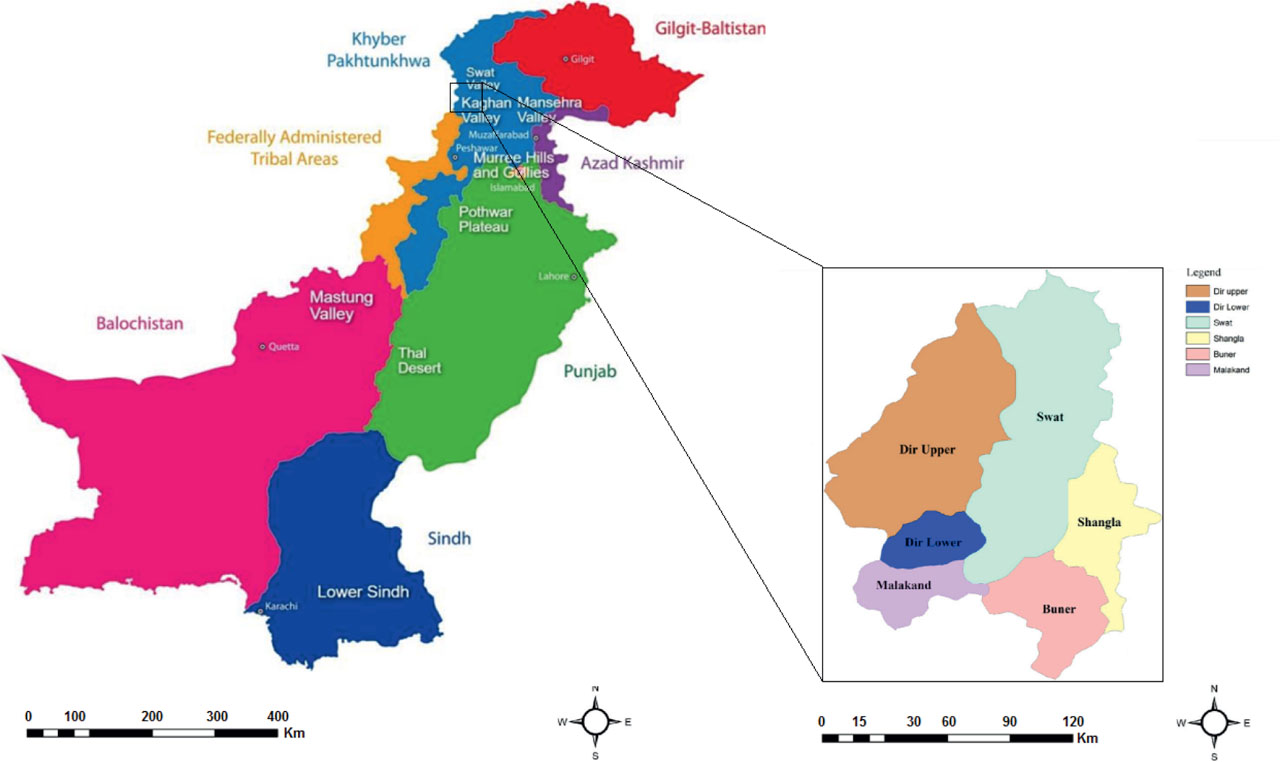
Fig. 1.
Map showing the study area in the Malakand Division, along with its districts in the Khyber Pakhtunkhwa province of Pakistan.
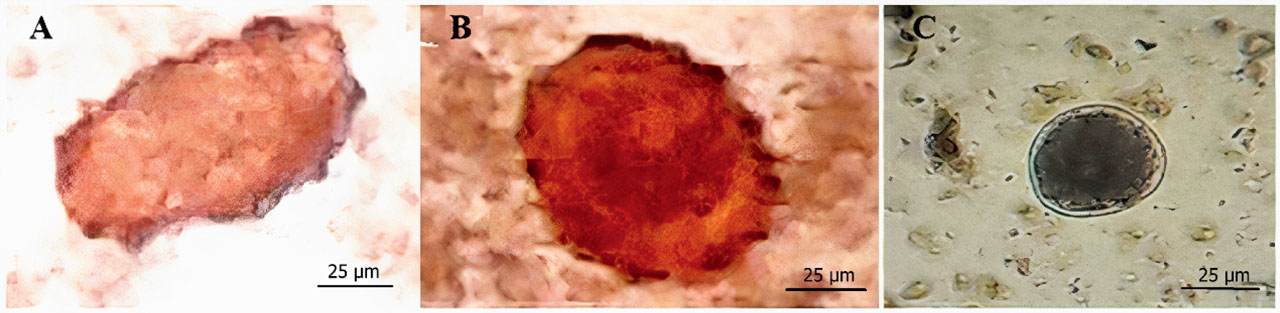
Fig. 2.
Microscopic images show ascarid nematode eggs identified in cattle fecal samples: (A) and (B) present fertilized and unfertilized A. suum eggs, respectively, and (C) displays the eggs of Toxocara vitulorum.
Table 1.
Infection rates and EPG analysis of ascarid nematodes in cattle.
| Ascarid species | Number of examined samples | Number of positive samples | Percentage of infection (%) | 95% C.I. (%) | Minimum EPG | Maximum EPG |
|---|---|---|---|---|---|---|
| Toxocara vitulorum | 127 | 72 | 31.30 | 25.4 – 37.9 | 3 600 | 18 000 |
| Ascaris suum | 103 | 49 | 21.30 | 16.4 – 27.6 | 2 450 | 12 250 |
| Total | 230 | 121 | 52.60 | 46.1 – 59.0 | 6 050 | 30 250 |
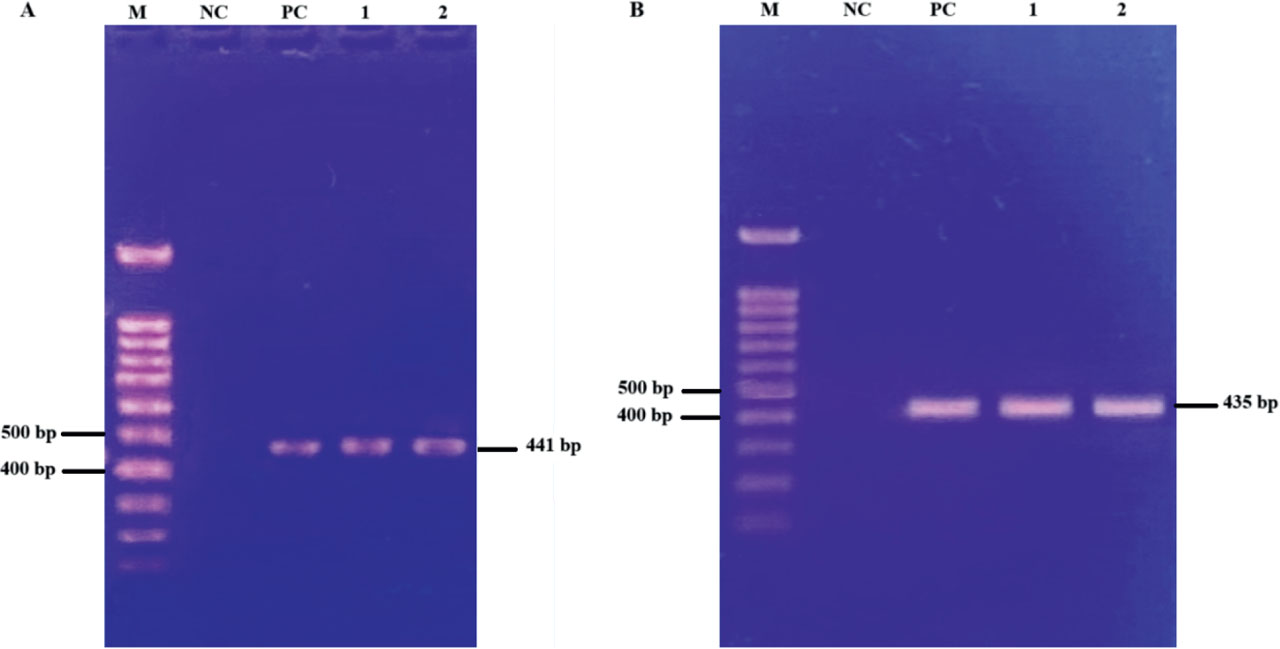
Fig. 3.
Gel electrophoresis showing Cox-1 mtDNA partial sequences amplification of T. vitulorum and A. suum samples. Legend: (A) Lanes display the Cox-1 mtDNA gene of T. vitulorum at 441 bp. M indicates the 1 kb size marker; NC and PC represent negative and positive controls, respectively. Lanes 1 and 2 contain DNA samples of T. vitulorum. (B) Lanes show the Cox-1 mtDNA gene of A. suum at 435 bp. M indicates the 1 kb size marker; NC and PC represent negative and positive controls, respectively. Lanes 1 and 2 contain DNA samples of A. suum.
Table 2.
BLAST analysis of Cox-1 partial sequences isolated from ascarid nematodes in cattle from Malakand Division, Pakistan.
| Isolate | Accession number | Country | Phylogenetic neighbour | Similarity (%) |
|---|---|---|---|---|
| Isolate 1 | AJ920062 | Sri Lanka | Toxocara vitulorum | 99.00 |
| AJ920057 | UK | Toxocara cati | 92.29 | |
| AJ920060 | Malaysia | Toxocaram alaysiensis | 91.84 | |
| MH795151 | Canada | Baylisascaris devosi | 91.03 | |
| Isolate 2 | AB591803 | Japan | Ascaris suum | 99.77 |
| KY368759 | Jordan | Ascaris lumbricoides | 98.85 | |
| MT993838 | China | Ascaris ovis | 98.62 | |
| OM004024 | China | Ascaridia galli | 91.16 | |
| MH795151 | Canada | Baylisascaris devosi | 91.03 |
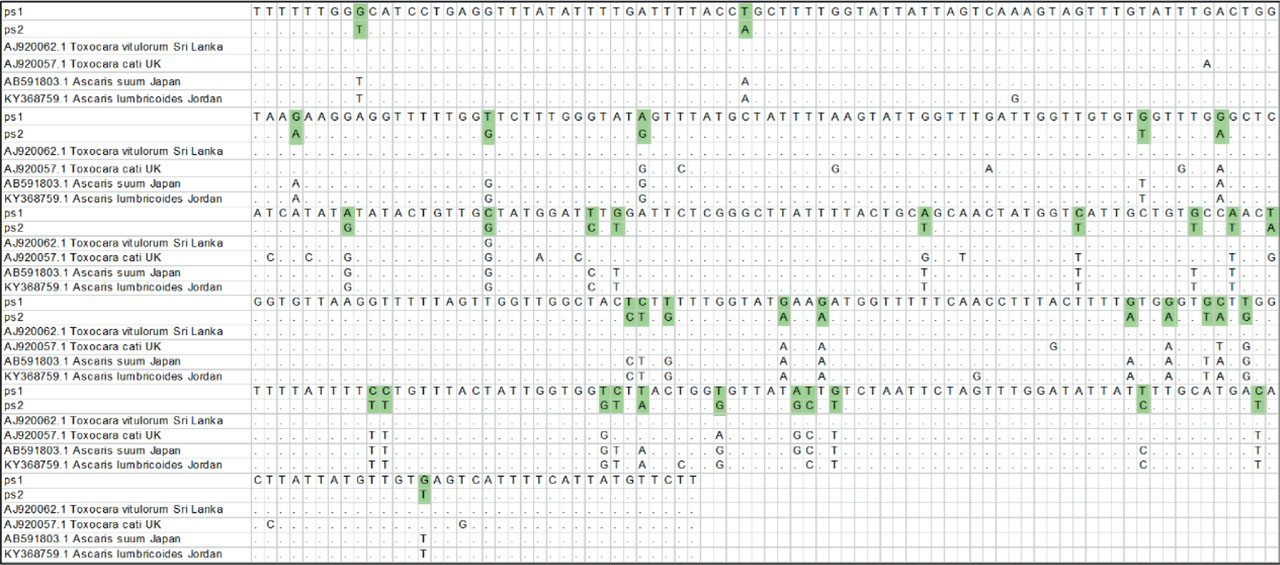
Fig. 4.
Alignment of Cox-1 sequences from our ascarid nematode species (ps1 and ps2) and genetically close species, highlighting similarities and differences in nucleotide composition.
Legend: The green boxes in the alignment indicate key polymorphic sites between our two isolated sequences from the ascarid species (ps1 and ps2).
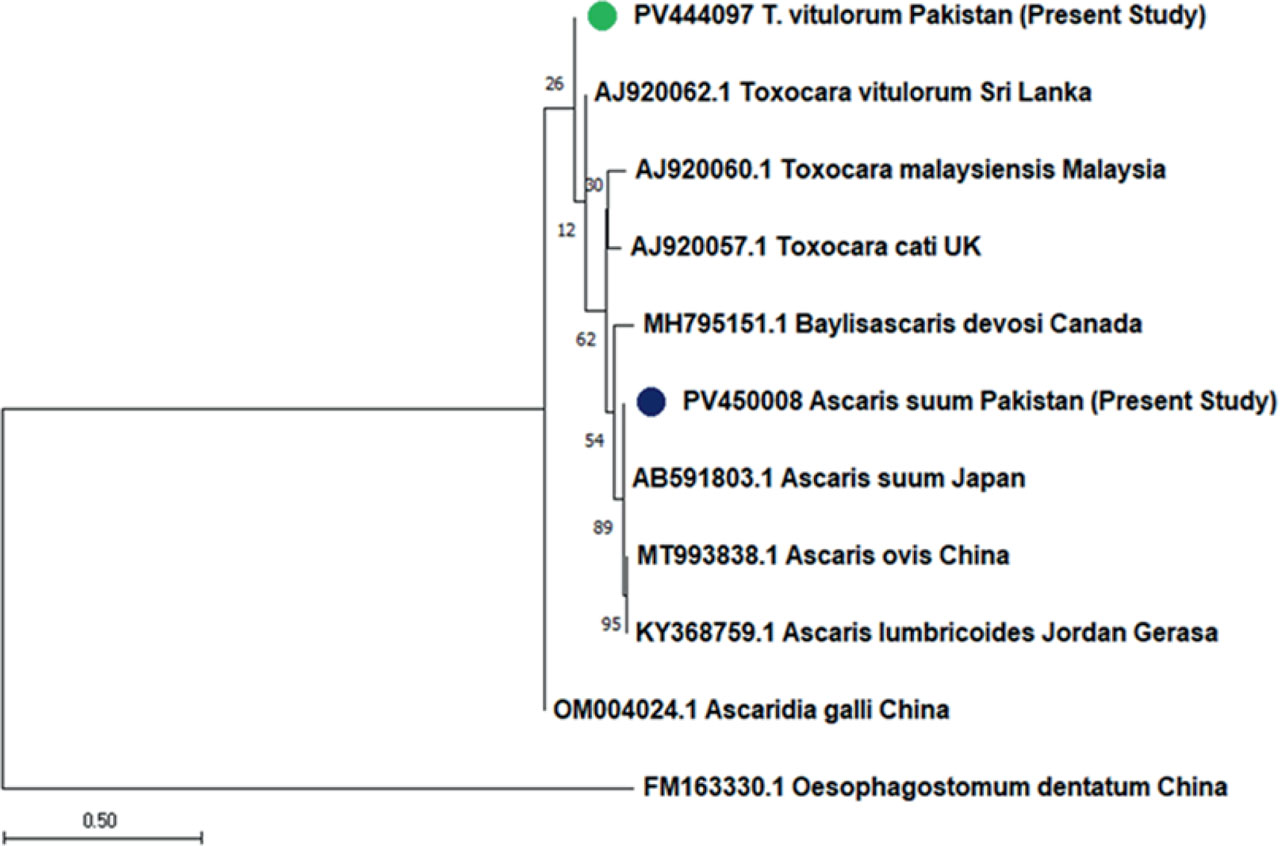
Fig. 5.
Phylogenetic tree of ascarid nematodes based on Cox-1 partial sequences.