
Table 1.
Epidemiological spectrum of Haemochus contortus among sheep and goat populations in Pakistan.
| Study area | Host | Sample type | Method | Samples | Positive | Prev. % | QAS | Reference |
|---|---|---|---|---|---|---|---|---|
| KPK | Goat & Sheep | Fecal | Mic & Mol | 180 | 46 | 25.55 | 5 | Ahmad et al., 2024 |
| Sindh | Goat & Sheep | Fecal | Mic & Mol | 800 | 88 | 11 | 4 | Memon et al., 2024 |
| KPK | Goat & Sheep | Fecal | Mic, Floa & Sed | 1340 | 312 | 23.28 | 4 | Irshad et al., 2023 |
| KPK | Goat & Sheep | Fecal | Floa & MM | 400 | 57 | 14.25 | 5 | Khan et al., 2022 |
| KPK | Goat & Sheep | Blood & Fecal | Mic | 300 | 56 | 18.66 | 2 | Ali et al., 2022 |
| KPK | Goat & Sheep | Fecal | Mic | 480 | 63 | 13.12 | 3 | Aimen et al., 2022 |
| KPK | Goat & Sheep | Fecal | Mic | 315 | 71 | 22.53 | 3 | Ruhoollah et al., 2021 |
| Punjab | Goat & Sheep | Worm | Mic | 200 | 105 | 52.2 | 3 | Bibi et al., 2017 |
| KPK | Sheep | Fecal | Floa, sed & MM | 300 | 120 | 40 | 4 | Jamil et al., 2016 |
| Punjab | Goat & Sheep | Fecal | Mic & EPG | 646 | 178 | 27.55 | 5 | Qasim et al., 2016 |
| KPK | Goats | Fecal | Mic | 150 | 22 | 14.66 | 4 | Nabi et al., 2014 |
| Punjab | Goat & Sheep | Fecal | Floa & Sed | 1000 | 133 | 13.3 | 4 | Raza et al., 2014 |
| Punjab | Goat | Fecal | Floa & Sed | 100 | 20 | 20 | 3 | Ayaz et al., 2013 |
| Punjab | Goat & Sheep | Fecal | Floa, Sed & MM | 480 | 137 | 28.54 | 4 | Khalid et al., 2013 |
| Balochistan | Sheep | Fecal | McMaster | 1200 | 125 | 10.42 | 2 | Razzaq et al., 2013 |
| KPK | Sheep | Fecal | Mic & Floa | 356 | 190 | 53.37 | 3 | Ullah et al., 2013 |
| Punjab | Sheep | Fecal | Mic, Floa & Sed | 523 | 34 | 6.5 | 4 | Lashari & Tasawar, 2011 |
| Sindh | Goat | Fecal | Mic | 1065 | 156 | 14.65 | 3 | Akhter et al., 2011 |
| Punjab | Sheep | Fecal | MM | 333 | 259 | 77.7 | 3 | Tasawar et al., 2010 |
| Punjab | Goat & Sheep | Worm | K/Iden | 4740 | 1604 | 33.83 | 1 | Raza et al., 2009 |
| Punjab | Goat & Sheep | Fecal | Mic, Floa & Sed | 400 | 225 | 56.25 | 1 | Gadahi et al., 2009 |
| Punjab | Goat | Fecal | Mic, Floa & MM | 300 | 84 | 28 | 2 | Ijaz et al., 2008 |
| Punjab | Sheep | Worm | Mic & K/Iden | 960 | 591 | 61.5 | 3 | Lateef et al., 2005 |
| Punjab | Sheep | Fecal | Mic | 10000 | 5477 | 54.77 | 2 | Jabeen et al., 2000 |
| Islamabad | Sheep | Fecal | Floa & MM | 62 | 54 | 87 | 0 | Sajid et al., 2000 |
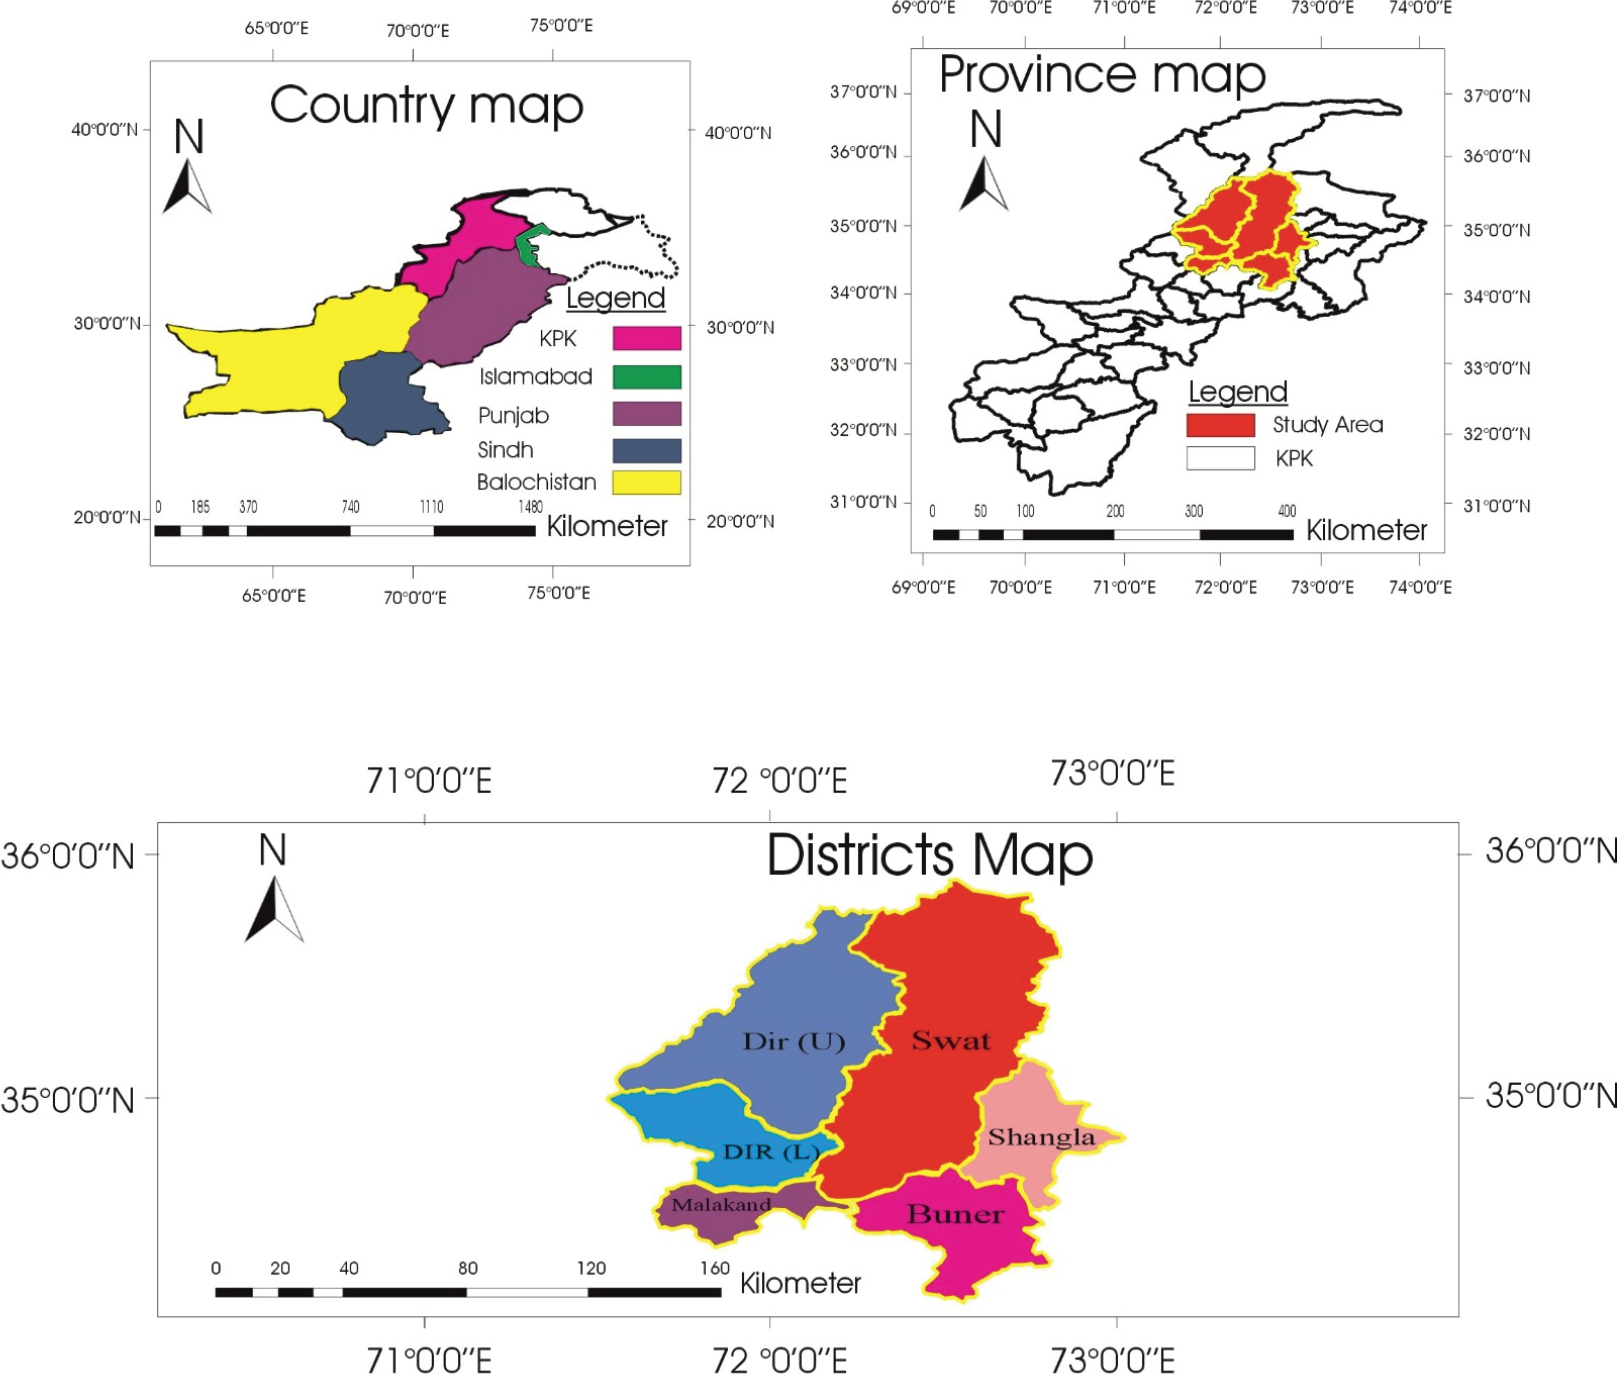
Fig. 1.
The study area map displays the geographical distribution of sampling locations in the Malakand Division of Khyber Pakhtunkhwa, Pakistan. It includes a national context map (country map), a provincial focus map (province map), and detailed district boundaries within the study area, highlighting Dir Upper, Dir Lower, Swat, Malakand, Shangla, and Buner. The map was designed and modified by the authors.
Table 2.
Overall prevalence of H. contortus in goats and sheep in Malakand division.
| Host | Sample | Positive | Percentage | P-value |
|---|---|---|---|---|
| Goats | 398 | 96 | 24.12 | 0.51379ns |
| Sheep | 480 | 125 | 26.04 | |
| Total | 878 | 221 | 25.17 |
Table 3.
Prevalence of Haemonchus contortus in small ruminants concerning various risk factors in Malakand division.
| Risk Factors | Variables | Total samples | Total positive cases | Total prevalence (%) | Goats Positive (%) | Sheep Positive (%) | P-value |
|---|---|---|---|---|---|---|---|
| Gender | Male | 368 | 85 | 23.1 | 22.62 | 23.50 | 0.2292ns |
| Female | 510 | 136 | 26.7 | 25.22 | 27.86 | ||
| Age | <1 years | 235 | 66 | 28.1 | 29.25 | 27.13 | 0.0391* |
| 1-5 years | 325 | 66 | 20.3 | 17.36 | 22.65 | ||
| >5 years | 318 | 89 | 28 | 27.03 | 28.82 | ||
| Area | Swat | 164 | 43 | 26.2 | 23.19 | 28.42 | 0.9815ns |
| Shangla | 135 | 33 | 24.4 | 23.61 | 25.40 | ||
| Dir (L) | 156 | 41 | 26.3 | 25.00 | 27.50 | ||
| Dir (U) | 130 | 30 | 23.1 | 23.21 | 22.97 | ||
| Malakand | 160 | 42 | 26.2 | 25.76 | 26.60 | ||
| Buner | 133 | 32 | 24.1 | 23.73 | 24.32 | ||
| Grazing system | Grazing | 465 | 126 | 27.1 | 26.19 | 27.84 | 0.1629ns |
| Stall-fed | 413 | 95 | 23 | 21.81 | 24.00 | ||
| Health condition | Healthy | 435 | 86 | 19.8 | 18.78 | 20.59 | 0.0003* |
| Moderate | 338 | 97 | 28.7 | 26.97 | 30.11 | ||
| Poor | 105 | 38 | 36.2 | 36.73 | 35.71 | ||
| Drinking water source | Open | 285 | 81 | 24.4 | 28.46 | 28.39 | 0.1729ns |
| Bore | 187 | 40 | 21.4 | 20.45 | 22.22 | ||
| Stream | 211 | 58 | 27.5 | 25.56 | 28.93 | ||
| Tap water | 195 | 42 | 21.5 | 20.00 | 22.86 | ||
| Season | Autumn | 205 | 48 | 23.4 | 21.98 | 24.56 | 0.5016ns |
| Winter | 190 | 42 | 22.1 | 20.51 | 23.21 | ||
| Spring | 223 | 59 | 26.5 | 25.23 | 27.59 | ||
| Summer | 260 | 72 | 27.7 | 27.05 | 28.26 | ||
| Treatment | Treated | 290 | 50 | 17.2 | 16.55 | 17.88 | 0.0004* |
| Untreated | 588 | 171 | 29.1 | 28.19 | 29.79 |
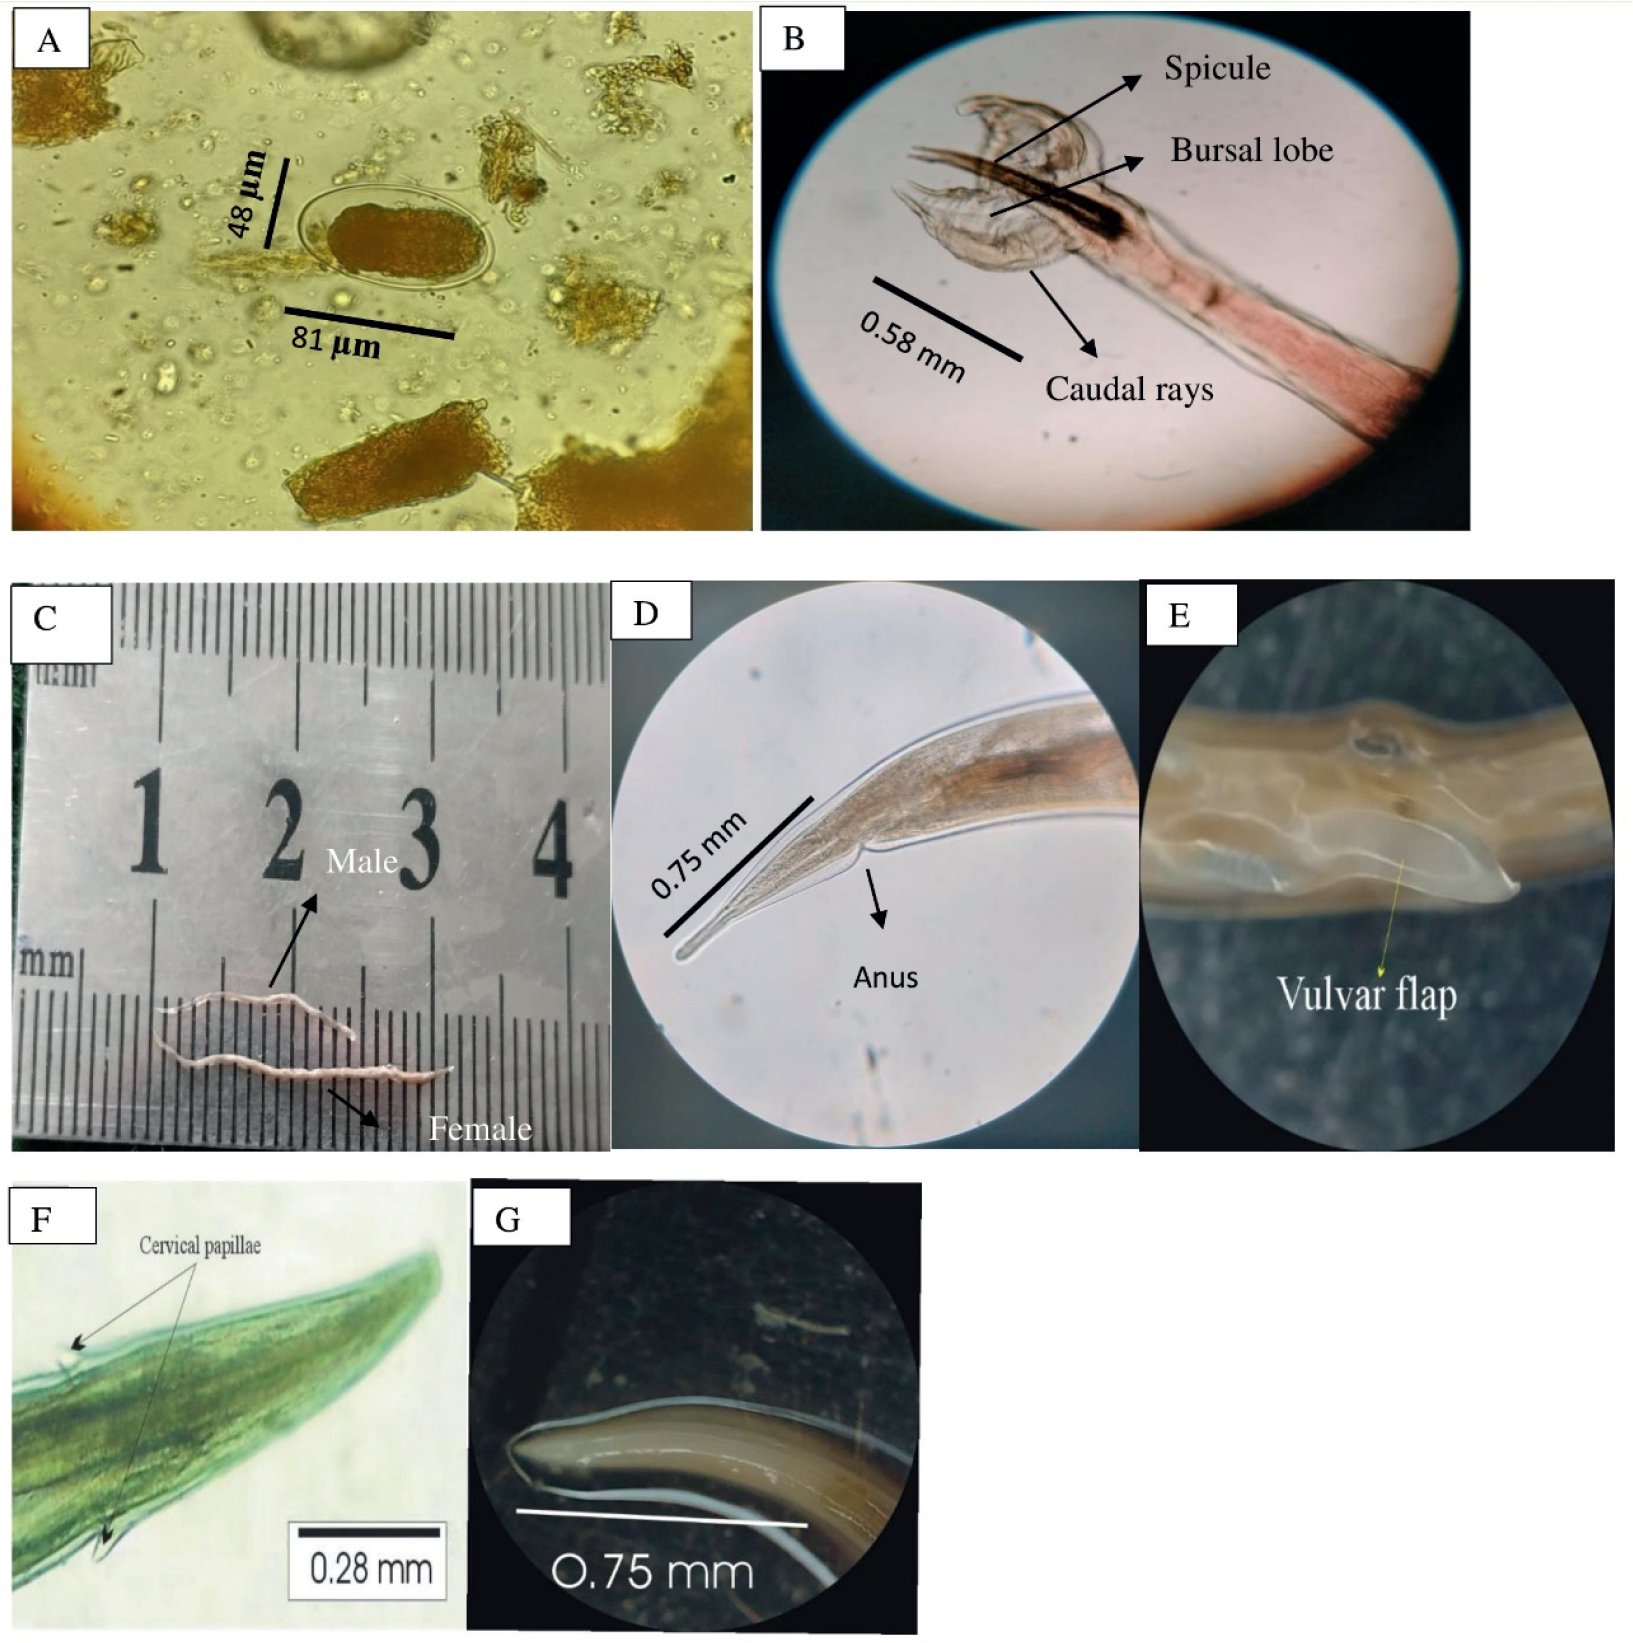
Fig. 2.
Morphological features of Haemonchus contortus.
(A). Egg containing morula, showing measured length and width (μm); (B). Male bursa highlighting spicules and caudal rays, with spicule length (mm); (C). Adult male and Female H. contortus aligned on a calibrated scale to show total body length (mm); (D). Posterior end of female showing anus and measured tail length (mm); (E). Vulvar flap of female Haemonchus; (F). Cervical papillae with recorded length (mm); (G). Oesophagus of H. contortus showing total length (mm)
Table 4.
Morphometric characteristics of H. contortus egg sizes (in μm).
| Shape | Statistical index | Length | Width |
| μm | μm | ||
| Oval | Average | 80.98 | 45.05 |
| Maximum | 99 | 61 | |
| Minimum | 63 | 36 | |
| Standard error | 1.6016 | 1.43 | |
| Standard deviation | 9.4749 | 8.49 | |
| Sample variance | 89.7754 | 72.14 | |
| N | 35 | 35 |
Table 5.
Morphometric measurement (in mm) of H. contortus isolated from goats and sheep.
| Particulars | Male worms (n= 50) | Female worms (n= 76) |
|---|---|---|
| Body length (mm) | 11.9 – 13.8 | 15 – 23.8 |
| Body width (mm) | 0.23 – 0.38 | 0.29 – 0.38 |
| Cervical papillae (mm) | 0.28 – 0.38 | 0.24 – 0.42 |
| Spicule length (mm) | 0.44 – 0.78 | – |
| Length of esophagus (mm) | 0.61 – 0.92 | 0.72 – 1.22 |
| Gubernaculum length (mm) | 0.09 – 0.18 | – |
| Distance from vulva to posterior end (mm) | – | 0.68 – 0.82 |
| Distance from Anus to posterior end (mm) | – | 0.29 – 0.35 |
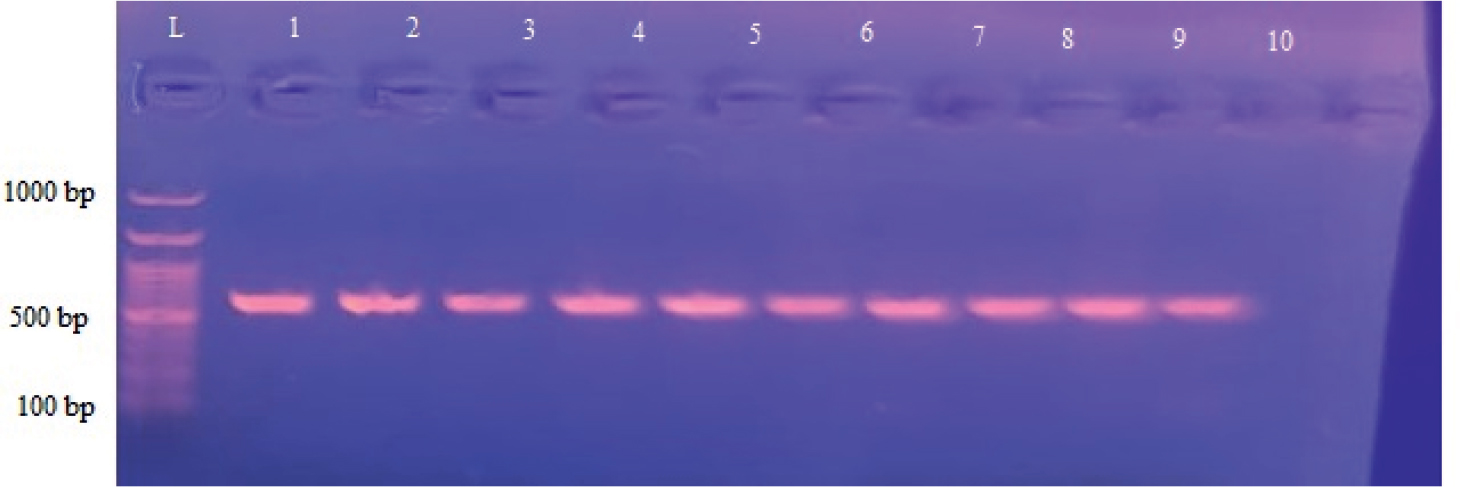
Fig. 3.
Agarose gel electrophoresis showing PCR amplification of COX region of H. contortus.
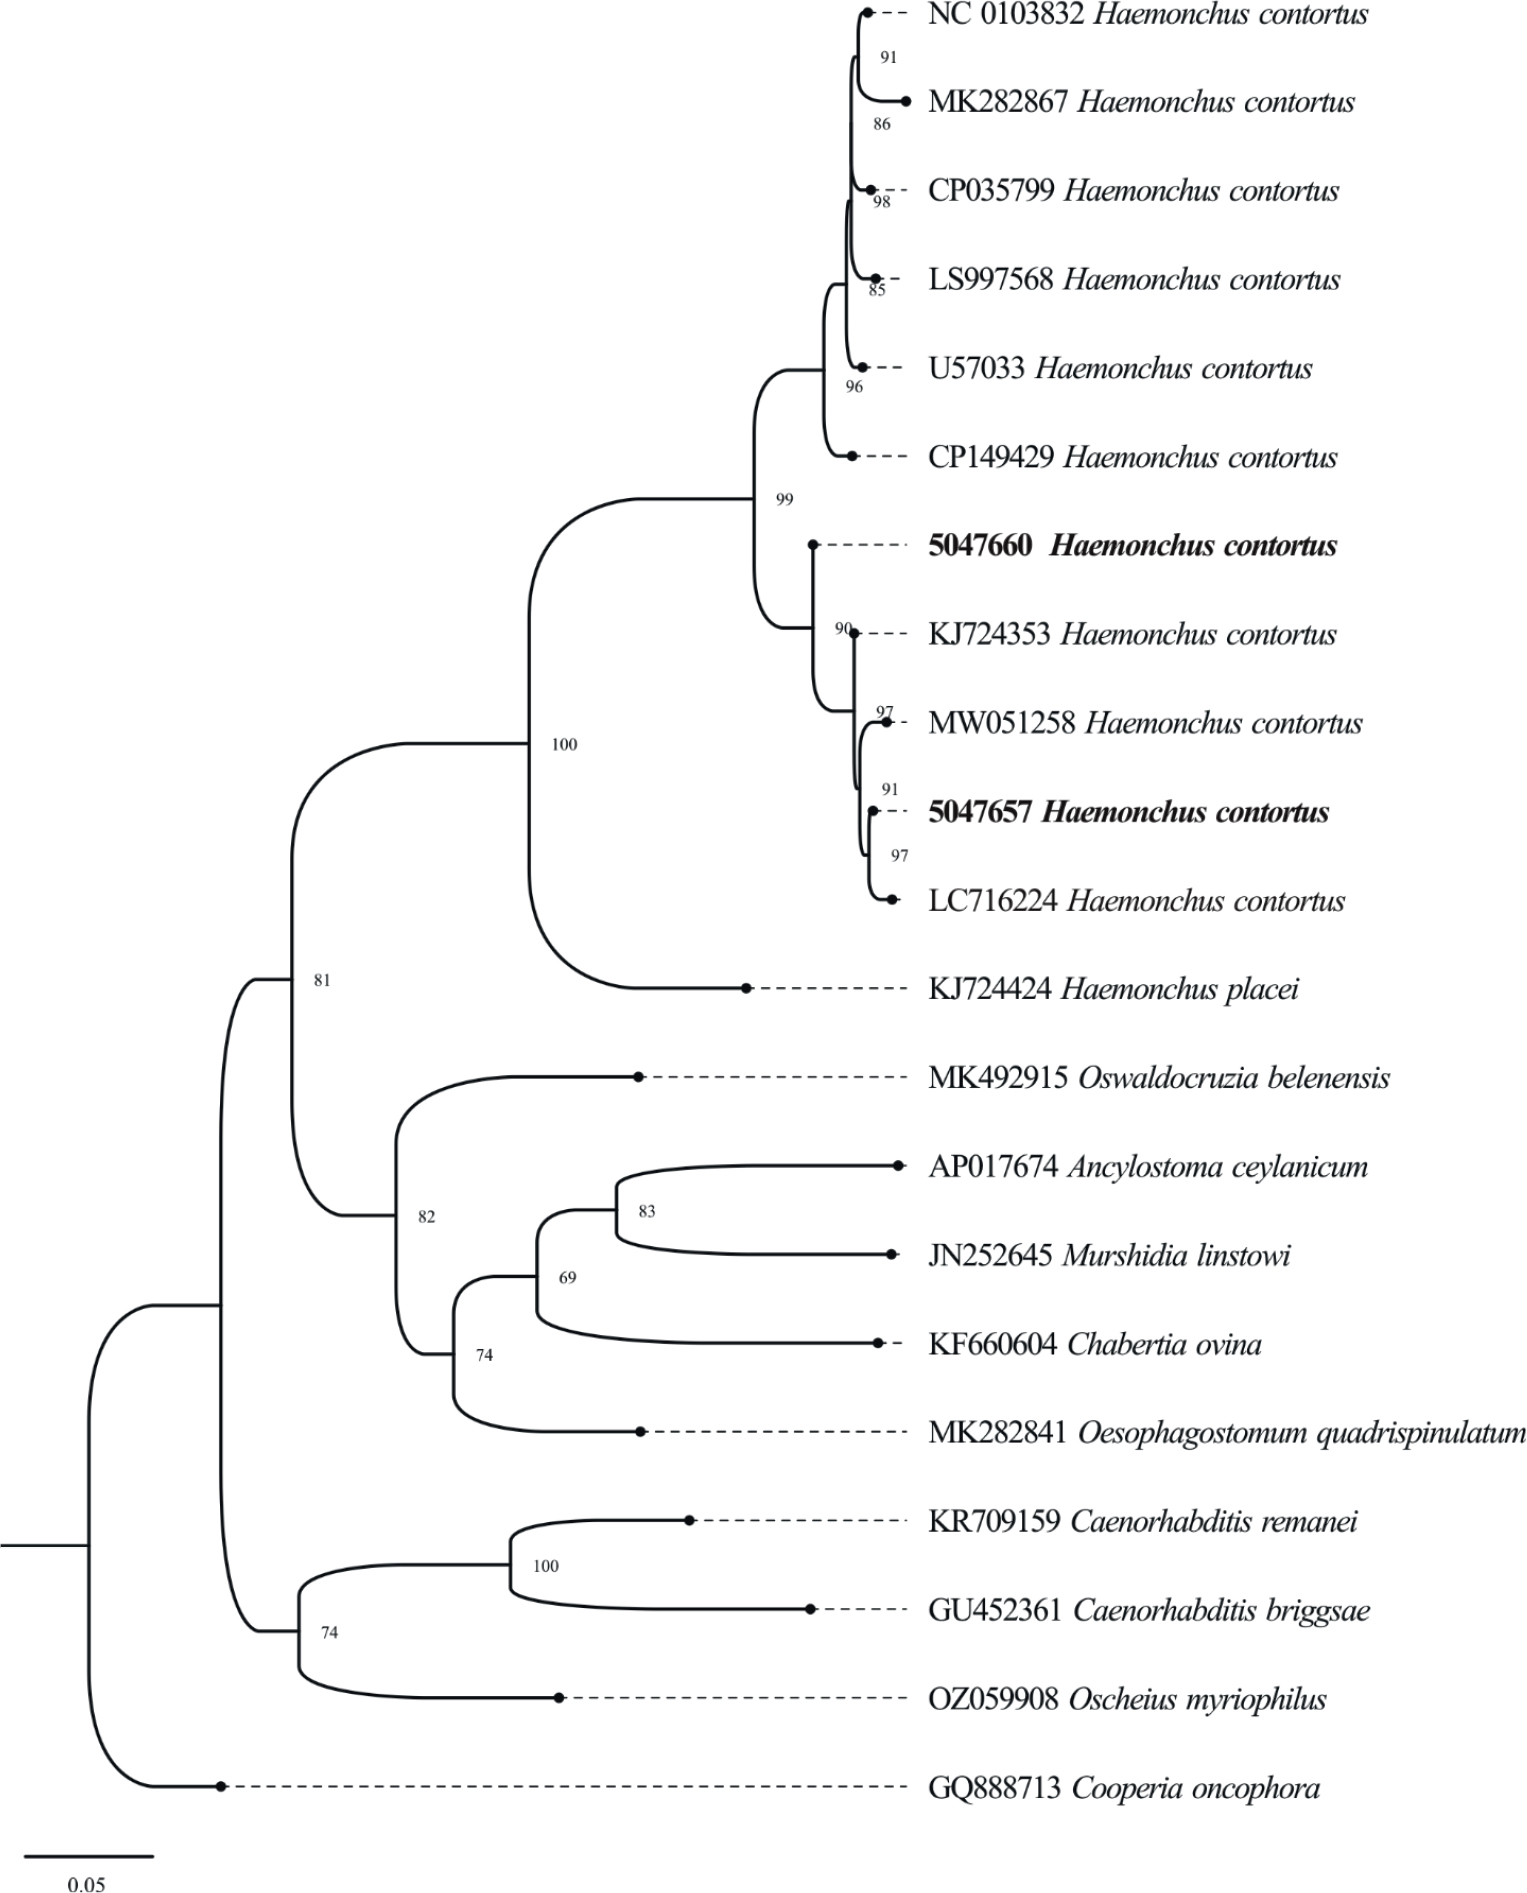
Fig. 4.
Phylogenetic tree of H. contortus in Goats and Sheep using Cox-1 marker. The constructed tree illustrates the genetic links between the isolates of the current study and reference sequences from other areas. Bootstrap values are given at branch points representing the group’s confidence levels.