
Table 1.
Infrared (IR) spectrum of OESME by frequency range.
| Absorption (cm−1) | Transmittance (%) | Appearance | Group | Compound class |
|---|---|---|---|---|
| 3410.86 | 1.911949 | medium | N-H stretching | aliphatic primary amine |
| 2933.25 | 5.776791 | medium | C-H stretching | alkane |
| 1717.40 | 8.022296 | strong | C=O stretching | conjugated acid |
| 1613.77 | 4.368951 | strong | C=C stretching | α,β-unsaturated ketone |
| 1517.71 | 8.653738 | strong | N-O stretching | nitro compound |
| 1447.29 | 5.797619 | medium | C-H bending | alkane |
| 1356.37 | 5.676562 | medium | O-H bending | alcohol |
| 1202.98 | 5.827868 | strong | C-N stretching | vinyl ether |
| 1101.19 | 5.561848 | strong | C-O stretching | secondary alcohol |
| 1047.44 | 4.379712 | strong, broad | CO-O-CO stretching | anhydride |
| 863.12 | 12.04349 | strong | C-H bending | 1,2,4-trisubstituted |
| 798.46 | 11.73666 | strong | C-H bending | 1,2,3-trisubstituted |
| 761.97 | 10.57862 | strong | C-H bending | 1,2-disubstituted |
| 650.63 | 9.6639 | strong | C-I stretching | halo compound |
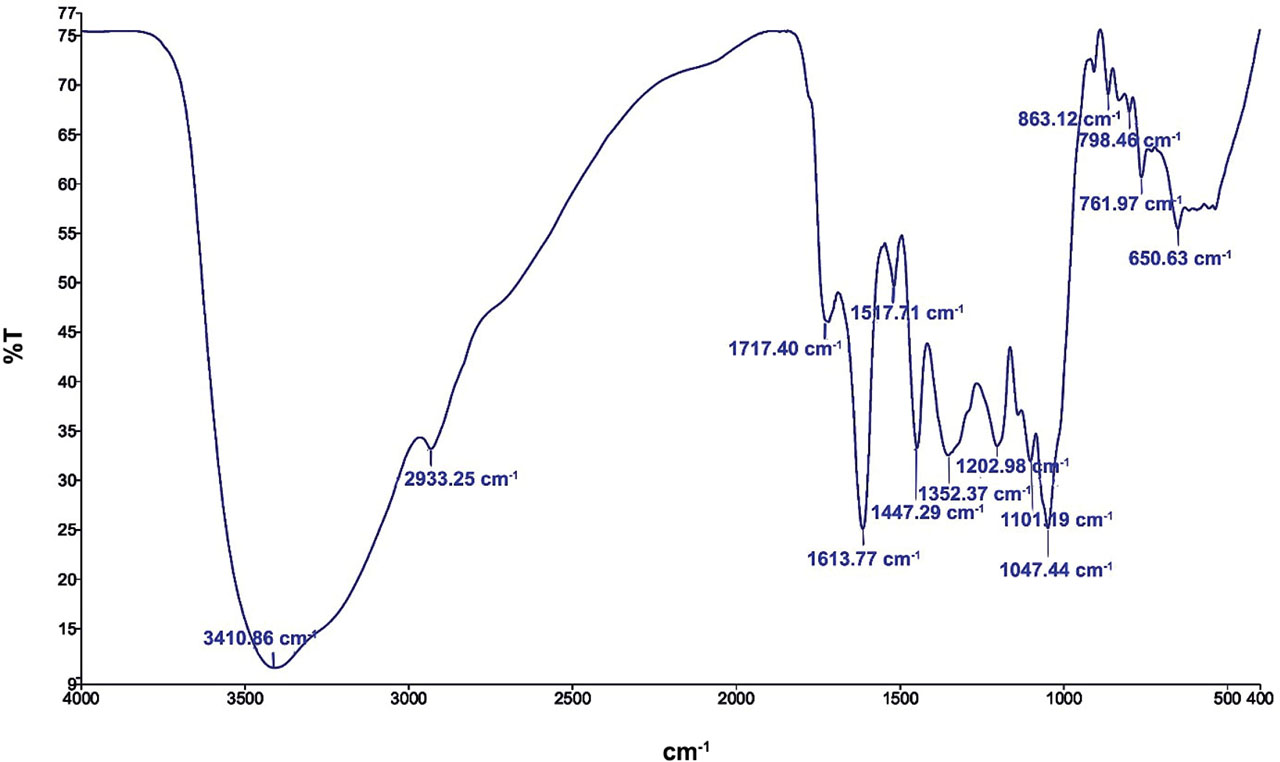
Fig 1.
FT-IR of OESME in an aqueous medium showing the functional characteristic of the material.
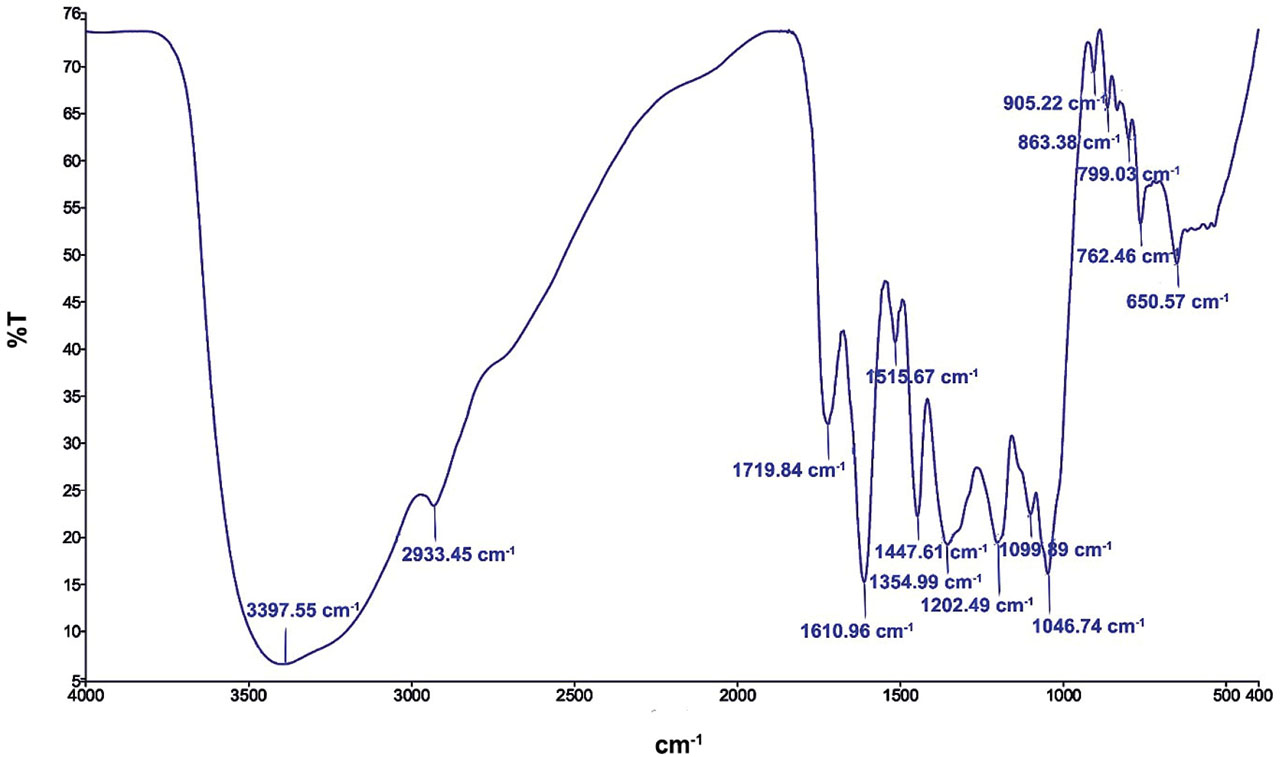
Fig 2.
FT-IR of OELME in an aqueous medium showing the functional characteristic of the material.
Table 2.
Infrared (IR) spectrum of OELME by frequency range.
| Absorption (cm−1) | Transmittance (%) | Appearance | Group | Compound class |
|---|---|---|---|---|
| 3397.55 | 1.252463 | medium | N-H stretching | aliphatic primary amine |
| 2933.45 | 4.512668 | strong, broad | N-H stretching | amine salt |
| 1719.84 | 6.204029 | strong | C=O stretching | α.β-unsaturated ester |
| 1610.96 | 2.947124 | strong | C=C stretching | α.β-unsaturated ketone |
| 1515.67 | 7.879805 | strong | N-O stretching | nitro compound |
| 1447.61 | 4.298548 | medium | C-H bending | alkane |
| 1354.99 | 3.710983 | medium | O-H bending | alcohol |
| 1202.49 | 3.755297 | strong | C-O stretching | vinyl ether |
| 1099.89 | 4.343475 | strong | C-O stretching | Secondary alcohol |
| 1046.74 | 3.118347 | strong, broad | CO-O-CO stretching | anhydride |
| 905.22 | 13.43325 | strong | C=C bending | alkene |
| 863.38 | 12.6943 | strong | C-H bending | 1,2,4-trisubstituted |
| 799.03 | 12.05039 | medium | C=C bending | alkene |
| 762.46 | 10.30954 | strong | C-H bending | 1,2-disubstituted |
| 650.57 | 9.489779 | strong | C-I stretching | halo compound |
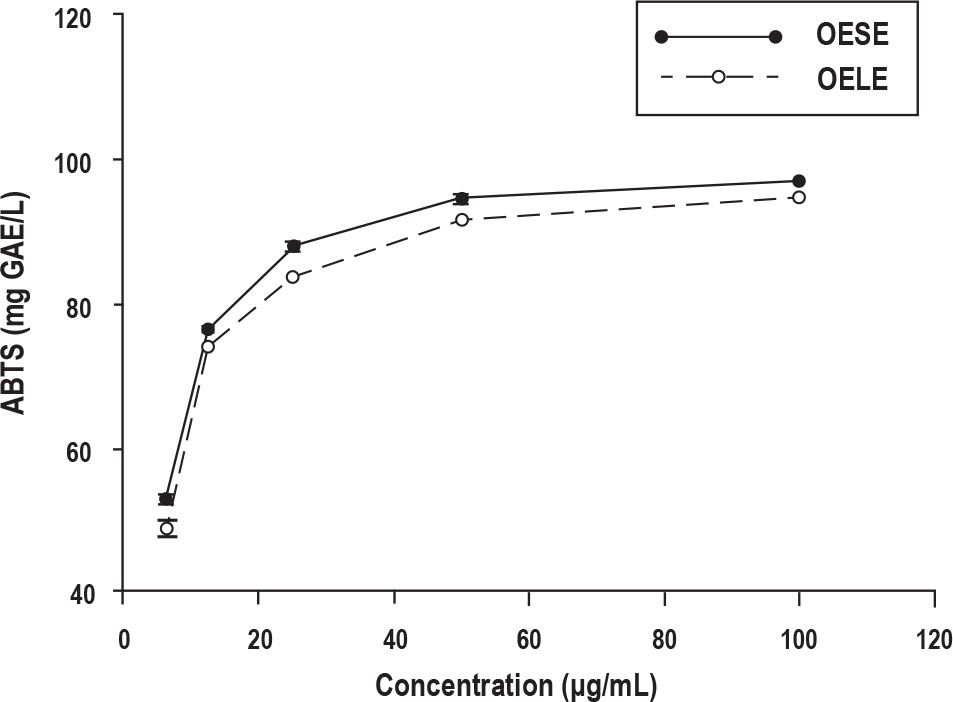
Fig 3.
ABTS radical scavenging activity of the methanolic stem and leaves extracts of O. europaea. Results are presented as the means ± SD.
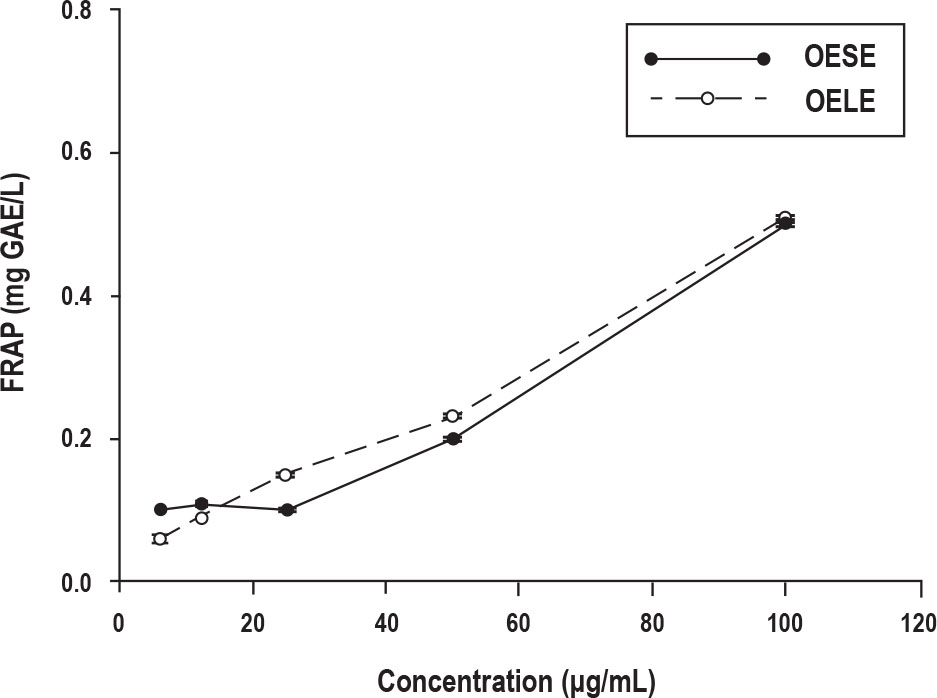
Fig 4.
The ability of OESME and OELME extracts to reduce ferric iron. The ability of antioxidants to reduce the oxidative effects of reactive oxygen species is measured by the ferric reducing antioxidant power (FRAP) test. Results are presented as the means ± SD.
Table 3.
Cytotoxicity in terms of IC50 dose of OESME and OELME against the lung (A549) cancer and human breast (MCF7) cell lines after 48 h of incubation by MTT Assay.
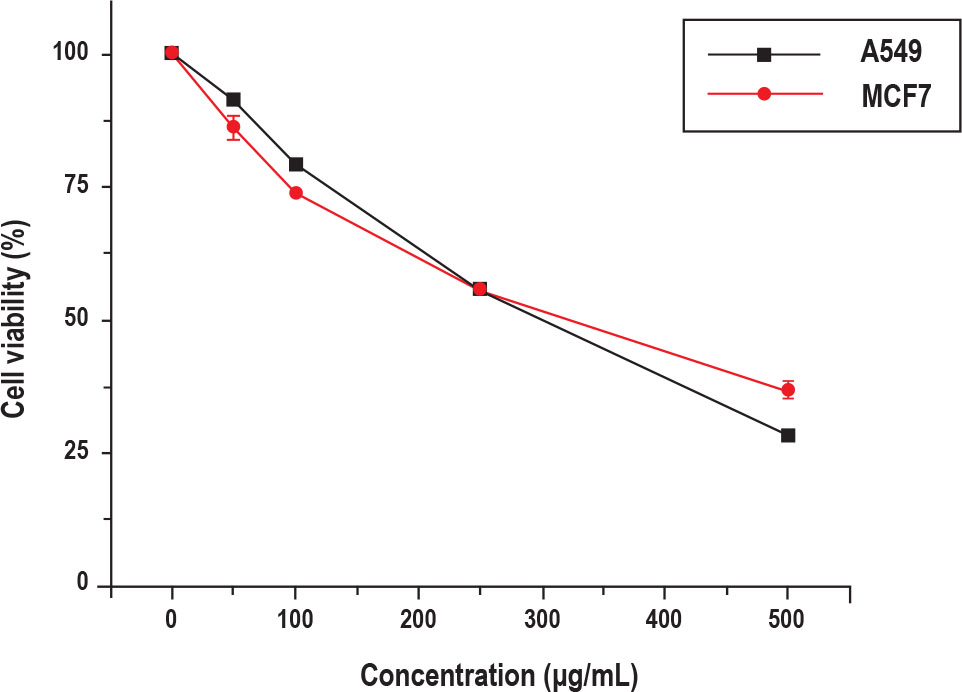
Fig 5.
Cell viability determined by MTT assay of OESME at various concentrations (µg/mL) against the lung (A549) cancer and human breast (MCF7) cell lines after 48 h of incubation. Every experiment was conducted thrice, and results are presented as the means ± SD.
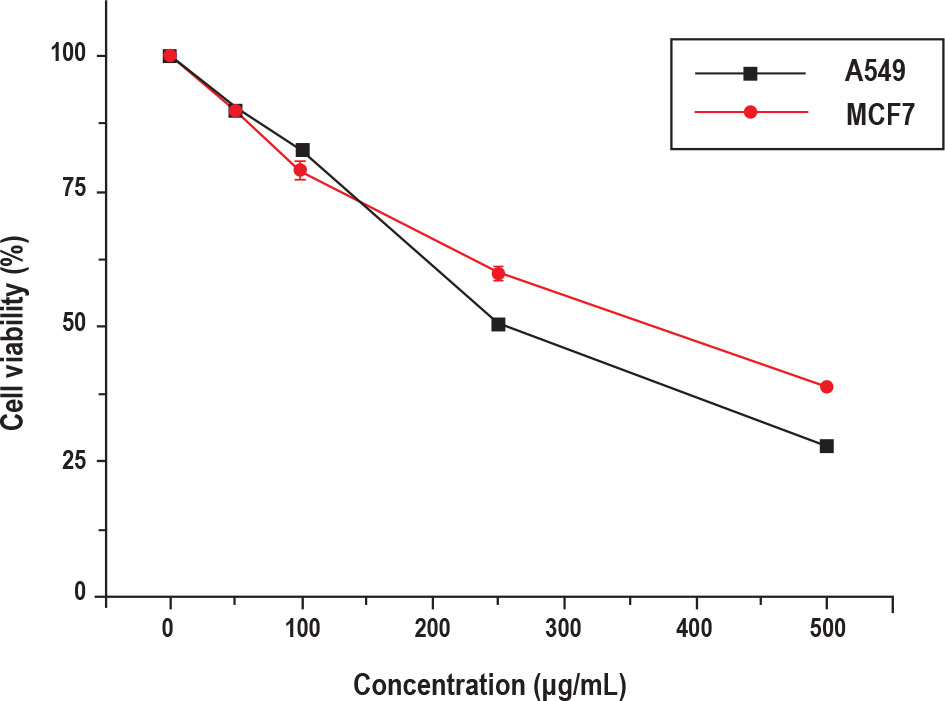
Fig 6.
Cell viability determined by MTT assay of OELME at various concentrations (µg/mL) against the lung (A549) cancer and human breast (MCF7) cell lines after 48 h of incubation. Every experiment was conducted thrice, and results are presented as the means ± SD.
Table 4.
In vitro anthelmintic activity of Olea europaea extract (OESME and OELME).
| Test samples | Concentration (mg/ml) | Time is taken for paralysis (min.) | Percentage of worms paralyzed | Time is taken for death (min.) | Percentage of worms’ dead |
|---|---|---|---|---|---|
| Control (H2O) | -- | -- | -- | -- | -- |
| OELME | 25 mg/ml | 135.292 ± 9.247 *, # | 20% | 164.548 ± 8.597 *, # | 20% |
| 50 mg/ml | 63.074 ± 8.660 *, # | 40% | 146.732 ± 5.756 *, # | 40% | |
| 100 mg/ml | 84.808 ± 7.796 *, # | 60% | 119.158 ± 9.198 *, # | 60% | |
| 200 mg/ml | 39.158 ± 4.068 *, # | 100% | 48.336 ± 11.027 *, # | 100% | |
| OESME | 25 mg/ml | 145.368 ± 3.639 *, # | 20% | 161.306 ± 7.641 *, # | 20% |
| 50 mg/ml | 79.988 ± 8.372 *, # | 40% | 106.456 ± 9.346 *, # | 40% | |
| 100 mg/ml | 82.47 ± 8.231 *, # | 60% | 94.066 ± 8.834 *, # | 60% | |
| 200 mg/ml | 35.728 ± 2.396 *, # | 100% | 36.848 ± 2.328 *, # | 100% | |
| Mebendazole | 10 mg/ml | 13.91 ± 0.373 * | 100% | 18.2 ± 0.980 * | 100% |
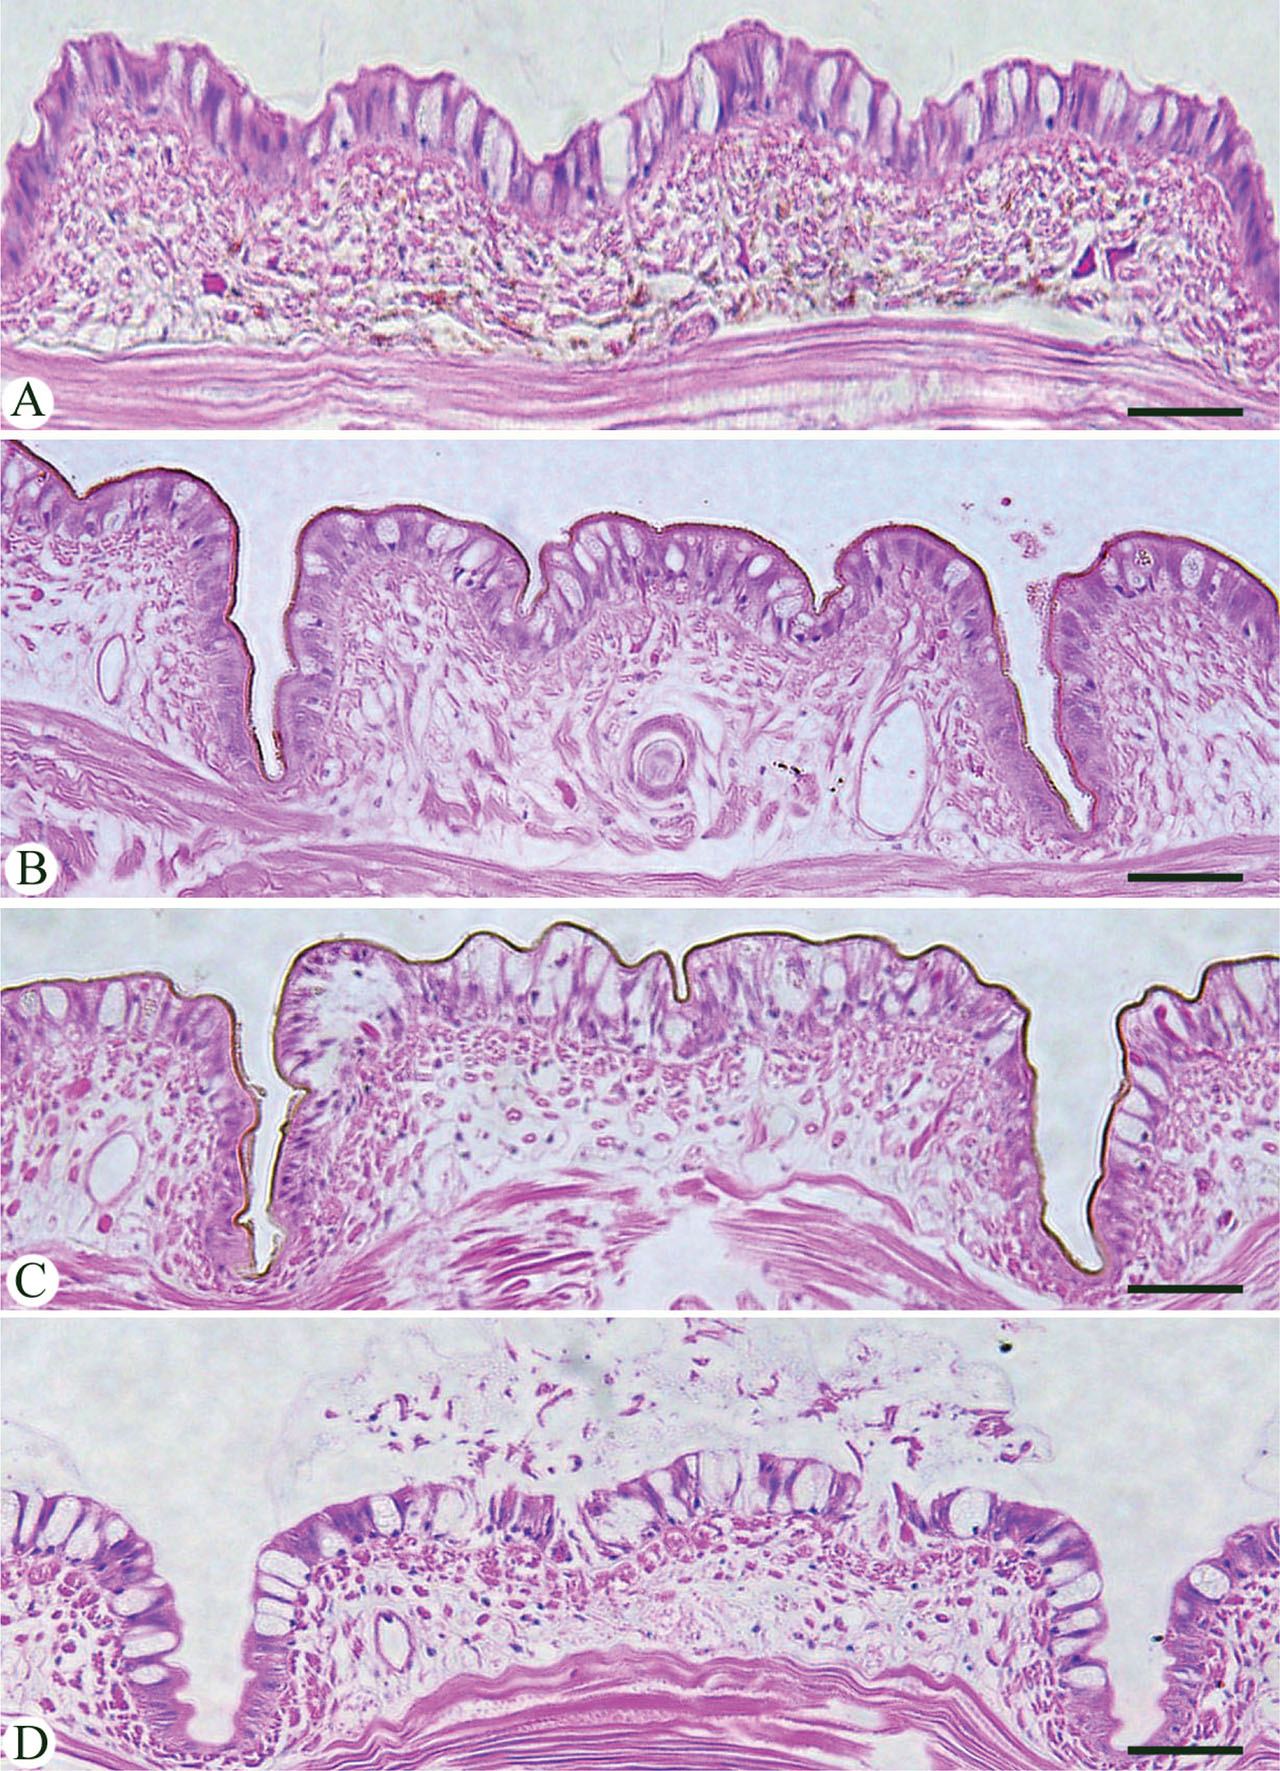
Fig 7.
Cuticle thickness of E. fetida with various treatments. (A) worms in dist. H2O (control). (B) worms in OESME (200 mg/ml). (C) worms in OELME (200 mg/ml). (D) worms in mebendazole. Scale bar = 25 µm