
Table 1.
Demographic data and SIgA levels in both groups studied: infected and non-infected
| Examined persons | without evidence of enterobiasis and/or other intestinal parasitic infection | with laboratory-confirmed enterobiasis | ||||||
|---|---|---|---|---|---|---|---|---|
| Children & adolescents | Adults | Male | Female | Children & adolescents | Adults | Male | Female | |
| No | 34 | 6 | 19 | 21 | 97 | 5 | 46 | 56 |
| SIgA values (µg/ml) | ||||||||
| Minimum | 27.50 | 27.50 | 27.50 | 27.50 | 27.50 | 37.50 | 27.50 | 27.50 |
| Maximum | 8999 | 1357 | 8999 | 4839 | 13916 | 981.5 | 13916 | 9704 |
| Range | 8971 | 1330 | 8971 | 4811 | 13889 | 944.0 | 13889 | 9676 |
| Mean | 1978 | 474,3 | 2060 | 1473 | 1815 | 481.7 | 1901 | 1625 |
| Std. Deviation | 2162 | 608.5 | 2561 | 1518 | 2562 | 398.2 | 2774 | 2300 |
| Lower 95% CI of mean | 1223 | −164.3 | 825.8 | 782.5 | 1299 | −12.84 | 1078 | 1009 |
| Upper 95% CI of mean | 2732 | 1113 | 3295 | 2164 | 2331 | 976.1 | 2725 | 2241 |
| Mann Whitney test | exact P value = 0.0295* | exact P value = 0.5915 | exact P value = 0.2808 | exact P value = 0.4568 | ||||
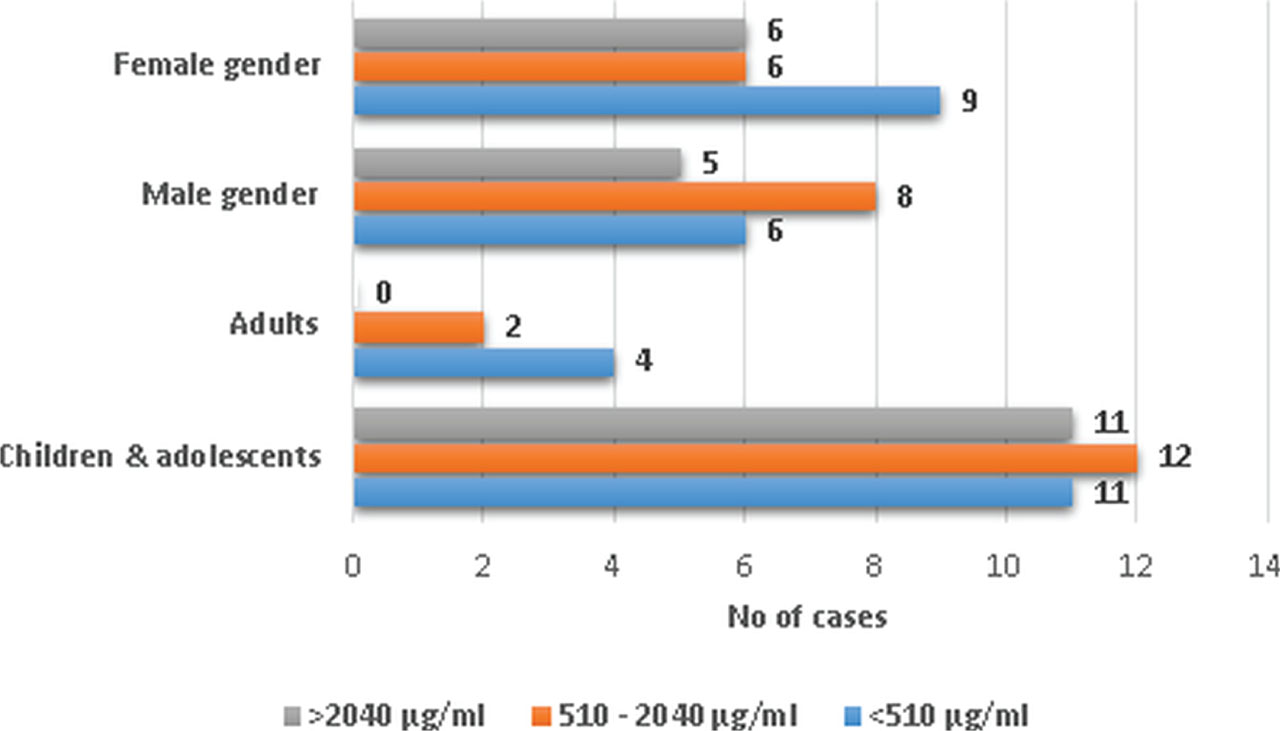
Fig. 1.
Distribution of secretory IgA values in clinically healthy controls by age group, gender, and the reference range of the diagnostic kit used.
Table 2.
Mean values of intestinal SIgA concentrations in the studied children, relative to the reported clinical symptom.
| No | SIgA mean value (μg/ml) | Std. Deviation | SIgA min. value (μg/ml) | SIgA max. value (μg/ml) | |
|---|---|---|---|---|---|
| Asymptomatic persons | 61 | 1 588.54 | 2046 | 27.5 | 9 422.44 |
| Patients with symptoms: | 36 | 2 198.74 | 3254 | 27.5 | 13 916.00 |
| perianal itching | 17 | 3 559.54 | 3949 | 27.5 | 13 916.00 |
| abdominal pain | 10 | 1 383.66 | 2493 | 27.5 | 8 064.51 |
| diarrhea | 5 | 545.53 | 654 | 27.5 | 1 488.38 |
| bruxism | 3 | 556.25 | N/A | 137.50 | 813.75 |
| eosinophilia | 1 | 409.40 | 366 | 409.40 | 409.40 |
| ANOVA test, P value = 0.049 | |||||
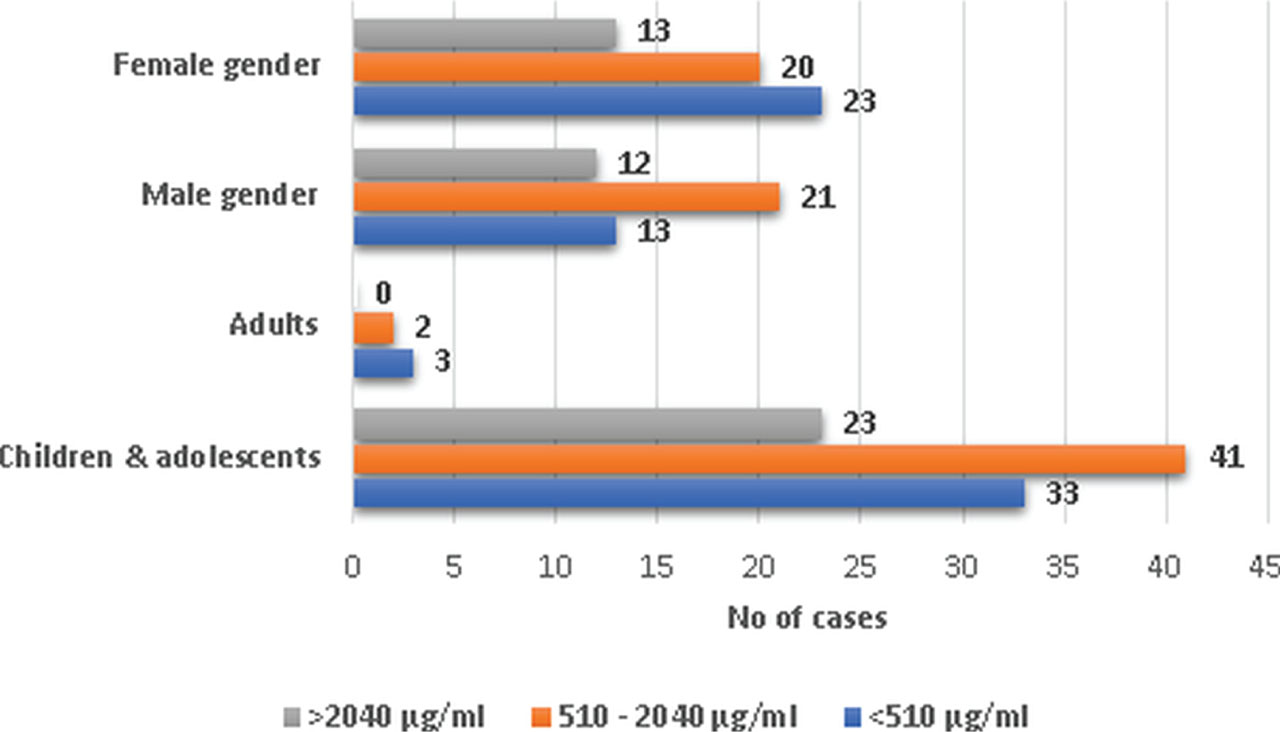
Fig. 2.
Distribution of secretory IgA values in persons with enterobiasis by age group, gender, and reference range of the diagnostic kit used.
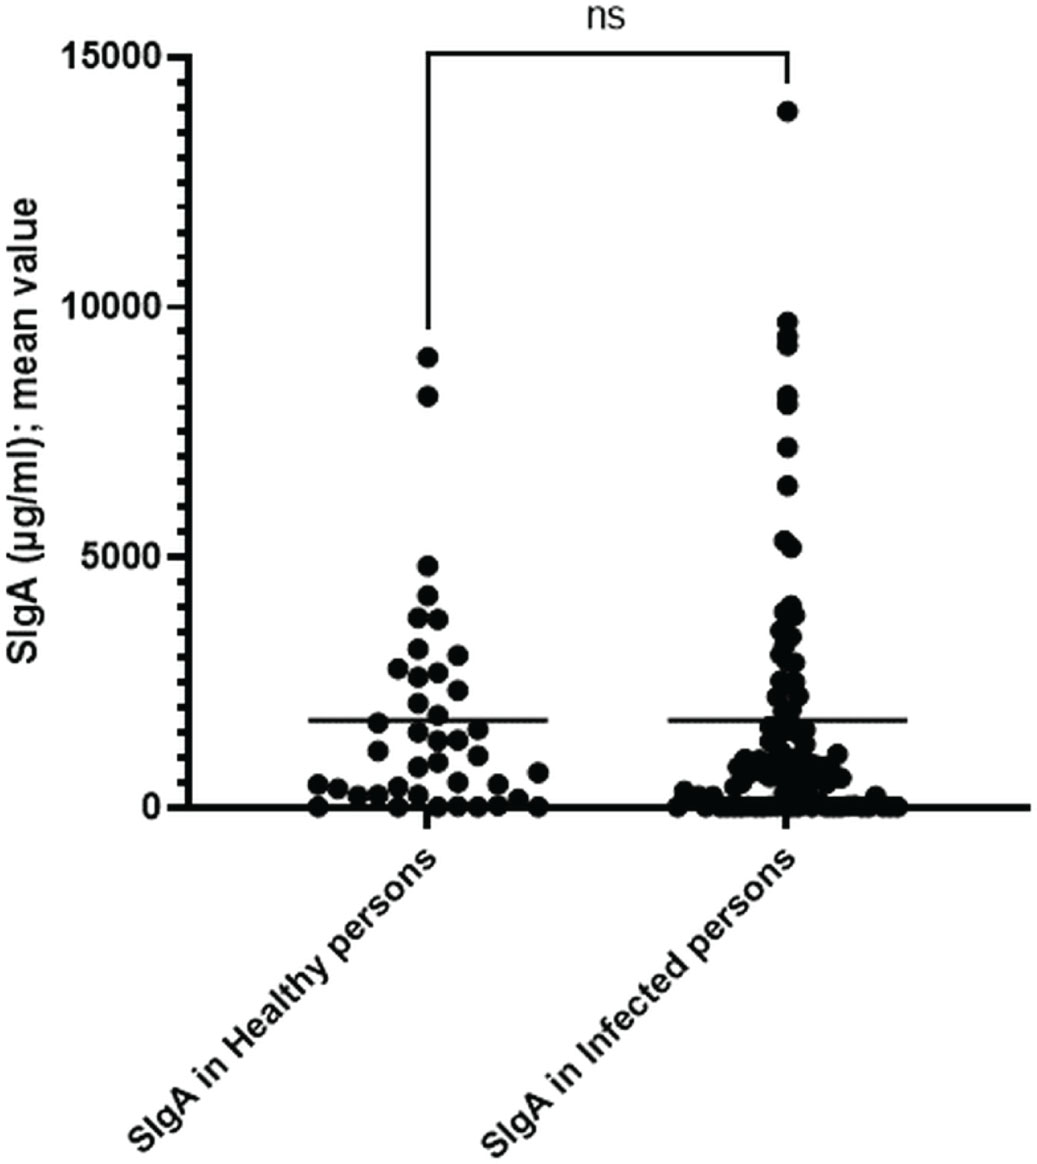
Fig. 3.
Concentrations of the fecal secretory IgA antibodies in healthy individuals and patients with enterobiasis. To establish statistically significant differences in the values of SIgA, a Mann-Whitney test was performed (exact P value = 0.4991).