
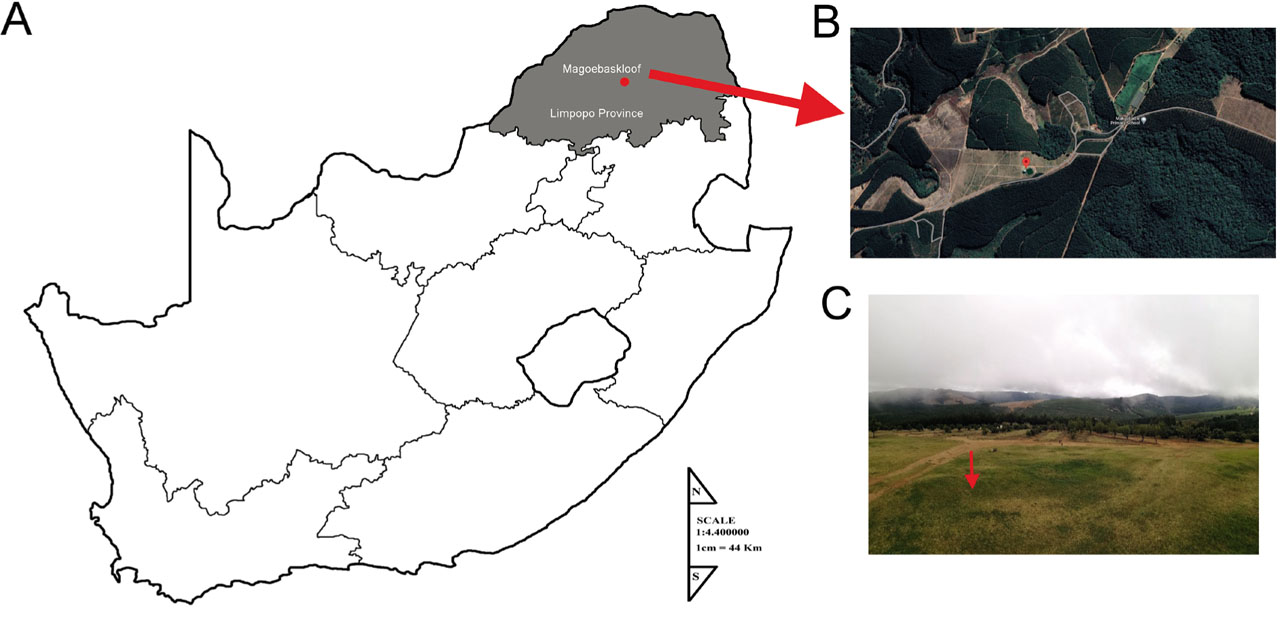
Fig. 1.
Sampling location for M. hawaiiensis in Magoebaskloof mountain of Limpopo Province, South Africa. (A) South Africa map. (B) Magoebaskloof mountain. (C) sampling site.
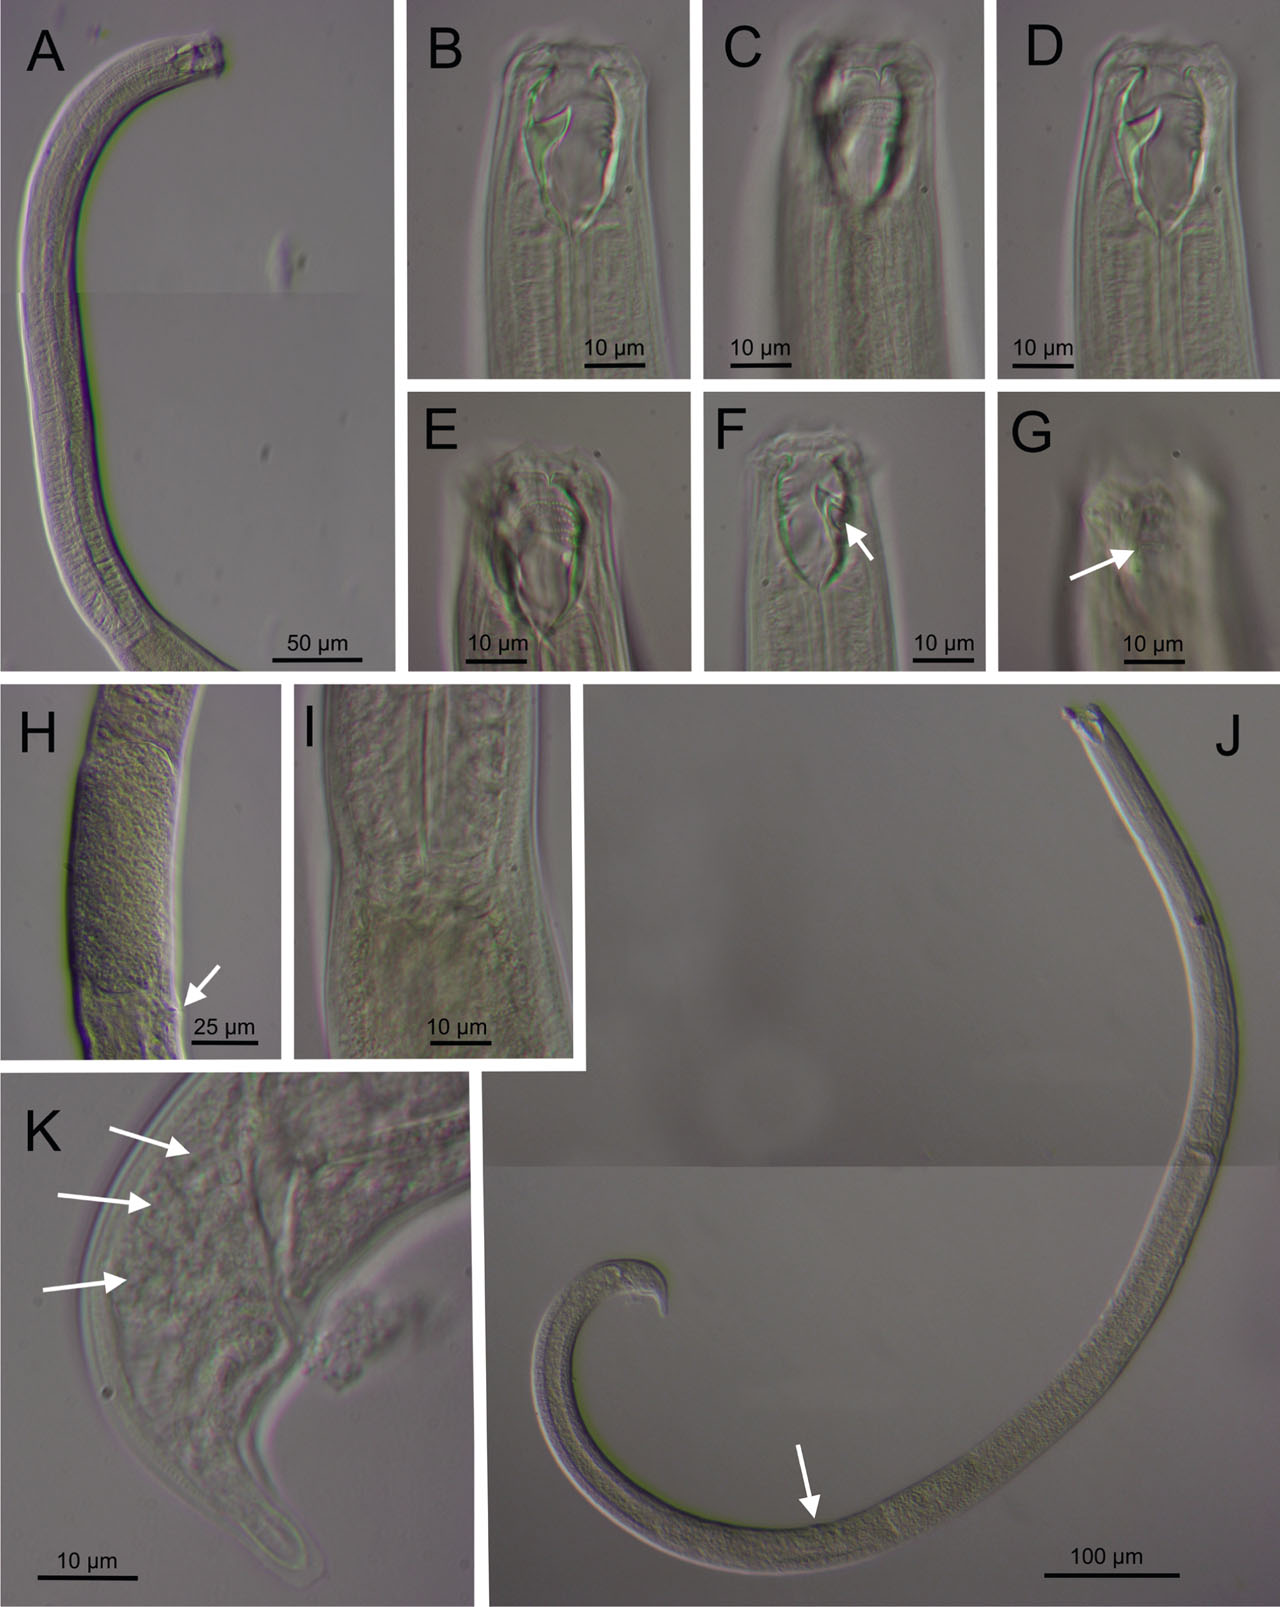
Fig. 2.
Mylonchulus hawaiiensis (Cassidy, 1931) Goodey, 1951. (A) neck. (B-G) anterior end (arrow pointing to, F: reserve dorsal tooth; G: amphid). (H) egg (arrow pointing to vulva. (I) pharyngeal-intestinal junction. (J) entire body (arrow pointing to vulva). (K) female tail (arrow pointing to caudal glands).
Table 1.
Measurements of Mylonchulus hawaiiensis (Cassidy, 1931) Goodey, 1951 from South Africa [all measurements in µm and in the format: mean ± standard deviation (range)].
| Body length | 1183.5 ± 56.9 (1139 – 1259) |
| a | 36.2 ± 6.5 (30.7 – 45.6) |
| b | 3.3 ± 0.1 (3.3 – 3.4) |
| c | 36.6 ± 7.7 (29.3 – 47.5) |
| c′ | 1.3 ± 0.4 (1.0 – 1.7) |
| V | 65.8 ± 0.8 (65 – 67) |
| G1 | 22.6 ± 5.1 (17 – 28) |
| G2 | 18.6 ± 2.8 (16 – 22) |
| Lip region diameter | 22.3 ± 1.3 (21 – 24) |
| Buccal cavity length | 30.0 ± 1.4 (28 – 31) |
| Buccal cavity diameter | 10.3 ± 1.3 (9 – 12) |
| Amphidial position to ant. end | 11.7 ± 5.1 (6 – 16) |
| Amphidial aperture diameter | 4.8 ± 0.5 (4 – 5) |
| Foramen ventral | 6.0 ± 0.8 (5 – 7) |
| Foramen dorsal | 5.5 ± 1.3 (4 – 7) |
| Dorsal tooth width | 3.9 ± 0.7 (3 – 5) |
| Dorsal tooth length | 8.0 ± 0.8 (7 – 9) |
| Dorsal tooth apex% | 68.6 ± 2.1 (67 – 71) |
| Nerve ring to ant. end | 92.3 ± 7.9 (82 – 99) |
| Excretory pore to ant. end | 105.3 ±12.5 (93 – 118) |
| Pharynx | 330.0 ± 12.3 (316 – 339) |
| Neck | 355.8 ± 12.8 (344 – 370) |
| Cardia length | 7.3 ± 2.2 (5 – 10) |
| Cardia diameter | 8.0 ± 1.4 (7 – 10) |
| Body diameter at neck | 34.5 ± 1.3 (33 – 36) |
| Body diameter at mid body | 33.5 ± 6.0 (25 – 39) |
| Body diameter at anus | 25.3 ± 1.5 (24 – 27) |
| Cuticle | 1.4 ± 0.3 (1.2 – 1.8) |
| Vagina | 9.0 ± 1.0 (8 – 10) |
| Anterior genital branch | 269.7 ± 55.6 (207 – 313) |
| Anterior ovary | 120.5 ± 26.2 (102 – 139) |
| Posterior genital branch | 223.0 ± 30.5 (202 – 258) |
| Posterior ovary | 106.0 ± 11.3 (98 – 114) |
| Rectum | 19.8 ± 2.1 (18 – 22) |
| Tail | 33.5 ± 7.9 (24 – 43) |
Table 2.
The comparative measurements for M. hawaiiensis populations.
| Reference | Location | L | a | b | c | c′ | V | Lip region width | Buccal cavity length | Buccal cavity width | Dorsal tooth apex% | Tail length |
|---|---|---|---|---|---|---|---|---|---|---|---|---|
| Cassidy 1931 | Hawaii | 1000 | 33.3 | 3.6 | 25 | 1.3 | 61 | 27.1 | 27 | 13 | 79 | 40 |
| Coetzee 1966 | South Africa | 800 – 1500 | 19 – 30 | 3.1 – 4.1 | 21 – 35 | 1.8 | 53 – 63 | 28.8 | 30.3 | 17.4 | 82 | 45.5 |
| Mulvey & Jansen, 1967 | Nigeria | 900 – 1300 | 22 – 32 | 3.1 – 4.0 | 26.3 – 43.5 | 1.5 | 54 – 62 | 22.5 | 20 – 23 | 11.0 – 13.0 | 73 | 23 – 42 |
| Jairajpuri, 1970 | India | 870 – 980 | 22 – 26 | 3.2 – 3.6 | 27 – 31 | 1.8 – 1.9 | 58 – 60 | 20 – 25 | 22 – 25 | 14 – 17 | 79 | 30 – 40 |
| Baqri & Jairajpuri, 1973 | El Salvador | 600 – 840 | 19 – 20 | 3.0 – 3.1 | 25 – 27 | – | 60 – 63 | – | 20 – 23 | – | – | 23 – 35 |
| Khan & Jairajpuri, 1979 | India | 700 – 1350 | 17 – 30 | 2.9 – 4.0 | 25 – 54 | – | 50 – 70 | – | 17 – 30 | 10.0 – 16.0 | 65 – 85 | 24 – 45 |
| Patil & Khan, 1982 | India | 780 – 1300 | 21 – 30 | 2.6 – 3.8 | 22 – 30 | 1.5 – 2.0 | 54 – 61 | 20 – 25 | 21 – 26 | 11.0 – 17.0 | 57 – 75 | 37 – 43 |
| Jairajpuri & Khan, 1982 | India | 700 – 1350 | 17 – 30 | 2.9 – 4.0 | 25 – 54 | 1.9 | 51 – 58 | 16 – 29 | 17 – 30 | 10.0 – 16.0 | 70 – 85 | 24 – 45 |
| Chaves 1990 | Argentina | 960 – 1370 | 23.7 – 32.0 | 3.2 – 3.9 | 20.0 – 33.4 | 1.5 – 1.8 | 55 – 60 | 23 – 25 | 22 – 27 | 15.0 – 17.0 | 73 – 77 | 34 – 49 |
| Zullini et al., 2002 | Costa Rica | 1200 | 22 | 3.5 | 35 | 1.3 | 59 | 25 | 27 | 14 | – | 34 |
| Shokoohi et al., 2013 | Iran | 925 – 1137 | 19.3 – 28.8 | 3.3 – 4.2 | 19.2 – 27.0 | 1.4 – 2.0 | 50 – 62 | 21 – 30 | 24 – 31 | 11.0 – 17.0 | 57 – 75 | 38 – 49 |
| Shokoohi and Moyo, 2022 | Iran | 1195 | 24 | 3.7 | 23.5 | 1.7 | 55.3 | 24 | 27.3 | 14.8 | 64 | 43.3 |
| Pradana & Yoshiga, 2023 | Indonesia | 622 – 1300 | 15.6 – 23.3 | 2.2 – 4.0 | 36.7 – 37.8 | 1.3 – 1.5 | 50 – 61 | 23 – 34 | 27 – 30 | 14 – 15 | 75 | 17 – 35 |
| Present study | South Africa | 1139 – 1259 | 30.7 – 45.6 | 3.3 – 3.4 | 29.3 – 47.5 | 1.0 – 1.7 | 65 – 67 | 21 – 24 | 28 – 31 | 9.0 – 12.0 | 67 – 71 | 24 – 43 |
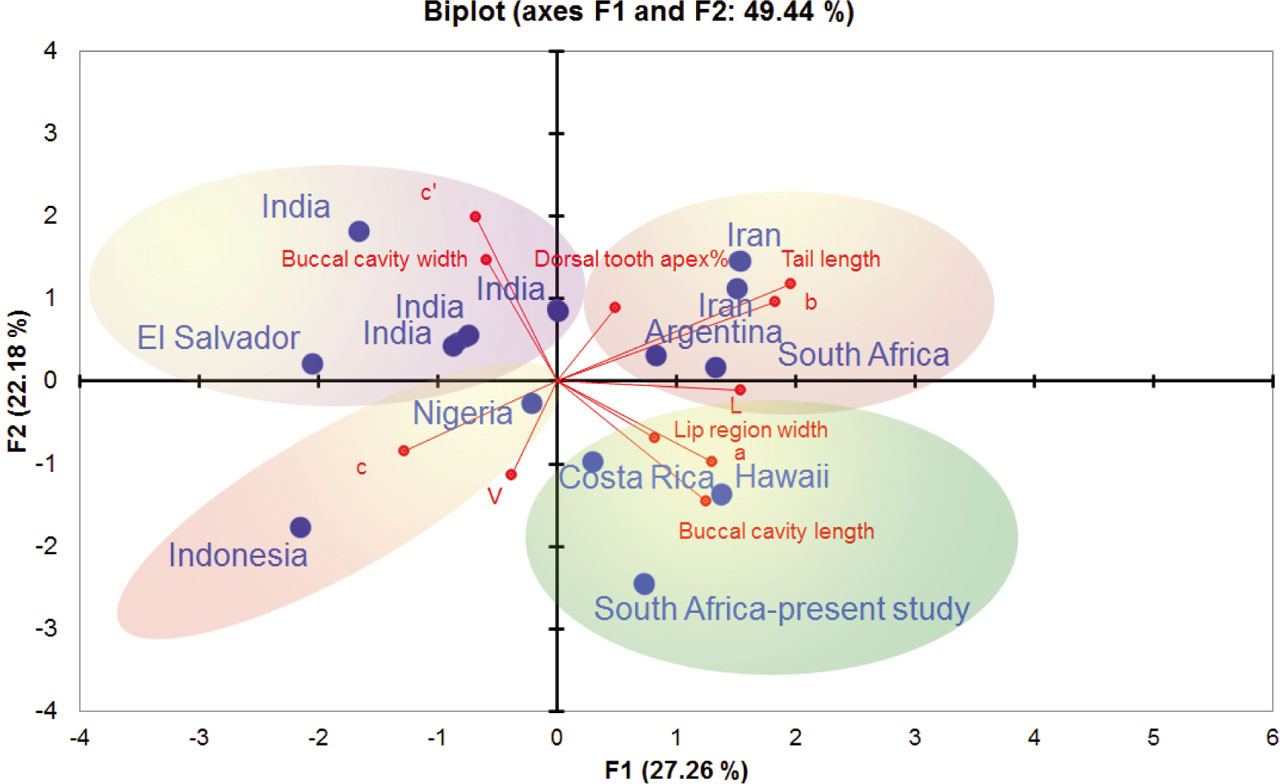
Fig. 3.
Principal component analysis (PCA) plot for M. hawaiiensis based on the important morphological characters.
Table 3.
Loading factor of the variables of the species of M. hawaiiensis.
| F1 | F2 | |
|---|---|---|
| L | 0.661 | −0.043 |
| a | 0.555 | −0.394 |
| b | 0.783 | 0.388 |
| c | −0.548 | −0.346 |
| c′ | −0.291 | 0.808 |
| V | −0.162 | −0.463 |
| Lip region width | 0.353 | −0.278 |
| Buccal cavity length | 0.536 | −0.592 |
| Buccal cavity width | −0.251 | 0.598 |
| Dorsal tooth apex% | 0.211 | 0.360 |
| Tail length | 0.842 | 0.480 |
Table 4.
Factor score for the species of M. hawaiiensis from different locations.
| Observation | Sample size (n) | Reference | F1 | F2 |
|---|---|---|---|---|
| Hawaii | 1 | Cassidy, 1931 | 1.821 | −1.743 |
| South Africa | 16 | Coetzee, 1966 | 1.764 | 0.214 |
| Nigeria | 18 | Mulvey & Jansen, 1967 | −0.274 | −0.352 |
| India | 5 | Jairajpuri, 1970 | −1.013 | 0.632 |
| El Salvador | 2 | Baqri & Jairajpuri, 1974 | −2.687 | 0.262 |
| India | 200 | Khan & Jairajpuri, 1979 | −2.168 | 2.261 |
| India | 28 | Patil & Khan, 1982 | 0.006 | 1.089 |
| India | 1 | Jairajpuri & Khan, 1982 | −1.097 | 0.580 |
| Argentina | 10 | Chaves, 1990 | 1.110 | 0.365 |
| Costa Rica | 1 | Zullini et al., 2002 | 0.402 | −1.212 |
| Iran | 5 | Shokoohi et al., 2013 | 2.005 | 1.819 |
| Iran | 10 | Shokoohi & Moyo, 2022 | 1.985 | 1.403 |
| Indonesia | 4 | Pradana & Yoshiga, 2023 | −2.832 | −2.211 |
| South Africa | 10 | present study | 0.977 | −3.106 |
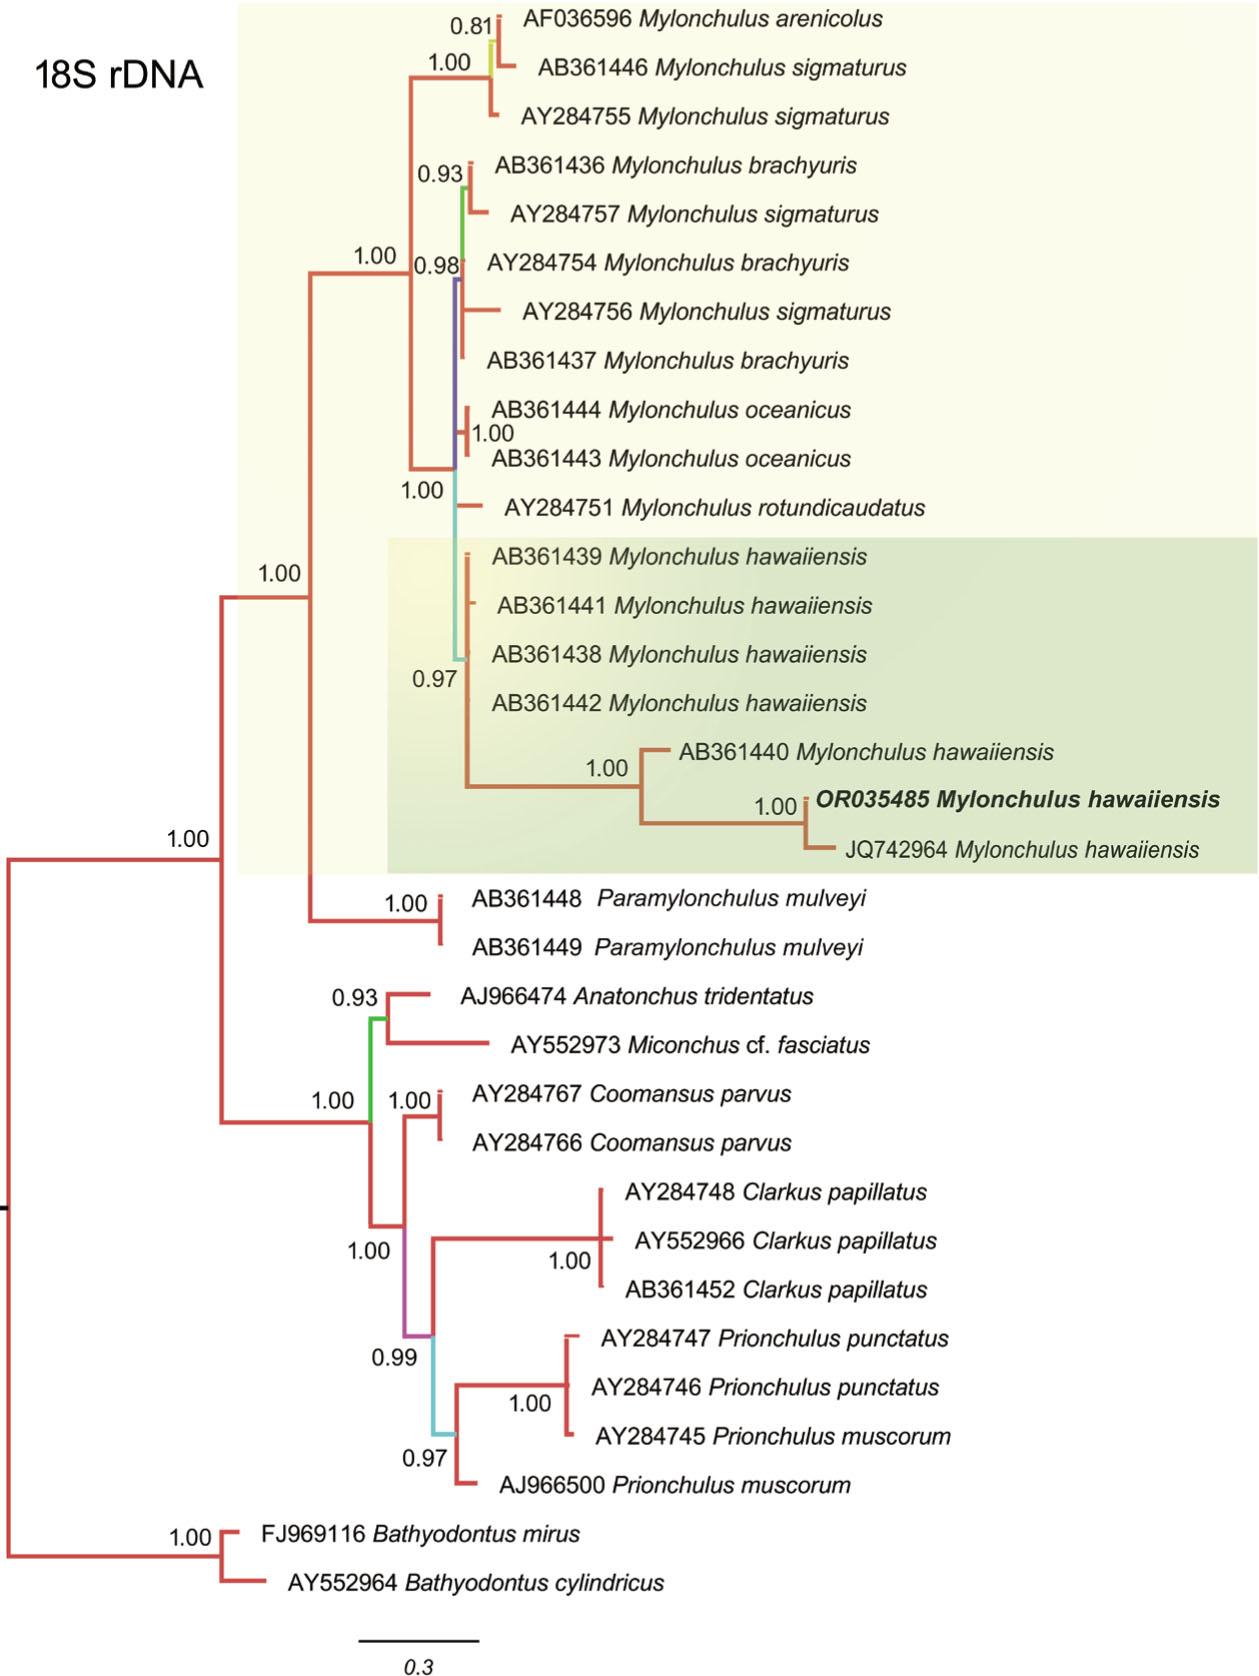
Fig. 4.
Phylogenetic tree based on 18S rDNA, including M. hawaiiensis from South Africa.
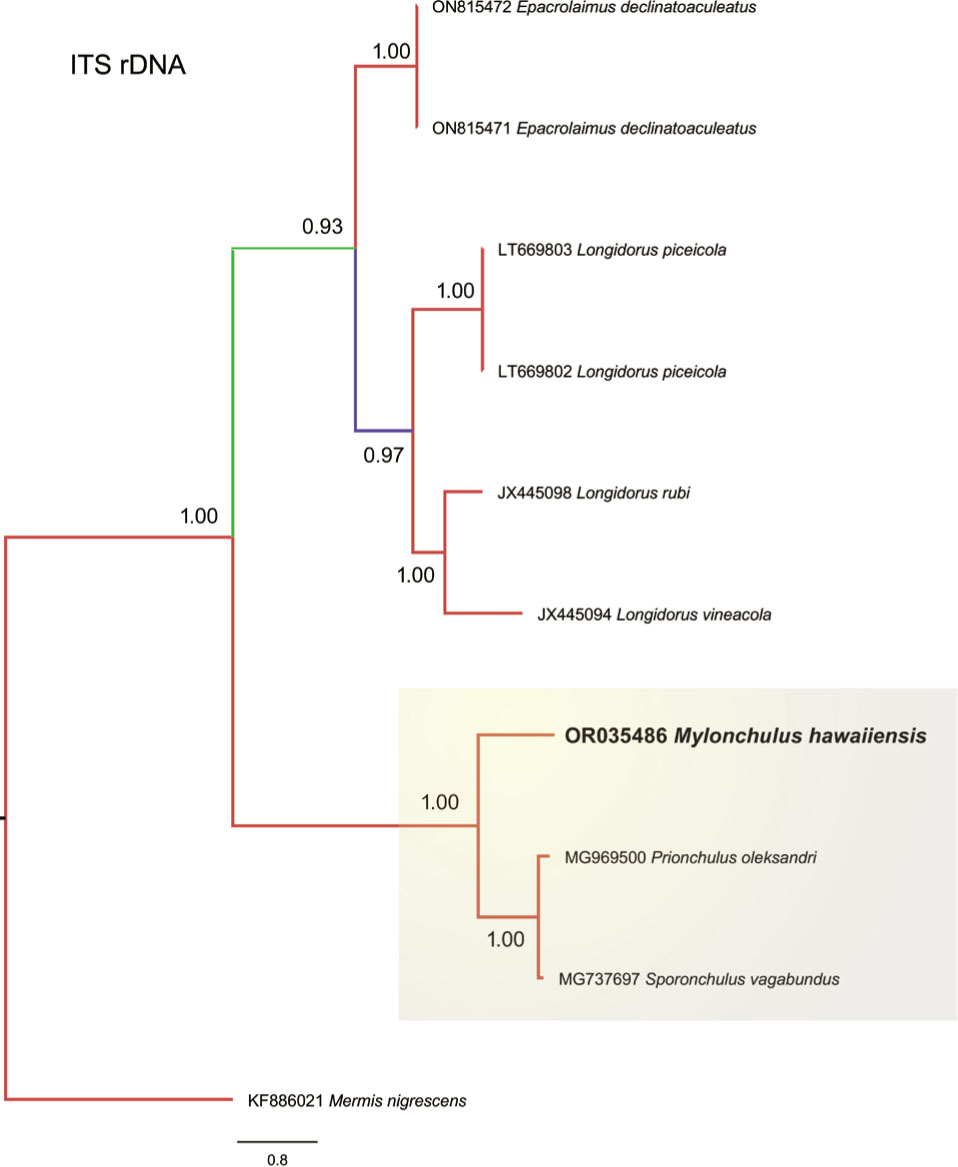
Fig. 5.
Phylogenetic tree based on ITS rDNA, including M. hawaiiensis from South Africa.
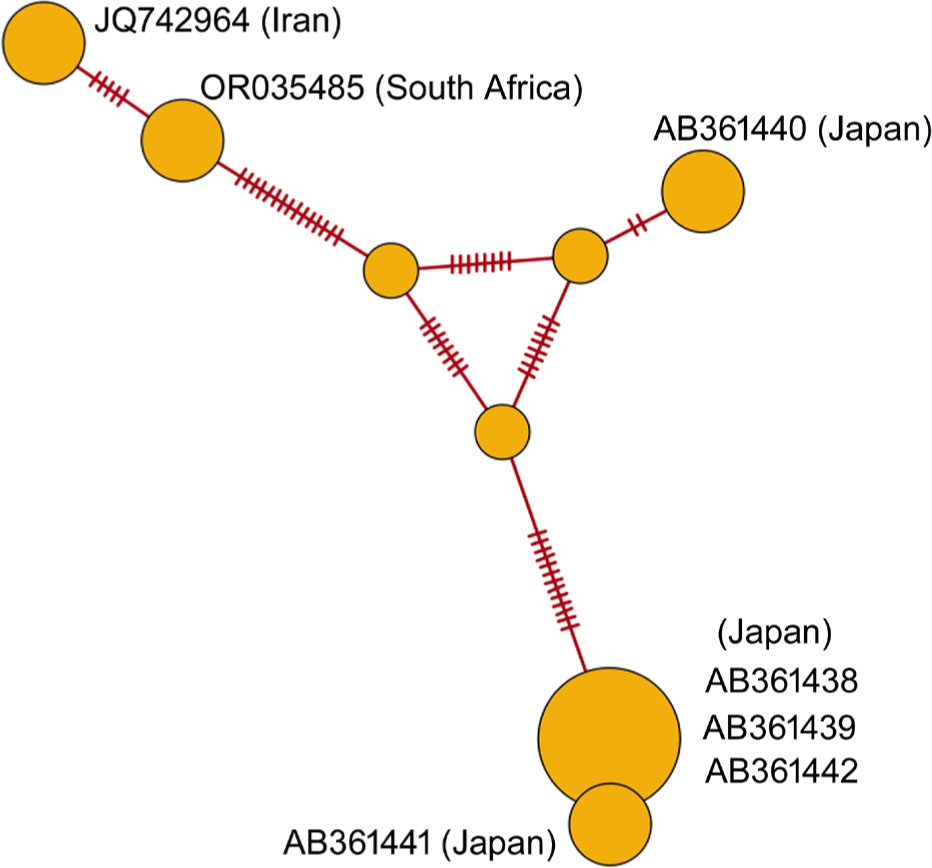
Fig. 6.
Network analysis based on Median Neighbor Joining analysis of M. hawaiiensis.