
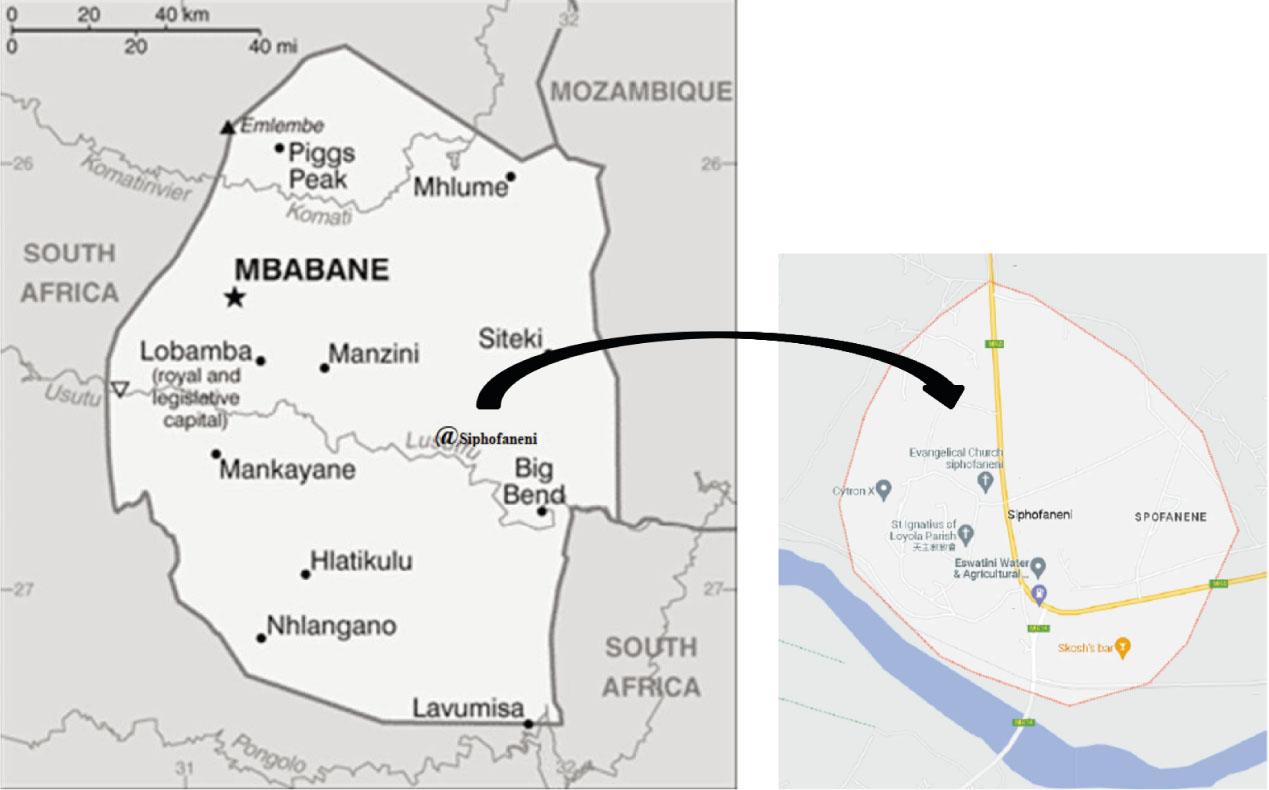
Fig. 1.
Socio-demographic characteristics of participants_
| Variable | Sample size (n) | % |
|---|---|---|
| Name of school | ||
| Othandweni Primary | 48 | 24.0 |
| Madlenya Primary | 42 | 21.0 |
| Siphofaneni Primary | 71 | 35.5 |
| Mkhweli Primary | 39 | 19.5 |
| Age Group of participants | ||
| 10–14 | 170 | 85.0 |
| ≥15 | 30 | 15.0 |
| Gender | ||
| Male | 91 | 45.5 |
| Female | 109 | 54.5 |
| Present Grade | ||
| Grade 5 | 94 | 47.0 |
| Grade 6 | 68 | 34.0 |
| Grade 7 | 38 | 19.0 |
Prevalence and distribution of Schistosomiasis_
| Variable | Sample size (n) | % |
|---|---|---|
| Reported blood in urine | ||
| Yes | 14 | 7.0 |
| No | 186 | 93.0 |
| Treated for bilharzia in the past 6 months | ||
| Yes | 7 | 3.5 |
| No | 193 | 96.5 |
| Prevalence of schistosomiasis | ||
| Positive | 32 | 16.0 |
| Negative | 168 | 84.0 |
| Mean number of eggs in 10ml | ||
| 0 eggs | 170 | 85.0 |
| 200 eggs | 24 | 12.0 |
| 400 eggs | 6 | 3.0 |
| Presence of RBC in Urine | ||
| Positive | 82 | 41.0 |
| Negative | 118 | 59.0 |
Factors associated with the prevalence of Schistosomiasis_
| Variable | Schistosomiasis | |||
|---|---|---|---|---|
| Negative | Positive | χ2 | p-value | |
| Gender | 0.365 | 0.391 | ||
| Males | 78 | 13 | ||
| Females | 90 | 19 | ||
| Reported blood in urine | ND | 0.001* | ||
| No | 168 | 18 | ||
| Yes | 0 | 14 | ||
| Present grade | 0.253 | 0.823 | ||
| Grade 5 | 80 | 14 | ||
| Grade 6 | 57 | 11 | ||
| Grade 7 | 31 | 7 | ||
| History of bilharzia in the last 6 months | 1.382 | 0.240 | ||
| Yes | 161 | 32 | ||
| No | 7 | 0 | ||
| Number of eggs in 10 ml urine | 170.942 | 0.001* | ||
| 0 | 167 | 3 | ||
| 200 | 1 | 23 | ||
| 400 | 0 | 6 | ||
| Presence of RBC in urine | 49.167 | 0.001* | ||
| No | 117 | 1 | ||
| Yes | 51 | 31 | ||