
Table 1
Binary logistic regression analysis for factors potentially associated with Paramphistomum infection in ruminants of district Narowal, Punjab Pakistan.
| Yes | No | ||||
|---|---|---|---|---|---|
| Age | Adult | 190 | 117 | 33.027 (0.000)* | 0.002 (0.000 – 0.018) |
| Sex | Male | 126 | 129 | 53.253 (0.000)* | 8.968 (4.975 – 16.165) |
| Species | Cattle | 76 | 34 | 29.590 (0.000)* | 10.997 (4.636 – 26.090) |
| Goat | 53 | 68 | 28.446 (0.000)* | 328.390 (39.053 – 2761.354) | |
| Sheep | 22 | 31 | 0.049 (0.825) | 1.089 (0.513 – 2.310) | |
| Buffalo | 65 | 35 | – | – |
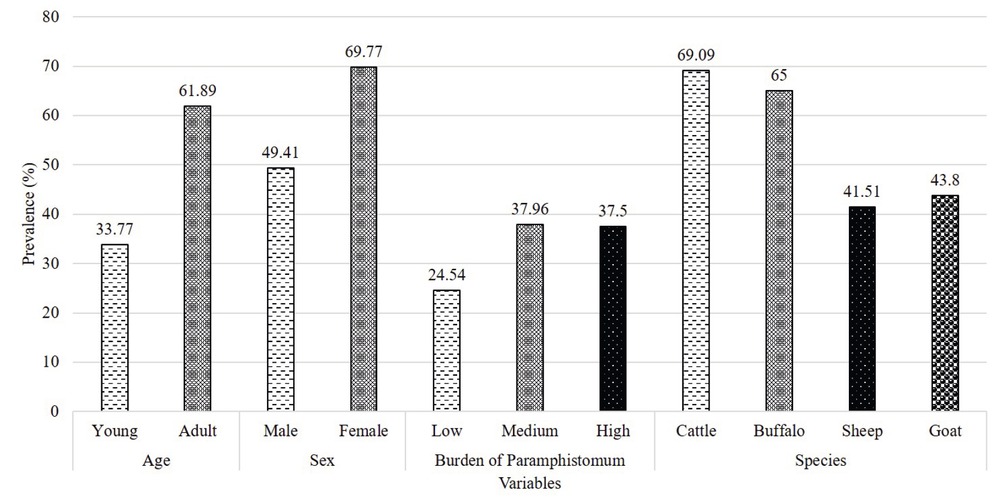
Fig. 1
The percentage prevalence and burden of Paramphistomum spp. in ruminants of district Narowal, Punjab Pakistan
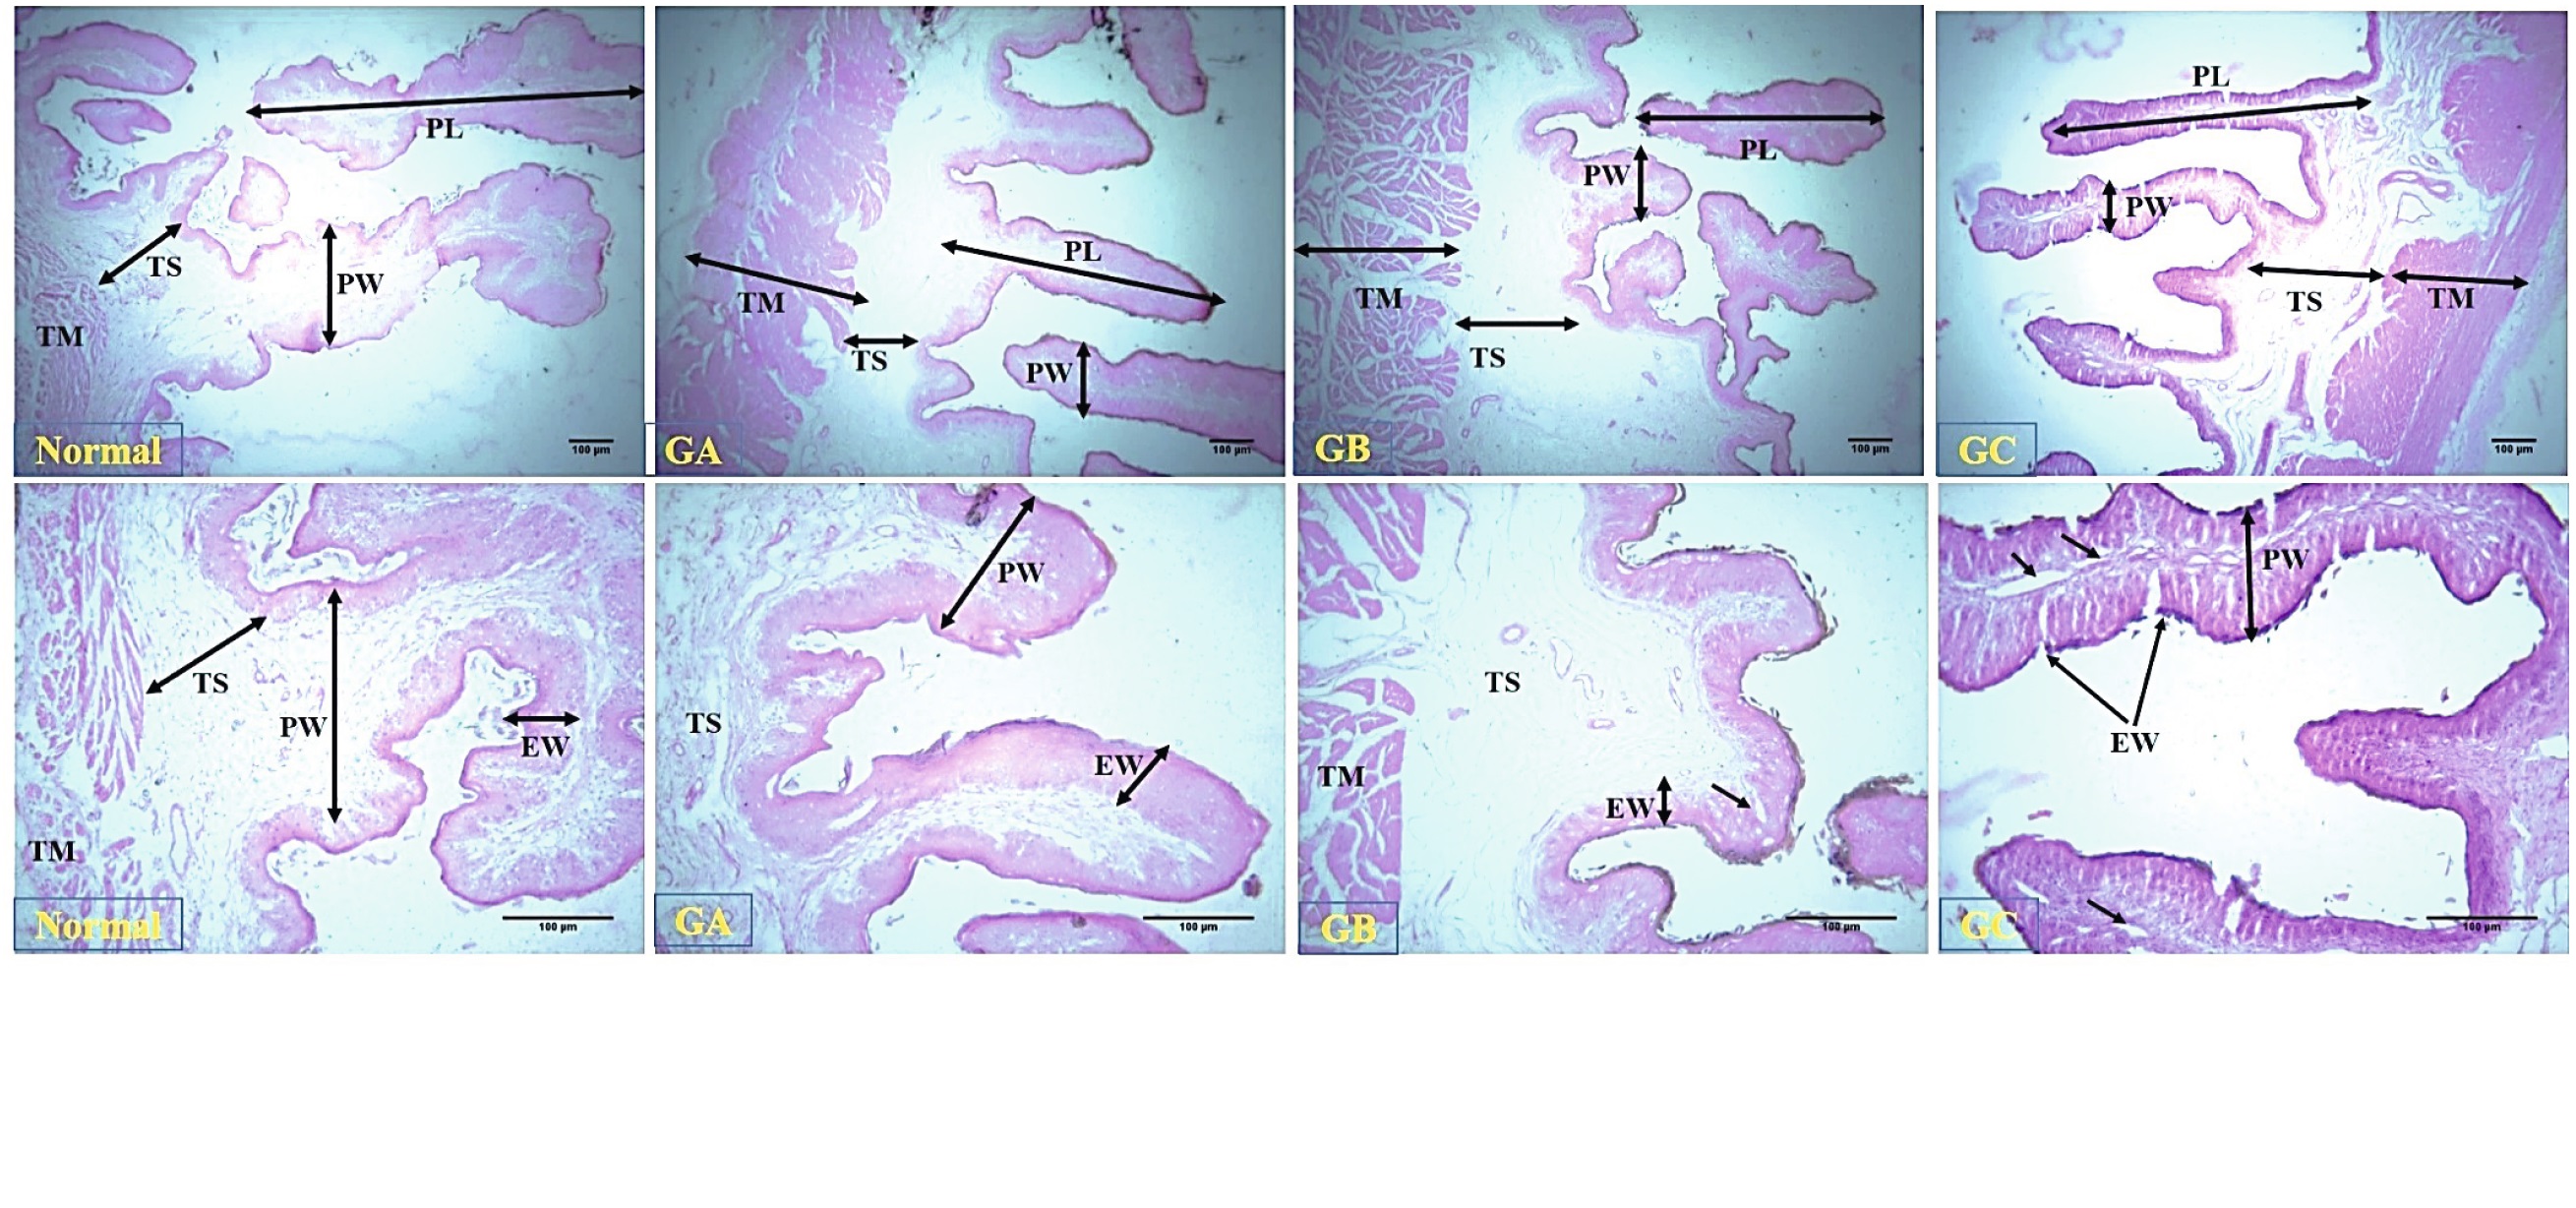
Fig. 2
Histo-micrograph of different ruminal sections collected from different groups of large ruminants. Ruminal sections showing normal tunics of rumen along with the epithelial thickness, ruminal papilla length and width, tunica submucosa and muscularis externae. These parameters are recorded significantly decreased with the parasitic loads in different groups. The disruption of epithelium (ED) in the ruminal mucosa is seen in the GB and GC. Furthermore, compromised cell junctions in the epithelium (small black arrow) are also seen in GB and GC (H&E, Upper row 40X, lower row 100X, scale bar 100μm). Normal: Normal or control negative group, GA: Animals with parasitic load of 10-20/5cm2, Group B (GB) animals with the parasitic load 20-40/5cm2.Group C (GC): Animal with parasitic load >41/5cm2. PL: Ruminal papilla length, PW: Ruminal papilla width, TS: Tunica submucosa, TM: Muscularis externae, EW: Epithelium thickness.
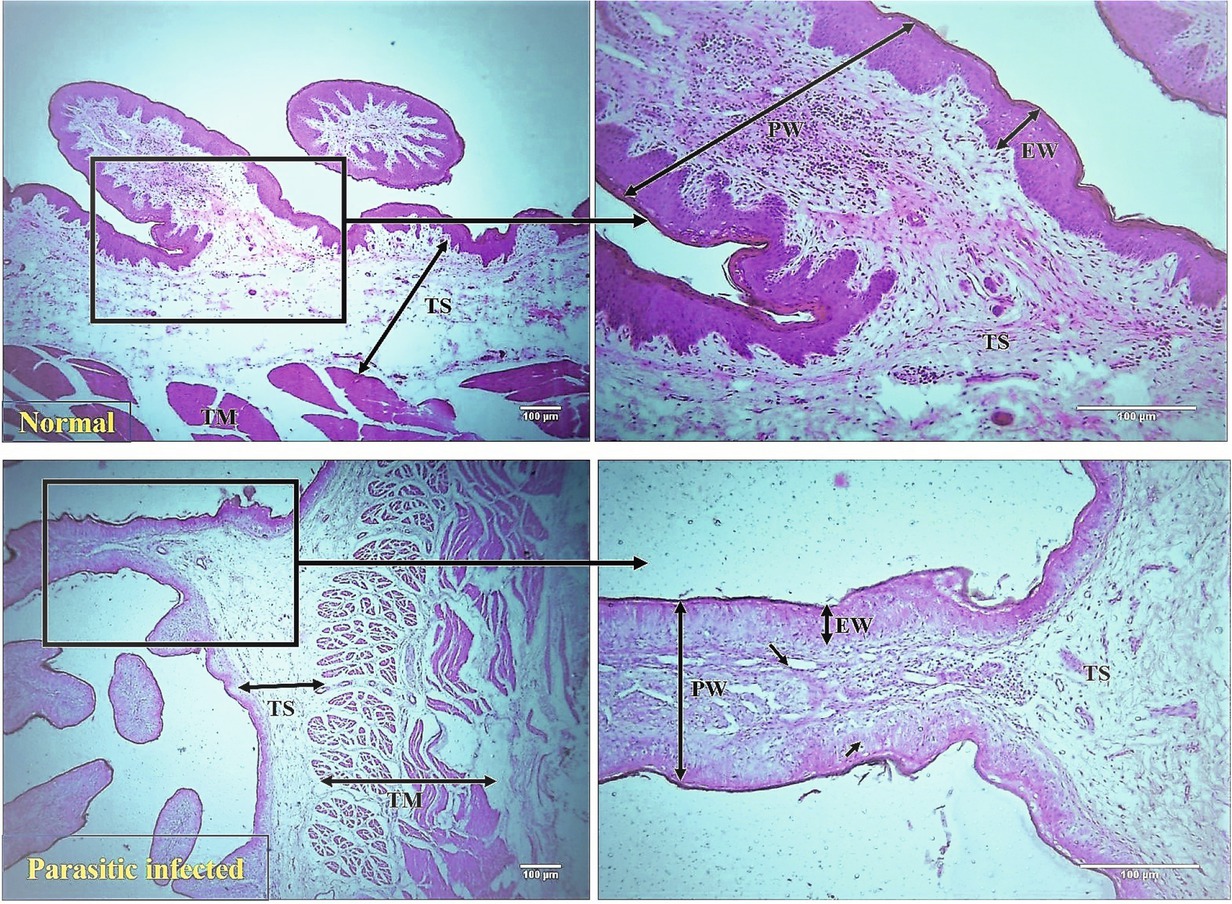
Fig. 3
Histo-micrograph of different ruminal sections collected from different groups of small ruminants. Ruminal sections showing normal tunics of rumen along with the epithelial thickness, ruminal papilla length and width, tunica submucosa and muscularis externae in upper row. These parameters are recorded significantly decreased with the parasitic loads as showed in lower row. The disruption of epithelium (small arrow) in the ruminal mucosa (H&E, left column 40X, right column100X, scale bar 100μm).
Table 2
Analysis of Means ± SEM of different histological features of rumens amongst different groups of large and small ruminants of Narowal district, Punjab, Pakistan.
| Parameters (μm) | Normal | Group A | Group B | Group C |
|---|---|---|---|---|
| Large Ruminants | ||||
| Epithelium Thickness | 46.96±2.05a | 35.49±1.93b | 31.12±1.82b | 31.07±1.68b |
| Ruminal Papilla Length | 645.34±10.27a | 562.98±17.57 b | 448.42±6.48c | 424.42±15.12c |
| Ruminal Papilla Width | 310.63±25.47a | 290.80±27.88 a | 284.52±4.15 a | 209.55±6.31b |
| Tela Submucosa | 213.39±8.61a | 194.69±6.64ab | 198.08±10.28ab | 192.01±5.54ab |
| Muscularis Externae | 714.83±31.76a | 697.85±34.71b | 533.91±16.12c | 525.35±12.82c |
| Small Ruminants | ||||
| Epithelium Thickness | 41.65±3.24 a | 38.2±0.76 a | 29.76±4.76 b | 30.78±0.97 b |
| Ruminal Papilla Length | 712.87±9.27 a | 680.37±12.72 a | 503.46±15.7 b | 418.30±17.36 c |
| Ruminal Papilla Width | 205.32±7.5 a | 187.97±7.5 a | 198.31±4.2 a | 190.47±10.3 a |
| Tela Submucosa | 177.45±8.3 a | 175.37±9.1 a | 168.59±6.3 a | 170.67±10.2 a |
| Muscularis Externae | 503.46±23.29 a | 498.71±15.78 a | 415.60±12.08 b | 405.36 ±16.32 b |
[i] Means sharing with different superscripts in a row (a, b, c) are statistically different at P<0.05
Means sharing with superscript “a” is statistically different from means sharing with superscript “b” and “c” and vice versa. Superscript “a” represents the significant higher means, lower value represented by superscript “b” and significantly least or lowest value amongst the groups represented by the superscript “c”.