
Fig 1
Fig 2
Fig 3
Fig 4
Fig 5
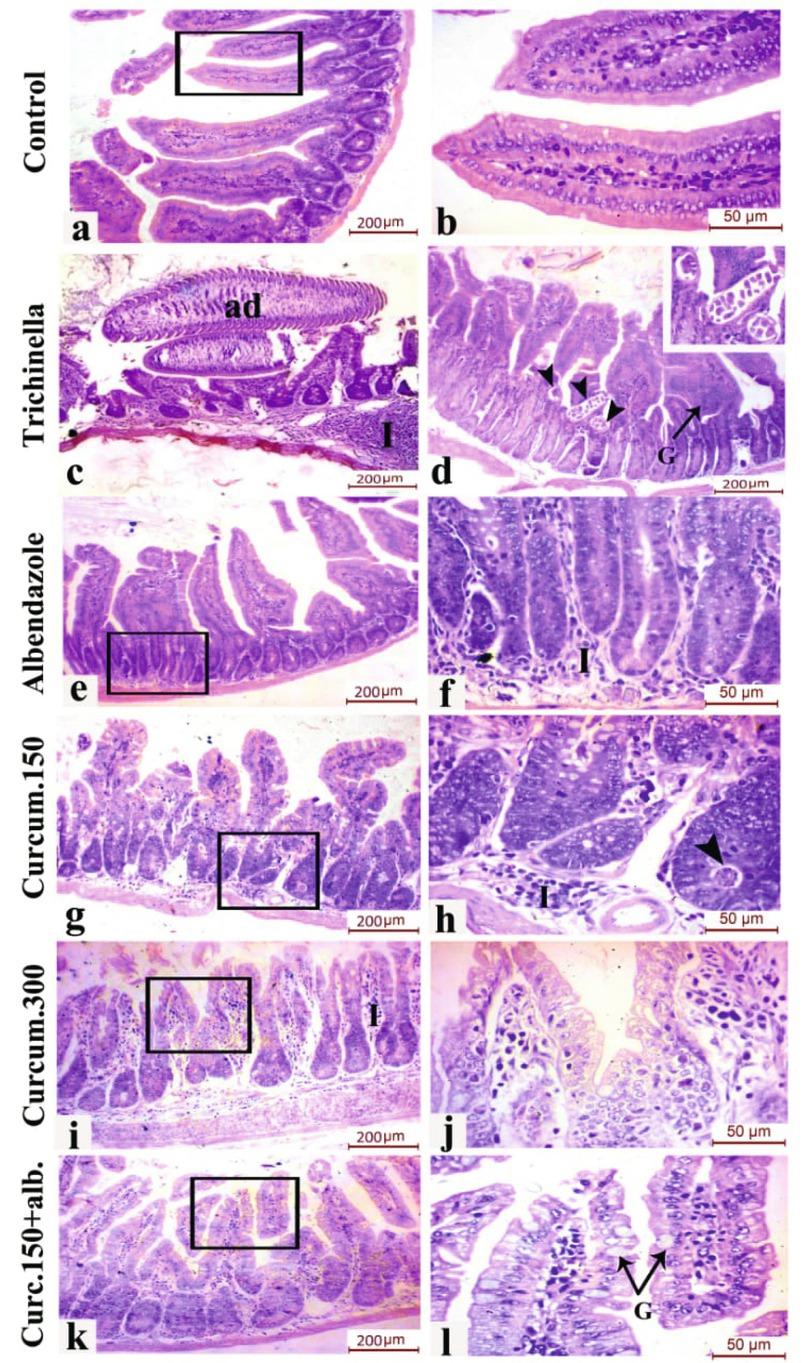
Fig 6
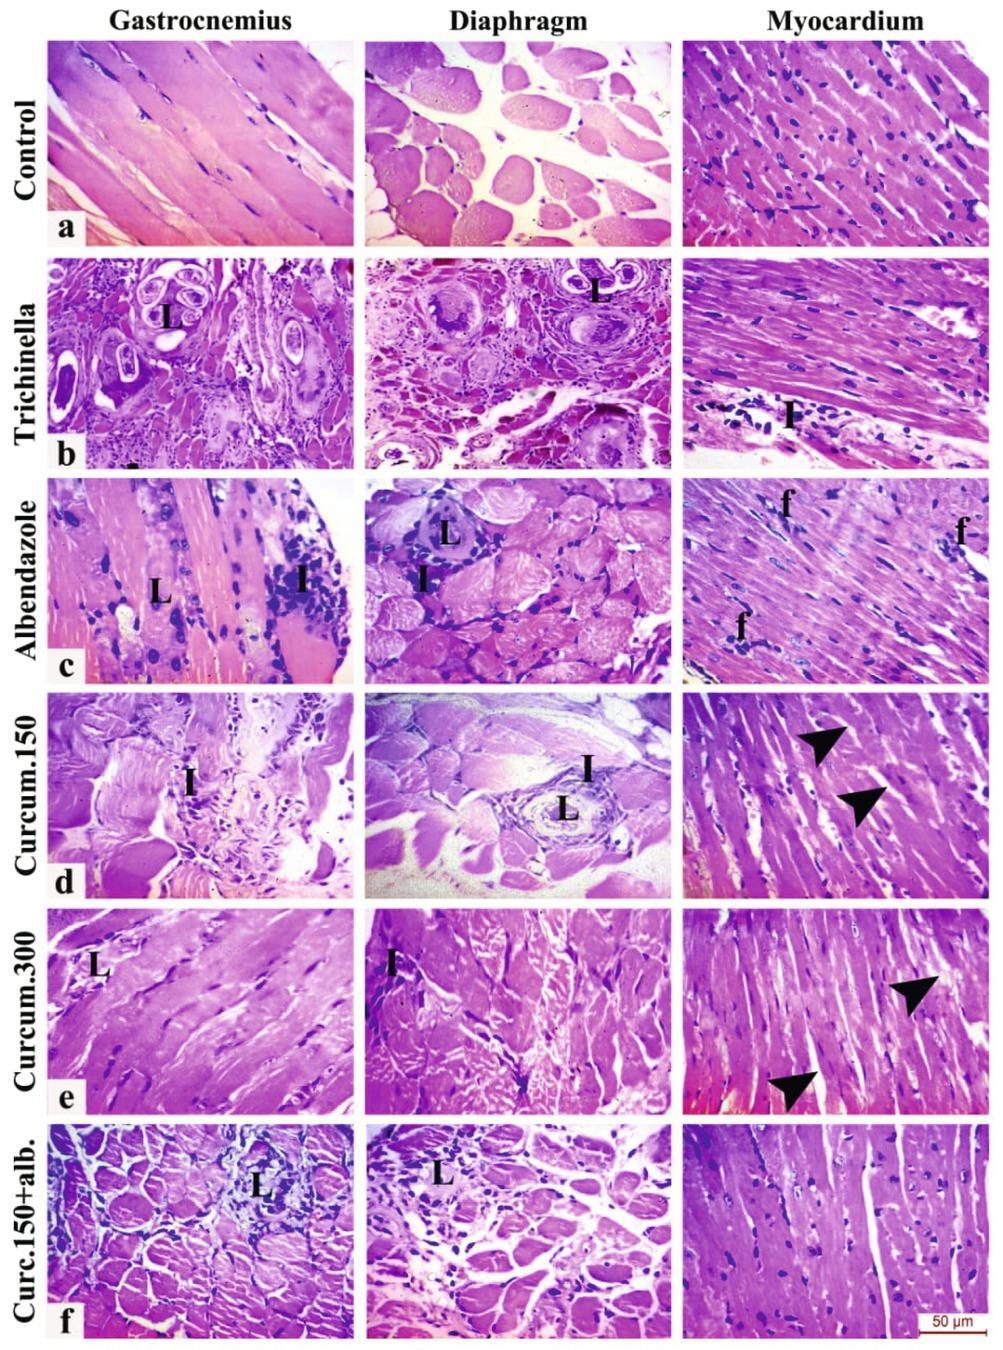
Fig 7
Fig 8
Fig 9
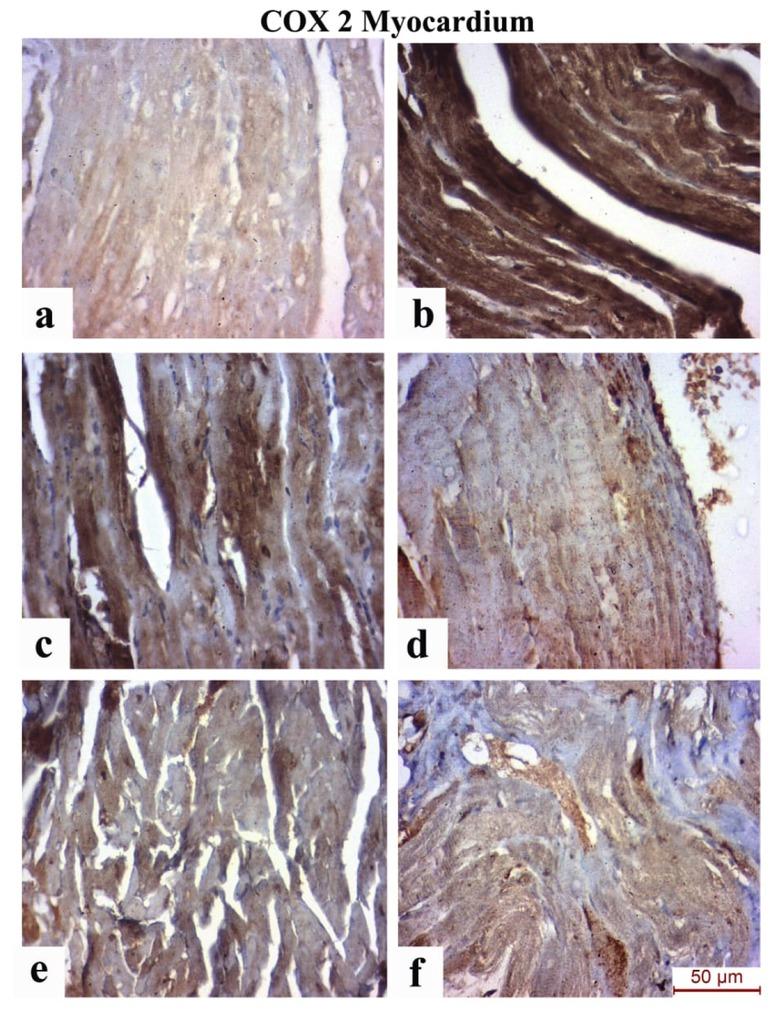
Fig 10
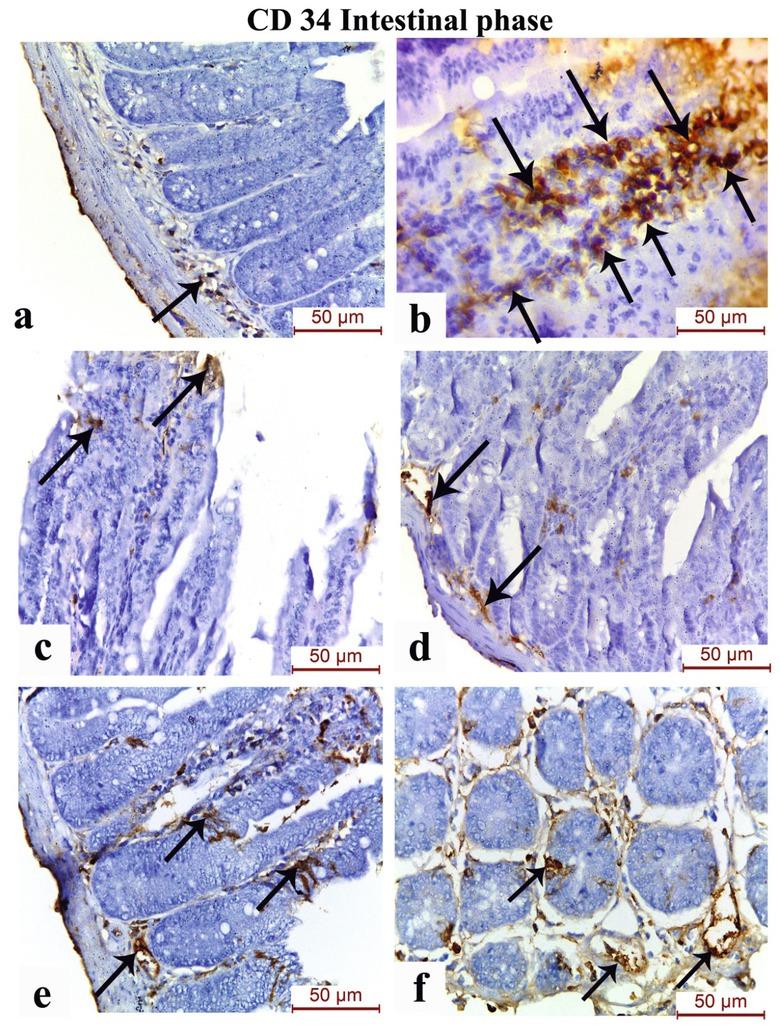
Fig 11

Fig 12
Mean expression levels of inflammatory changes during the muscle phase of infection; (0) signifies no change, (1) mild, (2) moderate changes and (3) severe changes_
| Muscle phase | ||||||
|---|---|---|---|---|---|---|
| Study groups | Fibrosis | Capsular inflammation | Interstitial inflammation | Muscle degeneration | Larval degeneration | |
| Mean | Negative control(NC) | 0.00 | 0.00 | 0.00 | 0.00 | 0.00 |
| Positive control(1) | 3.00 | 3.00 | 3.00 | 1.00 | 0.00 | |
| Curcumin150mg(2) | 2.67 | 2.83 | 2.83 | 0.83 | 0.17 | |
| Curcumin300mg(3) | 0.67 | 0.83 | 0.83 | 0.00 | 0.83 | |
| Albendazole(4) | 2.83 | 2.33 | 2.67 | 0.83 | 1.00 | |
| Alb/Cur150mg(5) | 2.00 | 2.17 | 2.33 | 0.50 | 0.50 | |
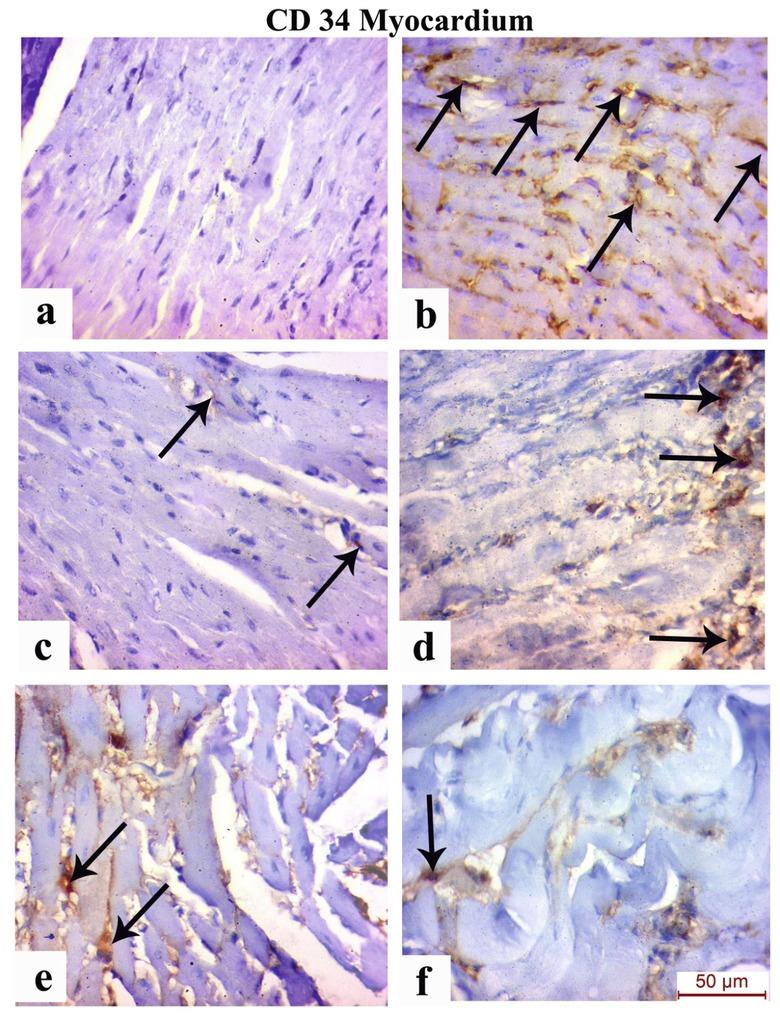
Pearson r correlation test between COX-2 and CD34 expression detected by IHC_
| Tissue sections | Pearson r correlation test between COX-2 and CD34 expression detected by IHC | ||
|---|---|---|---|
| Drug groups | Pearson r value | P value | |
| Intestinal tissue sections | Positive control | NaN | NaN |
| Curcumin 150 mg/kg | -0.250 | 0.633 | |
| Curcumin 300 mg/kg | 0.500 | 0.312 | |
| Albendazole 50 mg/kg | -0.500 | 0.312 | |
| Combined curcumin 150 mg/kg and albendazole | NaN | NaN | |
| Skeletal muscle tissue sections | Positive control | 0.944 | <0.001* |
| Curcumin 150 mg/kg | NaN | NaN | |
| Curcumin 300 mg/kg | NaN | NaN | |
| Albendazole 50 mg/kg | NaN | NaN | |
| Combined curcumin 150 mg/kg and albendazole | -0.500 | 0.312 | |
| Cardiac muscle tissue sections | Positive control | 0.944 | <0.001 |
| Curcumin 150 mg/kg | NaN | NaN | |
| Curcumin 300 mg/kg | NaN | NaN | |
| Albendazole 50 mg/kg | NaN | NaN | |
| Combined curcumin 150 mg/kg and albendazole | -0.500 | 0.312 | |
Means and standard deviations of CD34 expression levels in sections from the small intestine, skeletal muscle and heart of the different study groups_
| CD34expression (Mean ± SD) | |||
|---|---|---|---|
| Tissue samples | Small intestine | Skeletal muscle | Cardiac muscle |
| Study groups | |||
| Negative control group | 0.7±0.5 | 0.0±0.0 | 0.0±0.0 |
| Positive control group | 2.7±0.5 | 2.7±0.4 | 2.7±0.4 |
| Curcumin 150 mg/kg | 1.3±0.5 | 1.7±0.5 | 1.7±0.5 |
| Curcumin 300 mg/kg | 1.7±0.5 | 1.7±0.5 | 1.7±0.5 |
| Albendazole 50 mg/kg | 0.7±0.5 | 1.0±0.0 | 1.0±0.0 |
| Albendazole 50 mg/kg and curcumin 150 mg/kg | 1.0±0.0 | 0.7±0.5 | 0.7±0.5 |
Mean expression levels of inflammatory changes during the intestinal phase of infection; (0) signifies no change, (1) mild, (2) moderate changes and (3) severe changes_
| Intestinal phase | ||||||
|---|---|---|---|---|---|---|
| Study groups | Inflammation | Goblet cells | Apoptosis | Fibrosis | Oedema | |
| Mean | Negative control(NC) | 1.00 | 0.17 | 0.00 | 0.17 | 0.00 |
| Positive control(1) | 3.00 | 1.00 | 1.00 | 2.00 | 1.00 | |
| Curcumin150mg(2) | 2.83 | 1.00 | 0.00 | 1.67 | 1.00 | |
| Curcumin300mg(3) | 0.83 | 0.17 | 0.00 | 0.17 | 0.17 | |
| Albendazole(4) | 1.33 | 0.67 | 0.33 | 1.00 | 0.50 | |
| ALb/Cur150mg(5) | 1.17 | 0.00 | 0.33 | 0.33 | 0.67 | |