
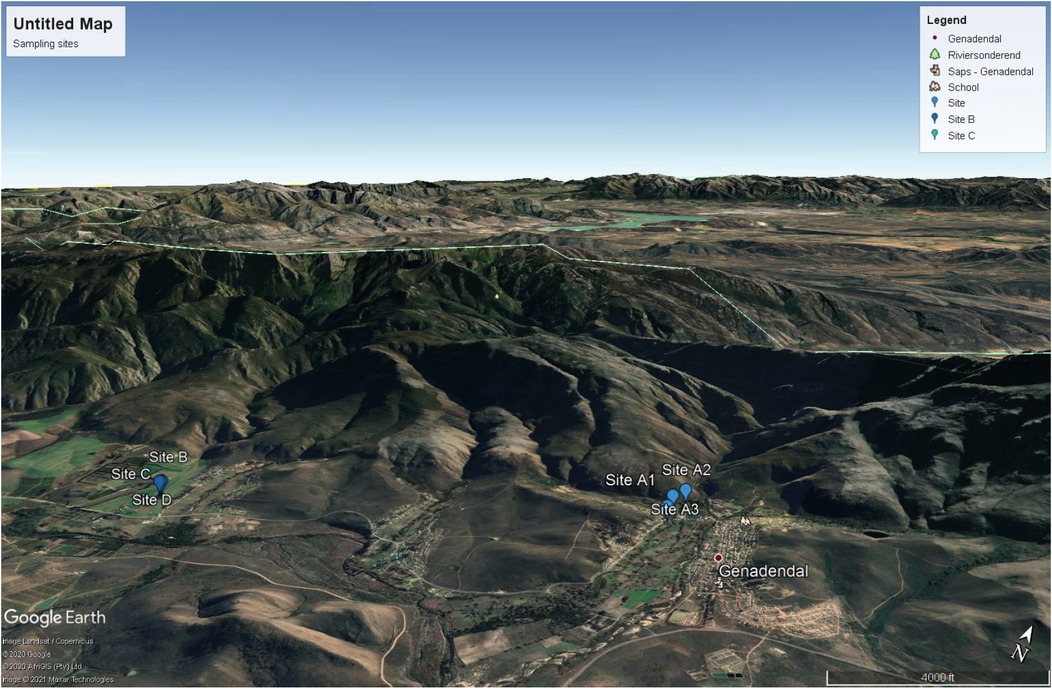
Fig. 1
Google Earth image showing the location of the sampling sites in the Western Cape province of South Africa.
Table 1
Temperature and rainfall distribution around Genadendal, Western Cape province (2016 – 2017).
| Month | Temperature °C (max) | Temperature °C (min) | Rainfall (mm) | Temperature °C (max) | Temperature 0C (min) | Rainfall (mm) |
|---|---|---|---|---|---|---|
| January | 32.37 | 19.34 | 0.26 | 29.89 | 16.29 | 1.4 |
| February | 30.59 | 16.82 | 0.34 | 30.73 | 17.48 | 0.14 |
| March | 26.95 | 16.06 | 1.11 | 30.09 | 15.07 | 0.09 |
| April | 26.08 | 13.63 | 0.89 | 28.79 | 14.34 | 0.92 |
| May | 24.31 | 11.22 | 0.34 | 25.11 | 11.79 | 0.33 |
| June | 20.03 | 8.48 | 2.05 | 20.44 | 7.51 | 0.82 |
| July | 18.68 | 8.2 | 2.72 | 18.96 | 7.09 | 0.4 |
| August | 21.55 | 8.83 | 1.47 | 17.28 | 7.55 | 1.65 |
| September | 21.06 | 9.34 | 0.77 | 20.56 | 8.66 | 0.58 |
| October | 25.74 | 11.23 | 0.25 | 22.1 | 9.37 | 0.79 |
| November | 28.04 | 13.99 | 0.18 | 24.27 | 12.5 | 1.27 |
| December | 31.05 | 16.07 | 0.19 | 26.92 | 14.98 | 0.27 |
Table 2
Primer codes used for identification of Meloidogyne species, sequences and sources.
| Species | Primer | Sequence 5'-3' | Source |
|---|---|---|---|
| M. arenaria | Far | TCGGCGATAGAGGTAAATGAC | M. arenaria-specific SCAR |
| Rar | TCGGCGATAGACACTACAAACT | Zijlstra et al. (2000) | |
| M. javanica | Fjav | GGTGCGCGATTGAACTGAGC | M. javanica-specific SCAR |
| Rjav | CAGGCCCTTCAGTGGAACTATAC | Zijlstra et al. (2000) | |
| M. incognita | MI-F | GTGAGGATTCAGCTCCCCAG | M. incognita-specific SCAR |
| MI-R | ACGAGGAACATACTTCTCCGTCC | Meng et al. (2004) | |
| M. hapla | JMV1 | GGATGGCGTGCTTTCAAC | M. hapla-, M. chitwoodi-and |
| JMV2 | TTTCCCCTTATGATGTTTACCC | M. fallax-specific IGS-SCAR | |
| JMVhapla | AAAAATCCCCTCGAAAAATCCACC | Wishart et al. (2002) |
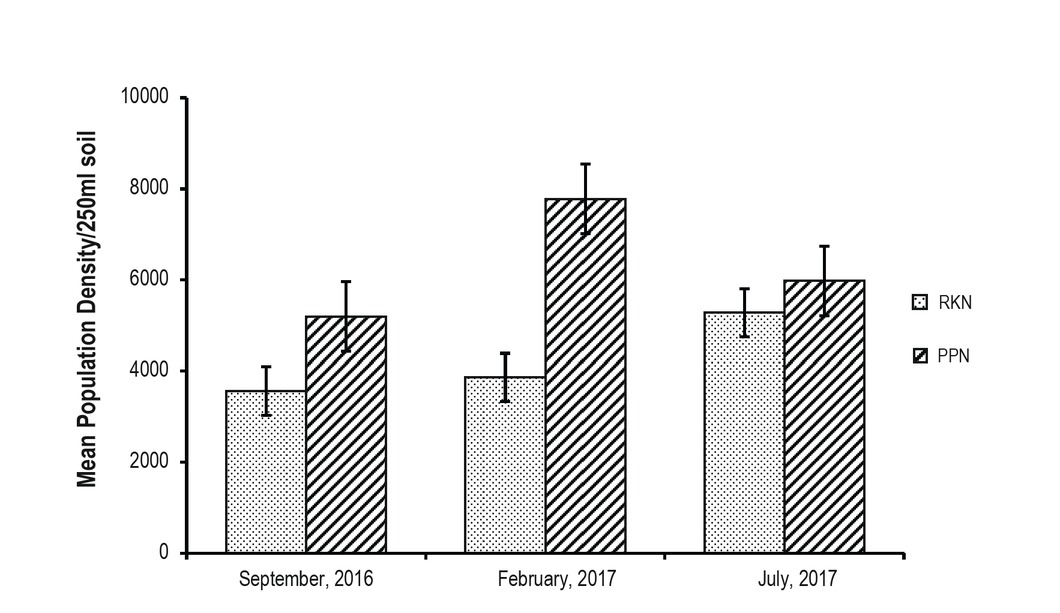
Fig. 2
Mean population density of root-knot nematode (RKN) and other plant-parasitic nematode (PPN) associated with honeybush cultivation on six sites at Genadendal, Western Cape province of South Africa (2016-2017). Error bars represent standard errors (±SE).
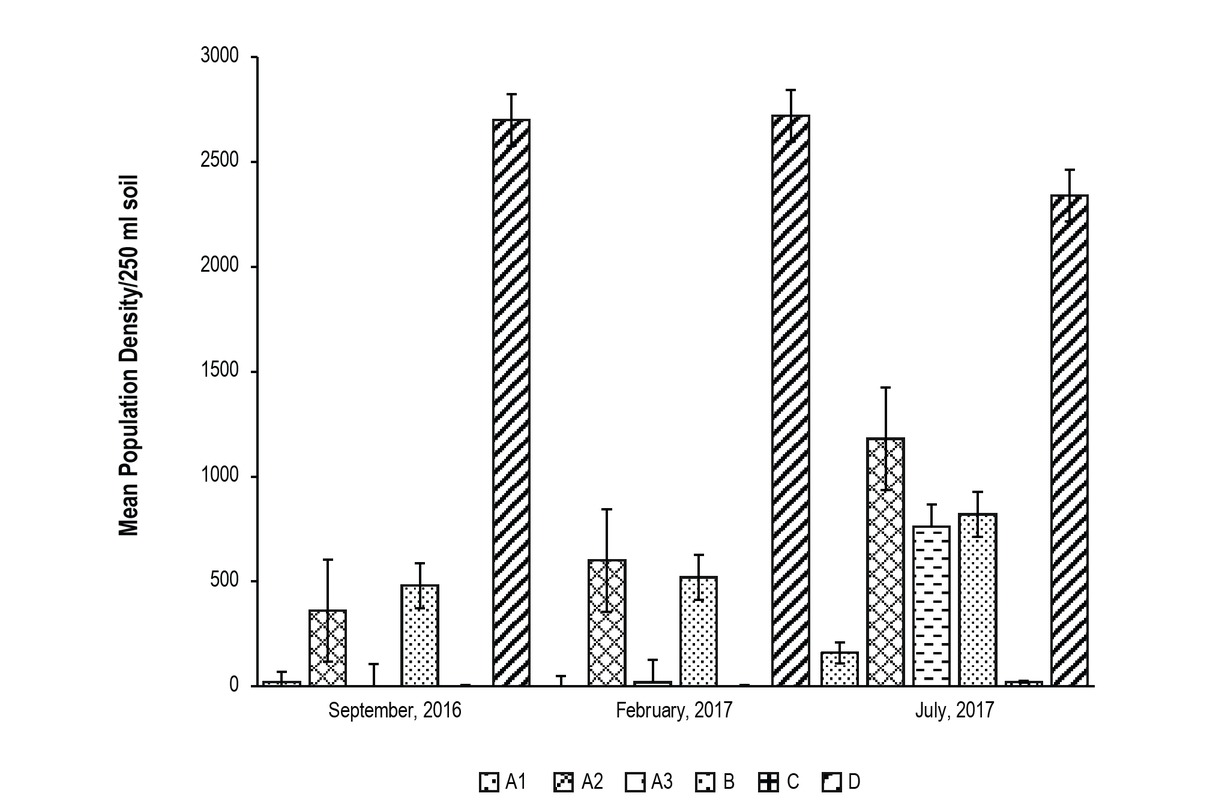
Fig. 3
Mean population density of root-knot nematode (RKN) associated with honeybush cultivation at six sampling sites in Genadendal, Western Cape province of South Africa (2016-2017). Error bars represent standard errors (±SE).
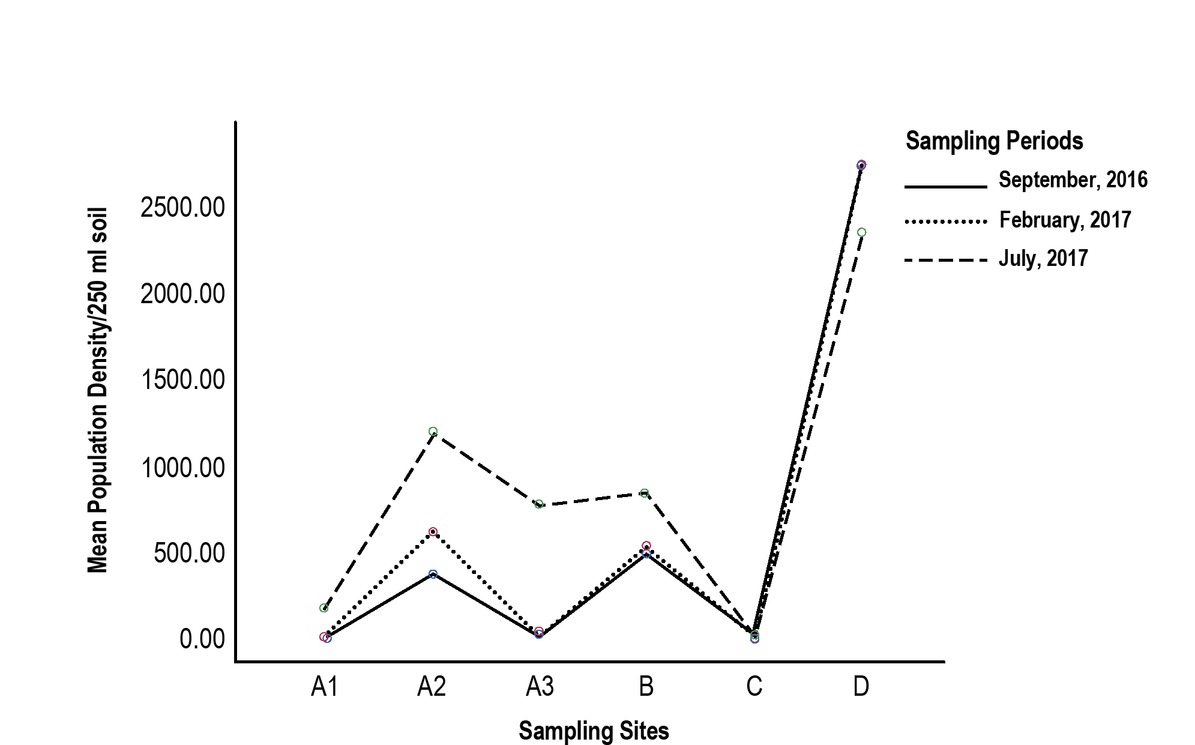
Fig. 4
Seasonal fluctuation and changes in the nematode population during the sampling period of 2016-2017 at the six experimental sites in Genadendal, Western Cape province of South Africa.
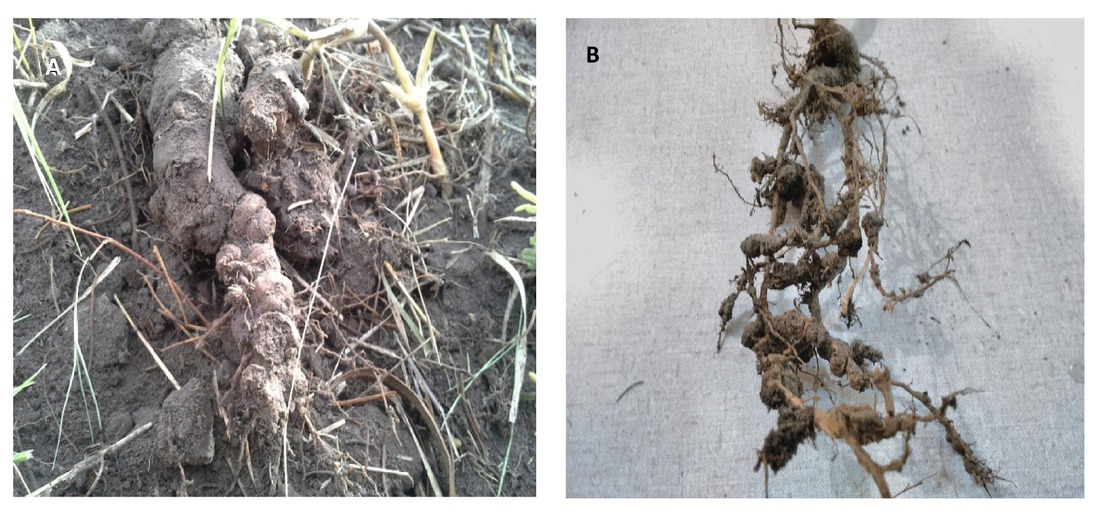
Fig. 5
Symptoms of RKN damage on honeybush roots.
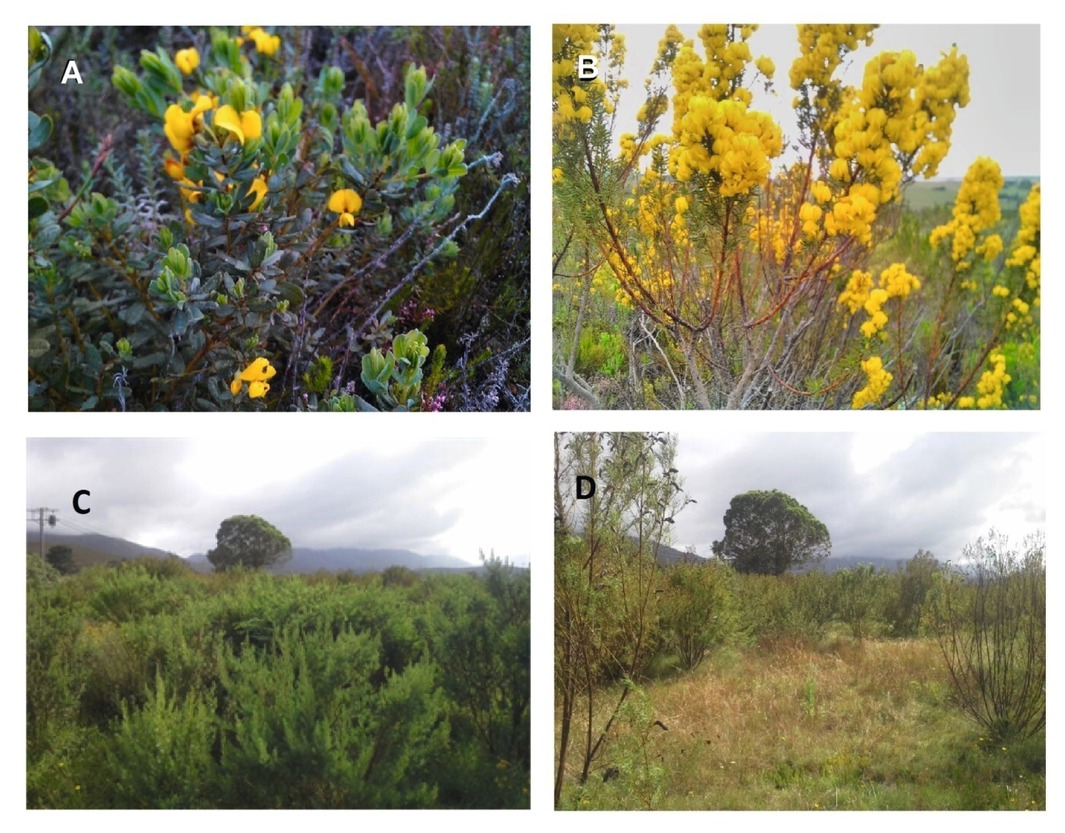
Fig. 6
A-B: Healthy flowering honeybush plants. C-D: Nematode damage on honeybush field, showing loss of plant.
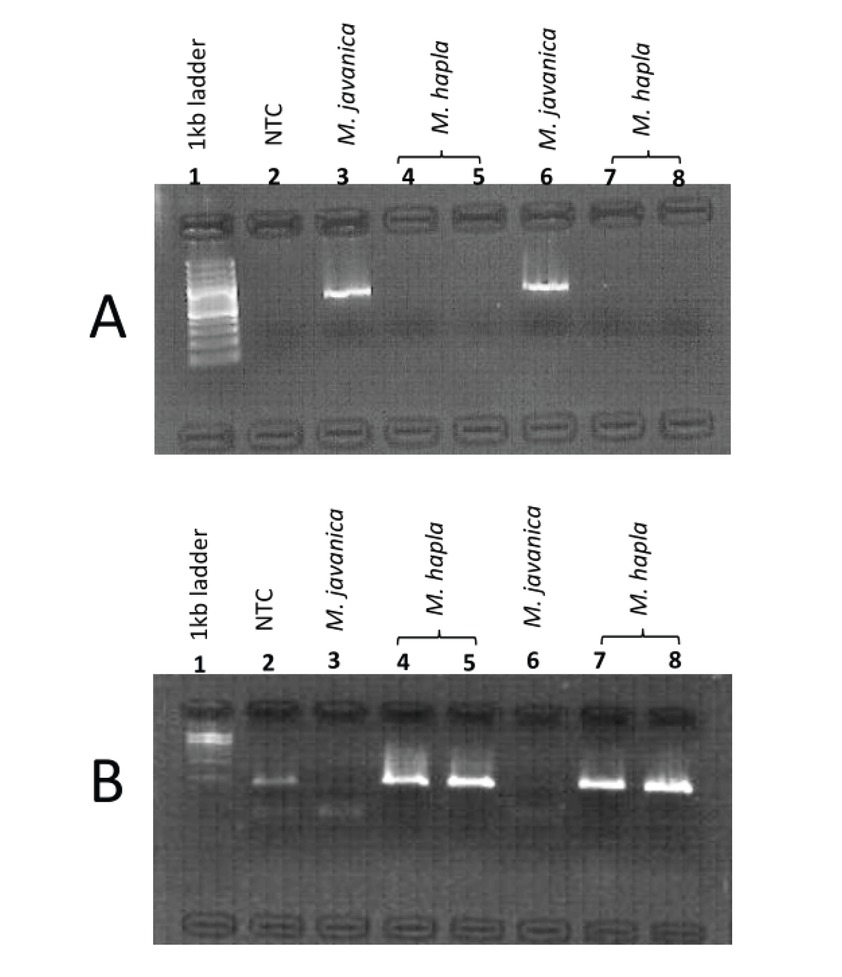
Fig. 7
Gel pictures obtained from the amplification of DNA products of single J2s of RKN from honeybush plots. a. Meloidogyne javanica (amplified with FJav/Rjav primers) and b. M. hapla (with JMV1/JMV2 & JMV primers).