
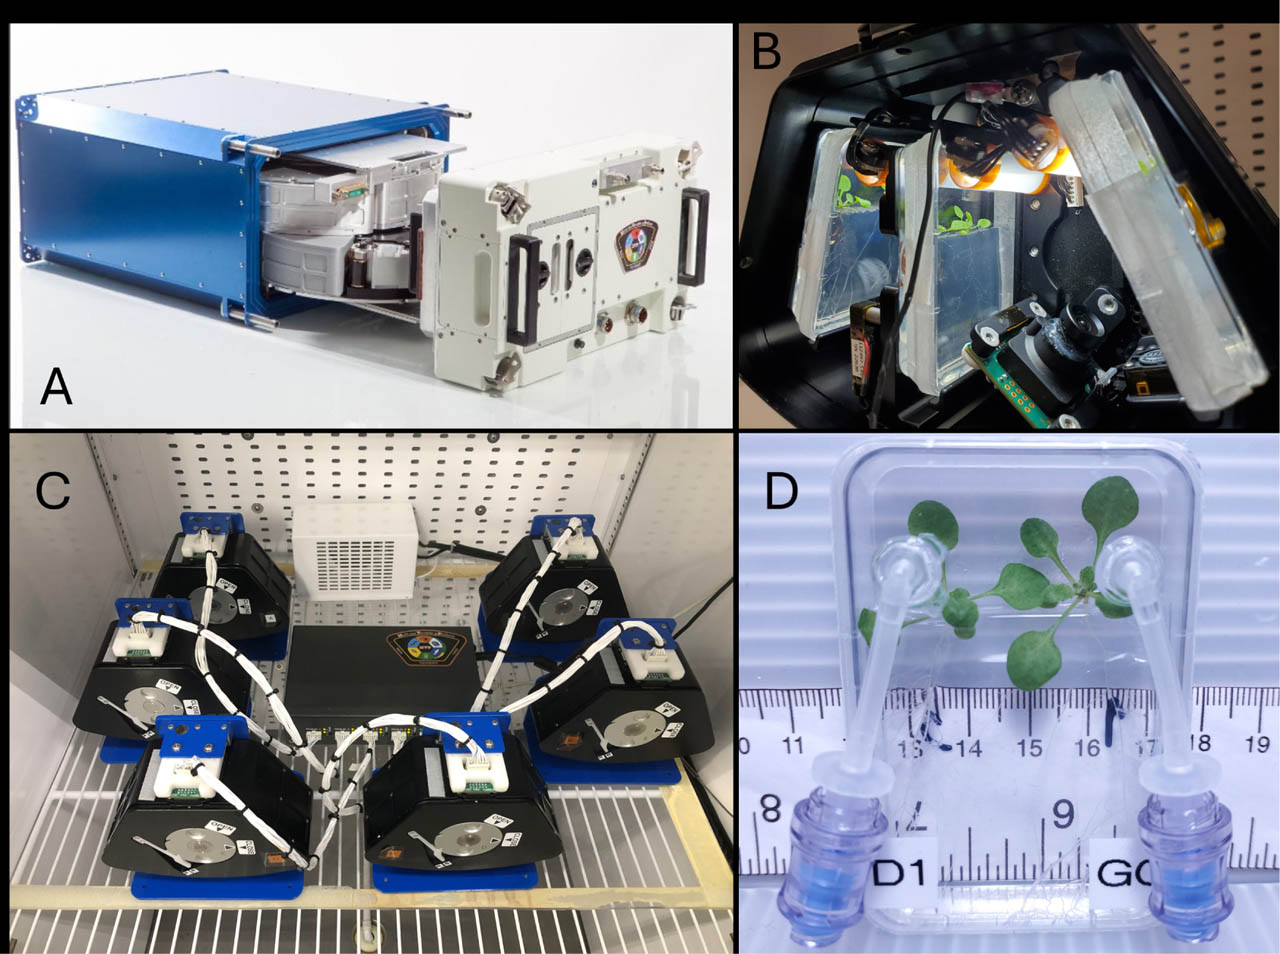
Figure 1.
Flight hardware for the MVP-Plant-02 mission with Golovinomyces cichoracearum (Gc) and Arabidopsis thaliana (At). (A) The Multi-use Variable-g Platform (MVP) has two carousels, each holding six Phytofuge units. (B) One Phytofuge experiment module with the lid removed contains three Petri dishes. (C) A setup of six Phytofuge units was used in the Science Verification Test (SVT). (D) One Phytofuge Petri dish is shown with inoculation modifications on the lid and 14-day-old At canopies.
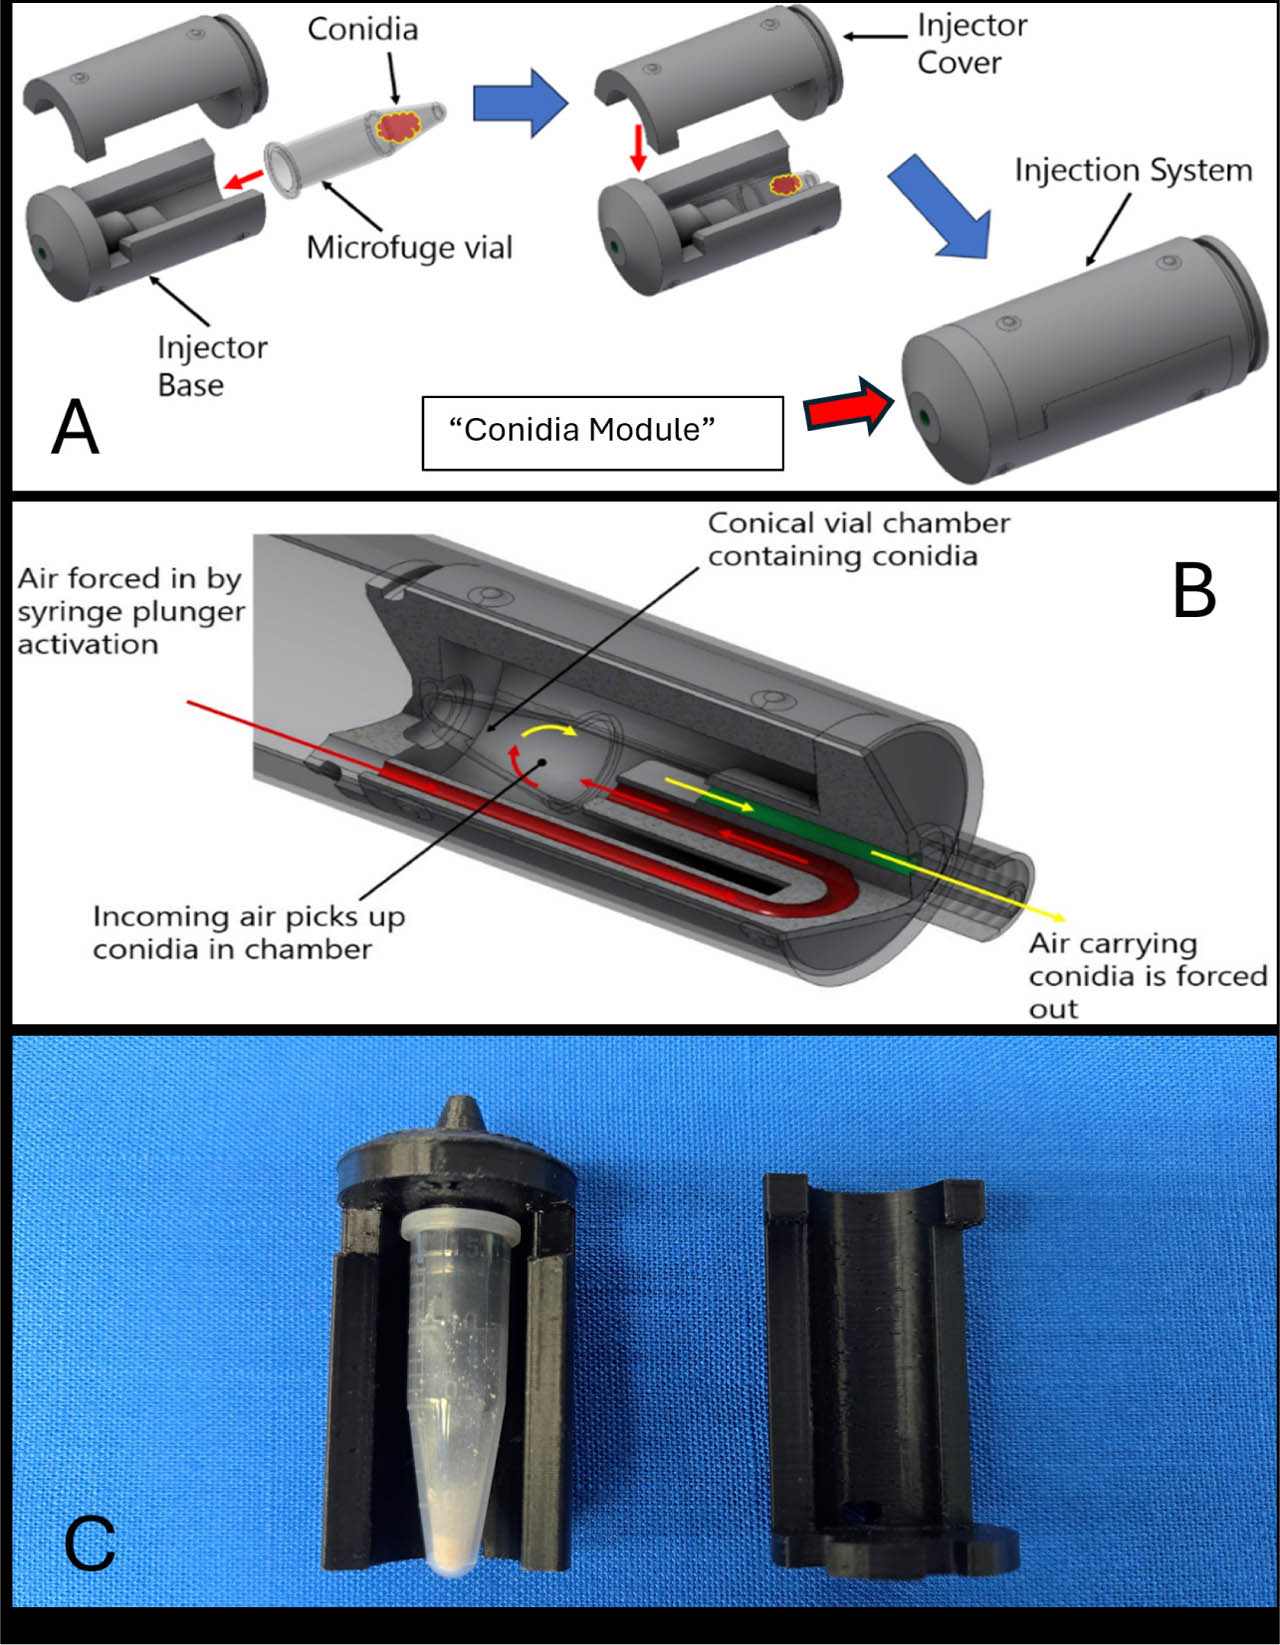
Figure 2.
The internal parts for a CAD unit are shown. (A) The illustration of CAD unit parts includes the Injector Base, which holds the spore-containing microfuge tube, and the Injector Cover, which connects to the Injector Base to form a capsule. The assembled system is called a Conidia Module. (B) The airflow within a CAD unit is shown in red (prior to hitting the spores) and in yellow (after picking up spores in the air stream). (C) A microfuge tube full of conidia is shown in a disassembled Conidia Module.
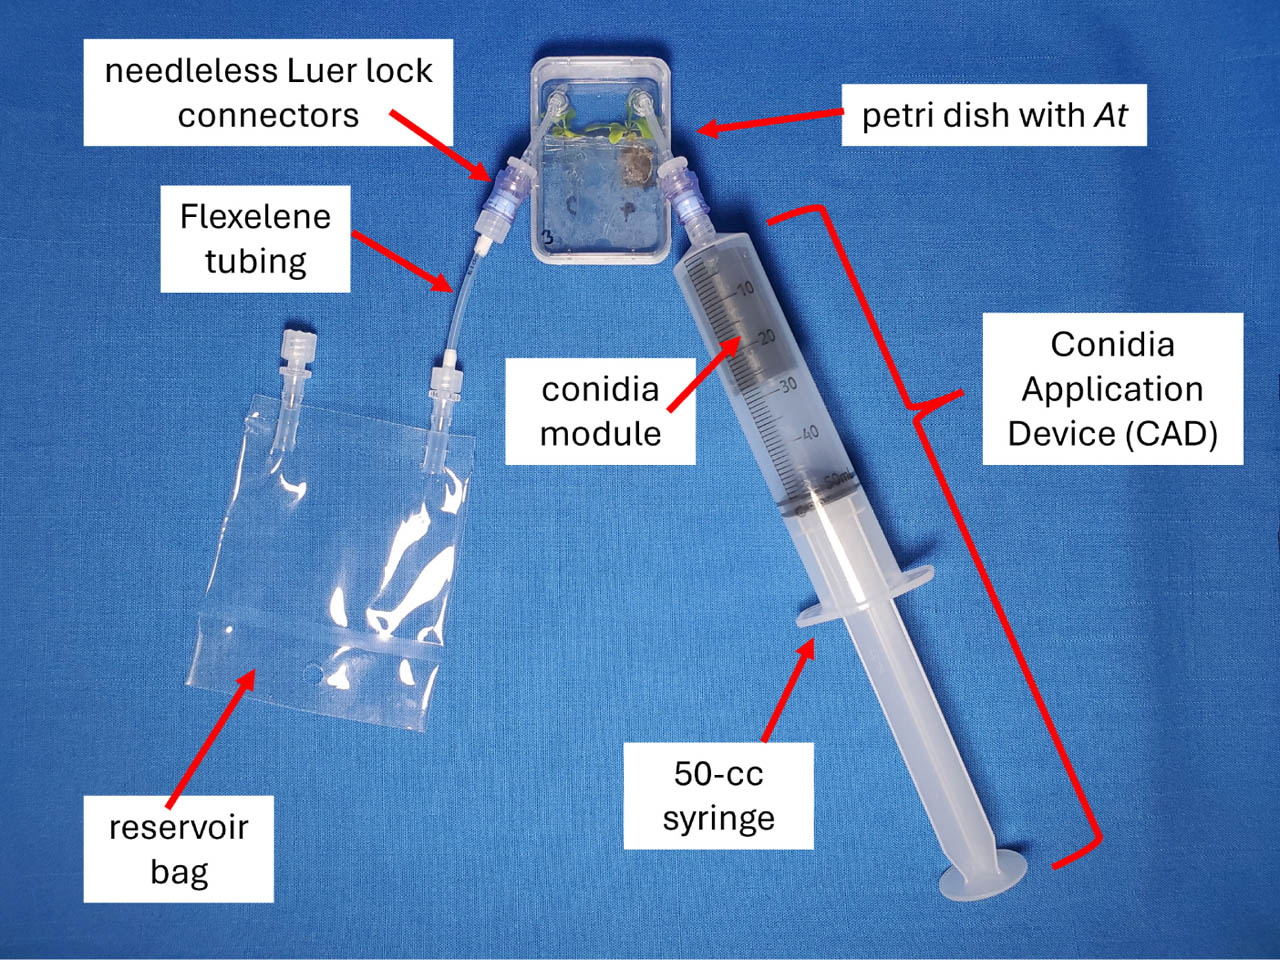
Figure 3.
The complete configuration of the CAD system connected to a mockup of the Petri dish. The 3D-printed conidia module was inserted into a 50-cc syringe and pushed into the syringe opening. The CAD unit and reservoir bag were attached to one Luer lock connector each, allowing for aseptic access to the inoculation ports above the canopies. The syringe plunger was drawn to the 50 mL mark to prepare the CAD for actuation.
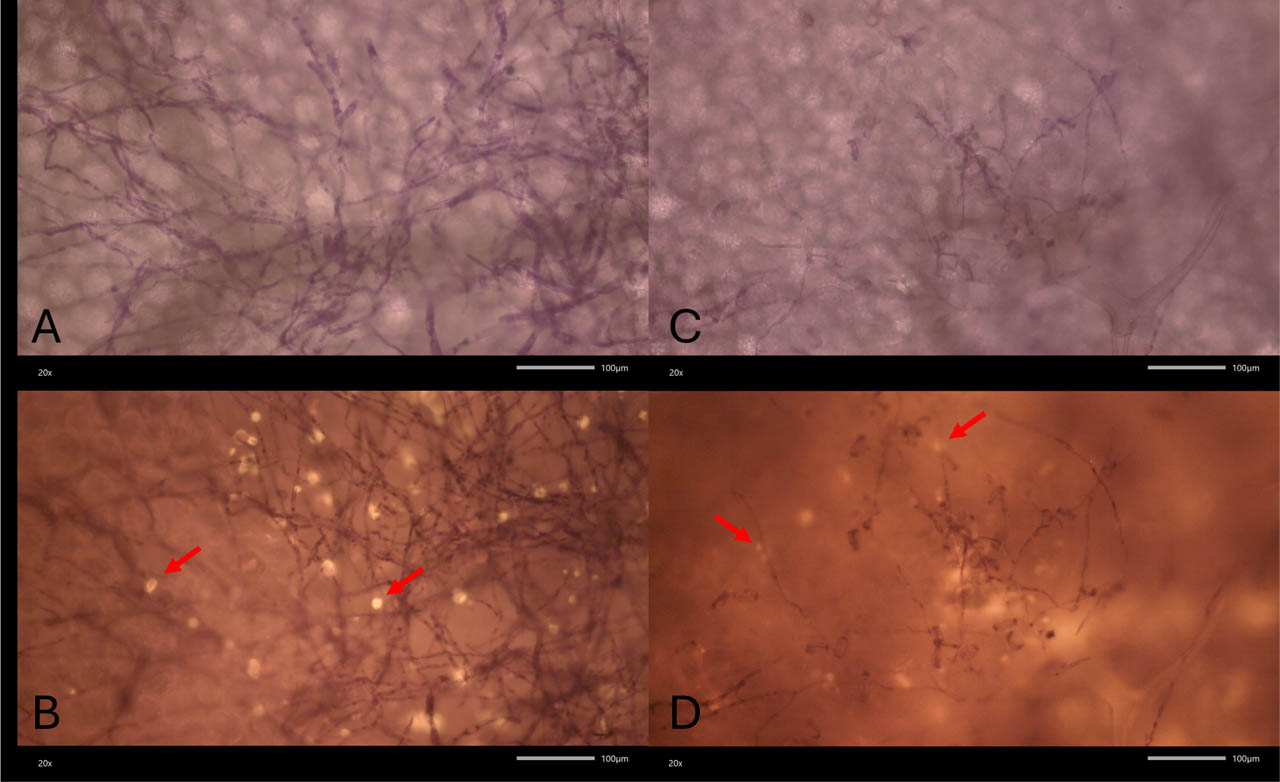
Figure 4.
Successful CAD inoculation of At canopies grown in a flight-like configuration using the optimized inoculation method. (A) Coomassie Brilliant Blue (CBB) mycelial stain of Gc growth on a Col-0 leaf at 20x. (B) Aniline Blue (AB) stain for callose (arrows) in a Col-0 leaf at 20x. (C) CBB stain of Gc mycelia on a powdery mildew resistant gene-4 (pmr4) leaf at 20x. (D) AB callose (arrows) stain on a pmr4 leaf at 20x. Note: the lower abundance of Gc mycelia and fewer callose deposits on the moderately resistant pmr4 leaf are expected.
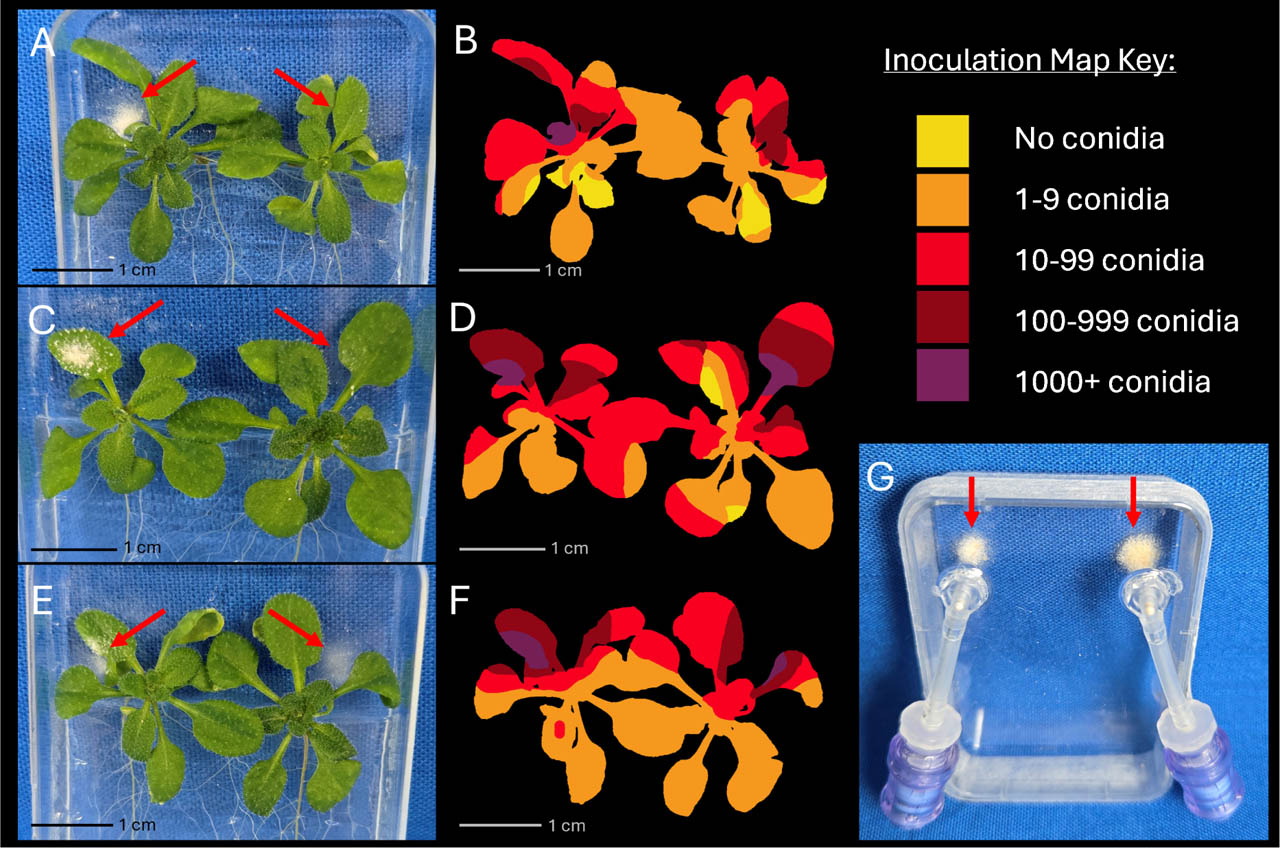
Figure 5.
Quantitative graphic of spore distribution after inoculation with the CAD system in a flight-like configuration. Note: The Inoculation Map Key presents data per field of view (919.49 x 1635.3 μm). There was an average of 19 fields of view per mature Arabidopsis leaf. (A) Image of the Plate 1 inoculation. (B) Plate 1 conidial abundance was mapped for each field of view at 10x magnification across all adaxial canopy surfaces. (C) Image of Plate 2 (analogous to A). (D) Conidial abundance map of Plate 2 (analogous to B). (E) Image of Plate 3 (analogous to A and C). (F) Conidial abundance map of Plate 3 (analogous to B and D). (G) The conidial deposition pattern from a flight-like CAD inoculation without canopies present is displayed (arrows).
Table 1.
Percent viability of conidia stored at 4°C in microfuge tubes vs in the CAD over time. Two tests (CAD Storage Trial-1 and -2) are displayed in which different time points were assayed. The results for the different storage methods of Storage Trial-2 are in separate columns. A dash indicates that no data were taken at that time point for that test.
| Storage Time (days) | CAD Storage Trial-1 | CAD Storage Trial-2 (stored in microfuge) | CAD Storage Trial-2 (stored in CAD) |
|---|---|---|---|
| T=0 | 58.0% | 94.0% | 91.7% |
| T=3 | - | 42.0% | 58.7% |
| T=7 | 39.2% | 79.6% | 0.0% |
| T=10 | - | 45.6% | 0.0% |
| T=14 | 7.1% | 2.4% | 0.0% |
| T=17 | - | 1.7% | 0.0% |
| T=21 | 0.1% | 0.5% | 0.0% |
| T=28 | 0.0% | - | - |
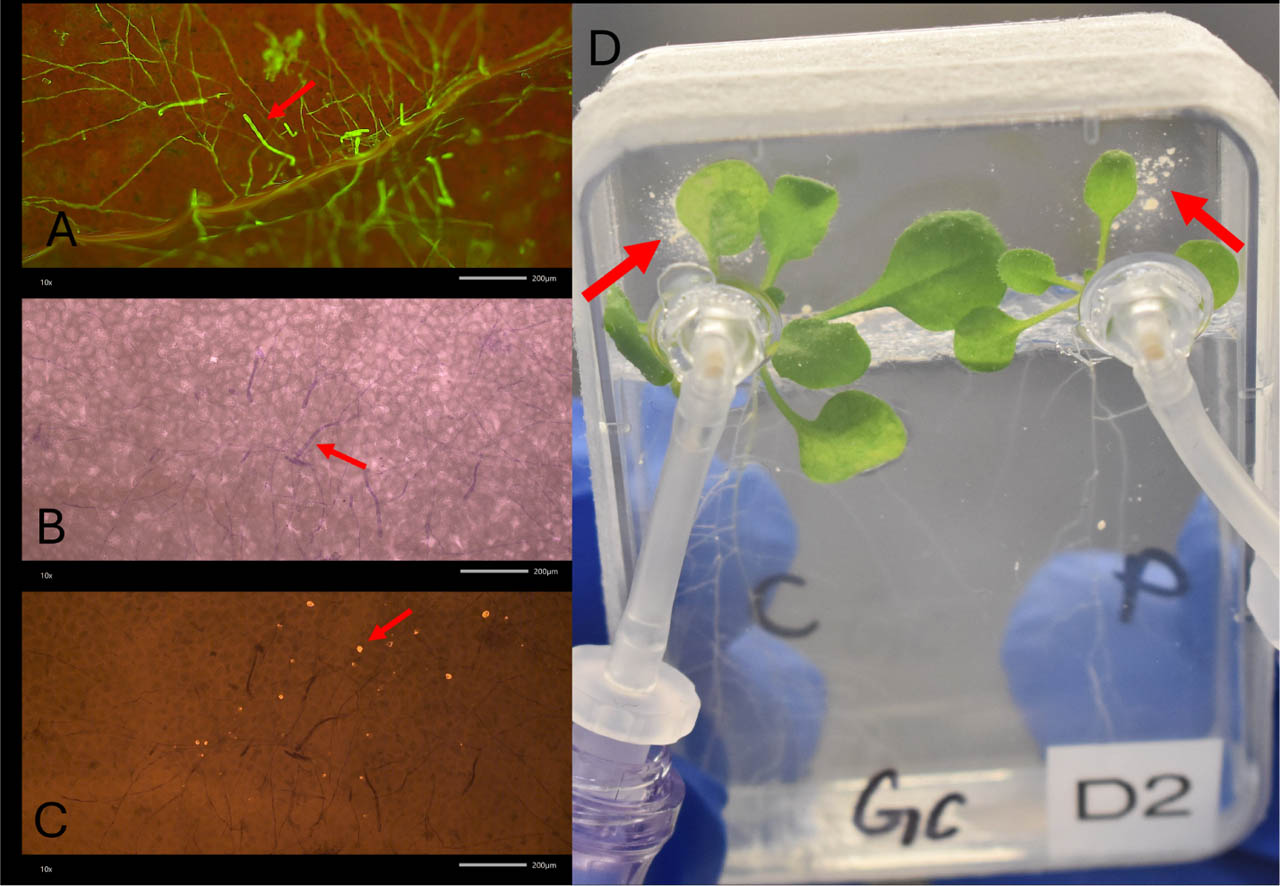
Figure 6.
The SVT injection and fluorescent stain analysis. (A) Canopies were first stained with DCI to view mycelia, conidiophores, and secondary conidia (arrow) at 10x magnification for an initial screening of fungal presence. (B) A more comprehensive analysis was done at 10x magnification with CBB stain (Col-0 canopy shown here) to view mycelia, conidiophores, and secondary conidia (arrow); and with (C) AB stain (matching image pair to B) to show disease development through callose deposits (arrow) along the mycelial network. (D) A nominal inoculation is displayed from the SVT with nearly equivalent amounts of conidia behind both ports (arrows).
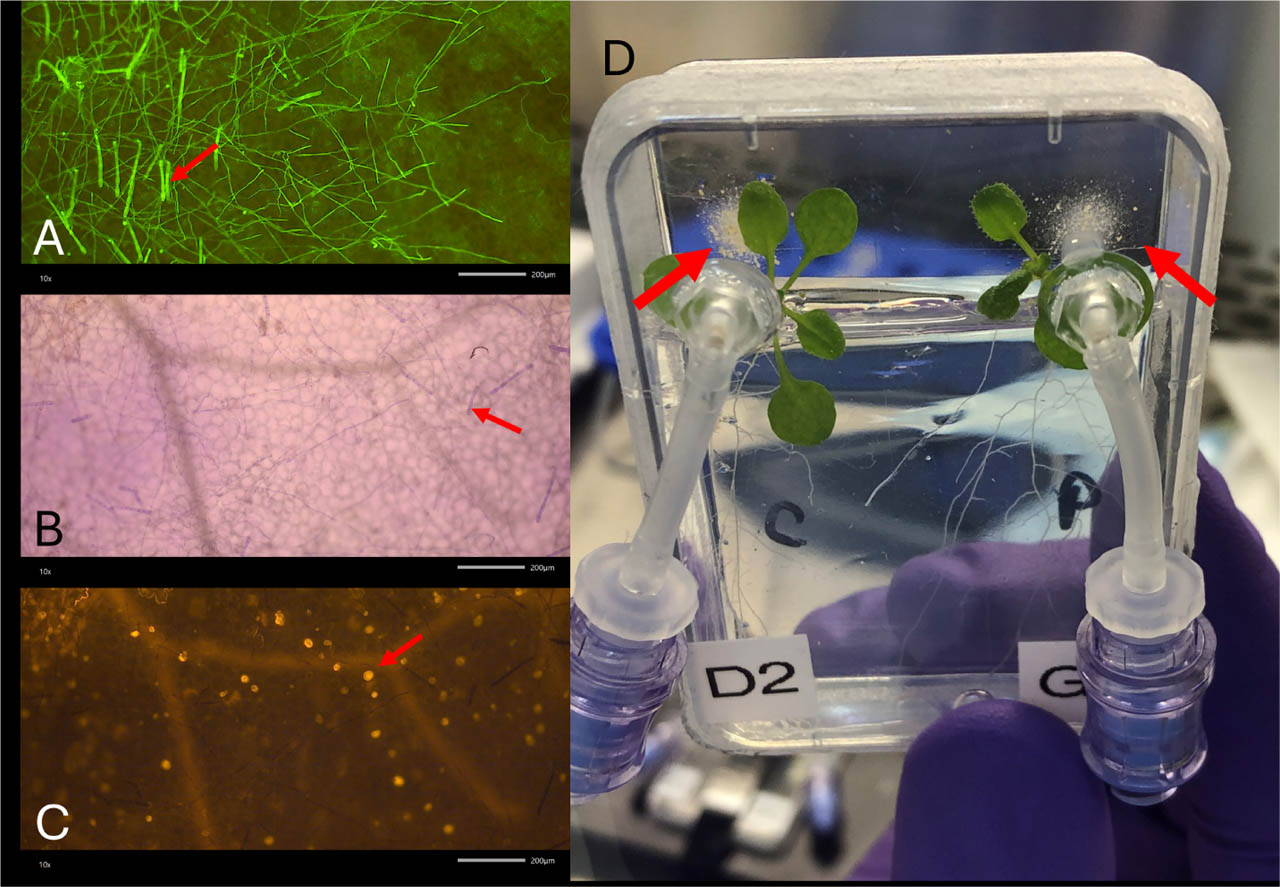
Figure 7.
The EVT injection and fluorescent stain analysis. (A) Canopies were first stained with DCI to view mycelia, conidiophores, and secondary conidia (arrow) at 10x magnification for an initial screening of fungal presence. (B) A more comprehensive analysis was done at 10x magnification with CBB stain (Col-0 canopy; same as A) to view mycelia, conidiophores, and secondary conidia (arrow); and with (C) AB stain (matching image pair to B) to show disease development through callose deposits (arrow) along the mycelial network. (D) A nominal inoculation is observed in the EVT, with nearly equivalent amounts of conidia at both ports (arrows).
Table 2.
Disease development across all canopies inoculated during the SVT and EVT benchmark tests. The value of total leaves includes every leaf on all canopies present during inoculation. All leaves had fungal presence post-CAD inoculation in the form of conidia (both viable and non-viable). Disease presence is defined as the number of leaves containing viable conidia that produced a mycelial network (observed with the mycelial stain, CBB) and penetrated the leaf tissue with an infection peg and haustoria (observed with the callose stain, AB).
| Total At leaves | # At leaves with disease | % At leaves with disease | |
|---|---|---|---|
| SVT Col-0 | 26 | 8 | 30.8 |
| SVT pmr4 | 36 | 8 | 22.2 |
| EVT Col-0 | 37 | 18 | 48.6 |
| EVT pmr4 | 17 | 5 | 29.4 |
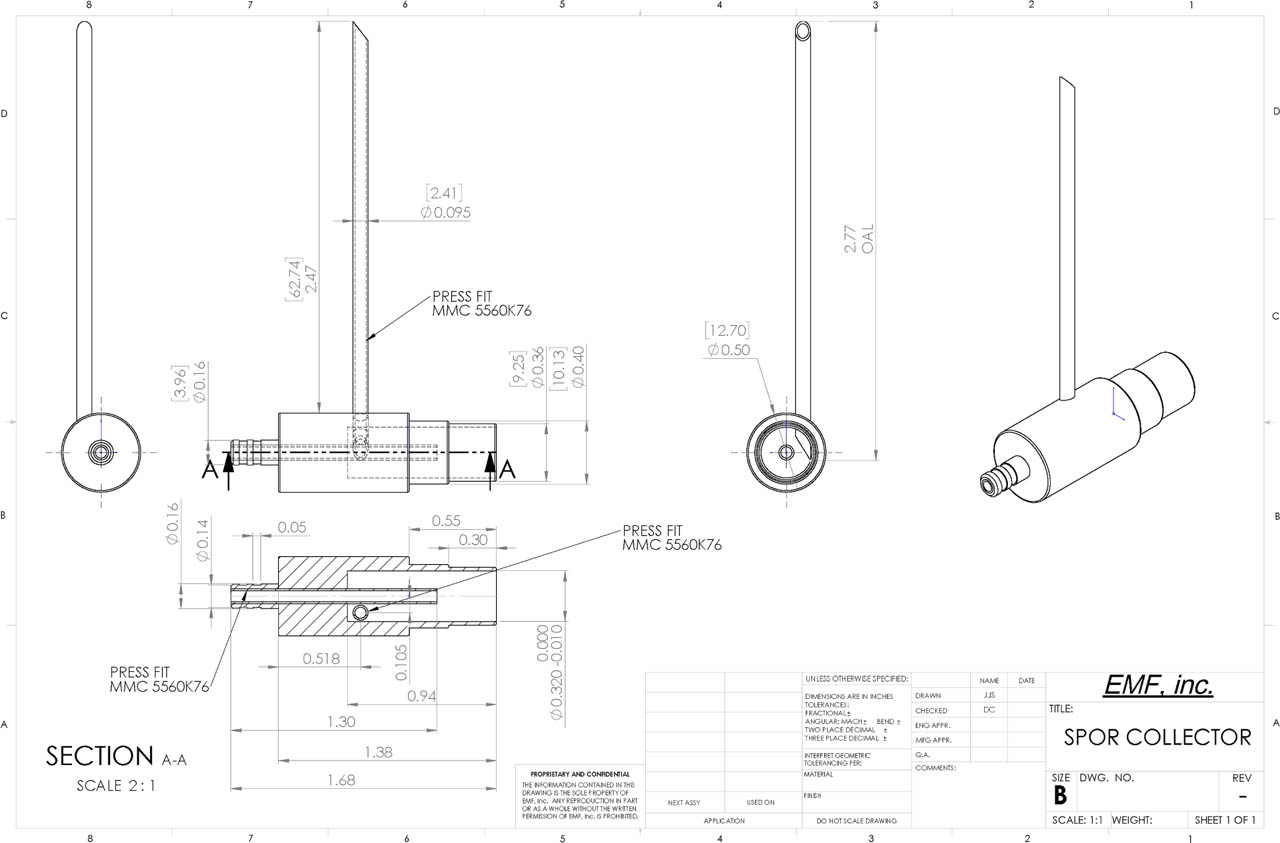
Figure S1.
AutoCAD drawing of the cyclonic spore collector. The collection appendage (arrow) was slightly offset from the center alignment to create a cyclonic vacuum effect on the collected spores. Collected conidia would swirl around the center cavity of the spore collector until eventually settling in the attached microfuge tube. The diagram was used with permission from the Photon Group, LLC. The design package used for generating Figure S1 was SolidWorks version sp3 (Dassault Systèmes, Waltham, MA, USA).
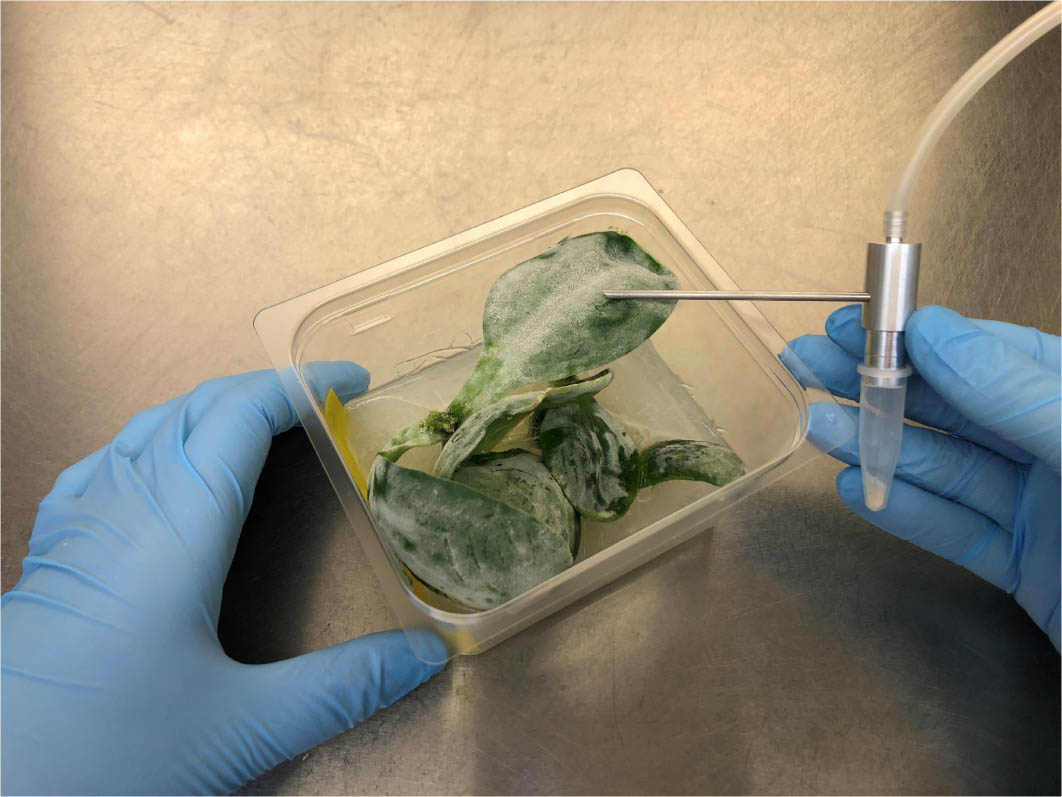
Figure S2.
The cyclone spore collector was used to vacuum conidia from squash cotyledon surfaces into microfuge vials. The tubing on the cyclone spore collector flange was connected to a vacuum pump. The collection appendage was passed over 14-day-old Gc colonies growing on squash cotyledons to gently vacuum spores through the spore collector and into the attached microfuge tube.
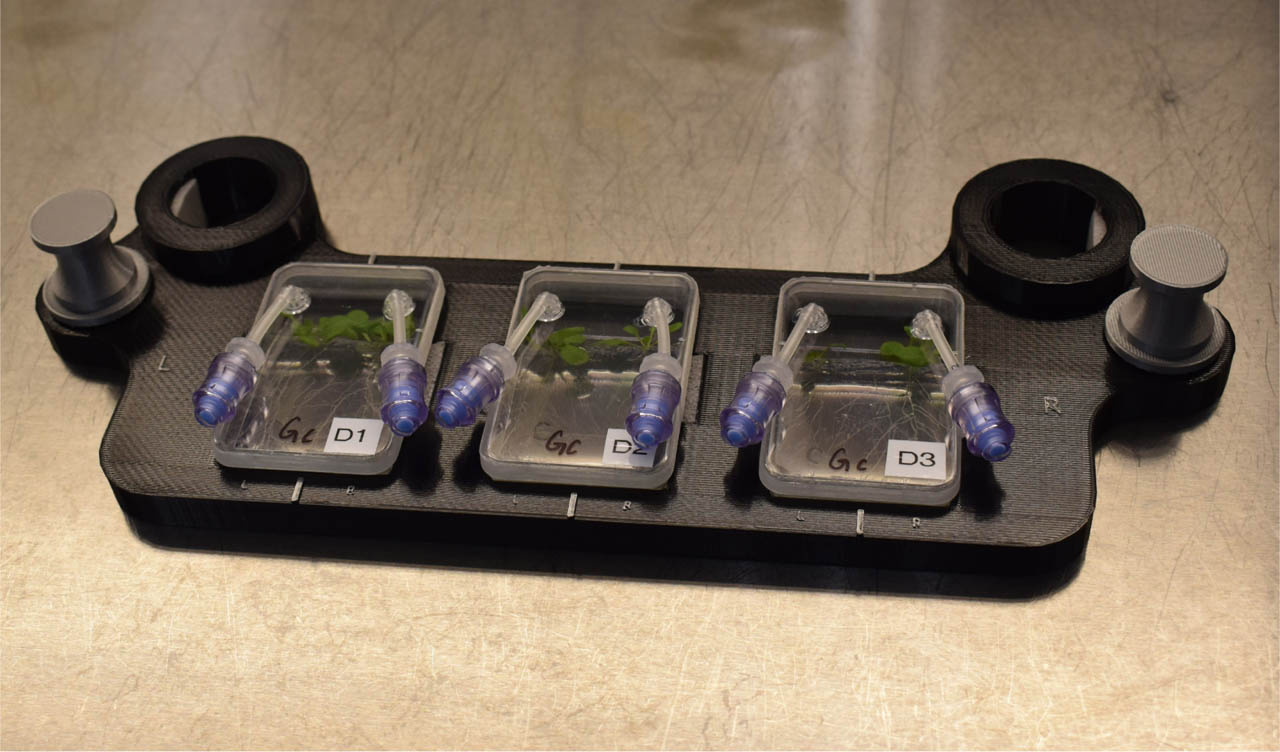
Figure S3.
Three Phytofuge plates were assembled on the Worktop immediately prior to SVT inoculation. The Worktop was designed to prevent severe jostling of the Petri plates during inoculation, especially the 3-pump inoculation into the right port. Additionally, it will function to hold the plates stationary in microgravity. During the EVT, vertical Velcro straps were added to the design to increase security.