
Introduction
As distance and time away from Earth increase, the practicalities of resource resupply missions decrease (MacElroy et al., 1985). Higher-plant production in space initially included closed and semi-closed systems in which aseptic protocols mitigated against microbial contamination of the plants. More recently, some new plant growth hardware, such as Veggie (Massa et al., 2017), utilize open systems in which the International Space Station (ISS) air is freely exchanged with the plant growth environments, increasing the risk of plant pathogen outbreaks (Zabel et al., 2016; Massa et al., 2017; Johnson et al., 2021; Schuerger, 2021a; Schuerger et al., 2022).
Plant growth in ground-based reduced gravity environments (i.e., on clinostats or random positioning machines) and in actual μg experiments suggest that host resistance and stress pathway genes may be down-regulated potentially leading to up-regulation of disease incidence or severity (Leach et al., 2001; Paul et al., 2013; Schuerger et al., 2021b; Totsline et al., 2023). Enhanced microbial metabolism, growth, and virulence have been observed in microgravity (μg) (Wilson et al., 2007; Rosenzweig et al., 2010; Gilbert et al., 2020; Simoes and Antunes, 2021). In addition, microbial metagenomic studies from the ISS have detected possible plant pathogenic fungi (e.g. Aspergillus, Fusarium, and Penicillium) and bacteria (e.g. Burkholderia, Erwinia, and Ralstonia) in human habitats (Lang et al., 2017; Sielaff et al., 2019; Hummerick et al., 2021).
There have been three documented cases of plant disease development in space. In 1995, an experiment to observe the effects of μg on the activity of peroxidases in Triticum aestivum ‘Super Dwarf’ was unable to be completed since approximately 50% of the seedlings were contaminated with a fungus, Neotyphodium sp., later characterized as a seed endophyte that exhibited phytopathogenesis in μg (Bishop et al, 1997). In 1997, an experiment was conducted on Space Shuttle Mission STS-87 using the Phytophthora sojae and Glycine max pathosystem (Ryba-White et al, 2001). Growth pouches were inoculated with mycelia and oospores of P. sojae prior to launch and assessed for disease development post-flight (Ryba-White et al., 2001). Finally, in 2015, Zinnia hybrida plants grown in the Veggie hardware experienced excess-water stress, exacerbated by a circulating fan failure, resulting in stem and root rots caused by the phytopathogen Fusarium oxysporum (Schuerger et al., 2021b). In all three cases, disease appeared to be more severe in microgravity than in Earth-based controls. Despite the three examples given above, there remains a paucity of information on disease development and host defense responses in plant pathosystems in μg.
Based on the literature discussed above, a flight experiment was developed to test the alternative hypothesis (Ha) that microgravity can down-regulate host resistance, and thus, may up-regulate plant disease development in space. As of this writing, the ISS flight experiment is scheduled for a late-2026 flight and will evaluate disease development, host transcriptomic changes, and ultrastructural alterations in the pathosystem Golovinomyces cichoracearum (DC.) V.P. Heluta (Gc) (a powdery mildew) and Arabidopsis thaliana (L.) Heynh. (At) (a mustard plant).
One key aspect of the Gc/At flight experiment will be to inoculate 14-day-old At plants actively growing in flight hardware (see below) under μg and 1g conditions. However, no spore application device was available for use on the ISS. This study aimed to develop a spore-application device that was compatible with flight hardware and ISS operational constraints, was safe for the crew to use, did not interfere with other plant biology experiments, and could apply Gc conidia in μg.
The Gc/At pathosystem was selected for the flight experiment for five reasons: (i) crew safety, (ii) narrow host range, (iii) short-lived spores, (iv) visibility on infected host tissues, and (v) ease of post-experiment analyses. Powdery mildews are obligate biotrophic plant pathogens. Thus, disease development is restricted to plants, often with very narrow host ranges (Glawe, 2008). Additionally, the conidia (i.e., asexual spores of Gc) are extremely fragile on surfaces or in open air and die within a few days when not on host plant tissues (Glawe, 2008). The short life spans of conidia ensure no interference with other plant growth experiments on the ISS.
Powdery mildews develop mycelial networks on both adaxial (upper) and abaxial (lower) leaf surfaces. The fungus interacts with host tissues by producing nutrient-absorbing structures called haustoria within epidermal cells. As a result, the infected At leaves often form callose, a polysaccharide deposited at the haustorium-plant cell membrane interface to constrain nutrient transfer (Micali et al., 2008; Micali et al., 2011; Kuhn et al., 2016). The functionality of the CAD was assessed through detecting the presence of fungal structures and host symptoms via fluorescent staining of mycelia and callose. The primary goal of this paper was to describe the development and preliminary testing of the CAD system - a simple conidial application system designed for use within a μg environment and the delivery of viable Gc conidia to At canopies for the ISS flight experiment.
Materials and Methods
Gc/At flight experiment summary
The Gc/At flight experiment will be conducted in a Multi-Use Variable-g Platform (MVP) facility designed, built, and operated by Redwire Space Technologies, Inc. (Georgetown, Indiana, USA) (Figure 1A). A single MVP facility contains two centrifugal carousels that can be operated independently at fractional levels of gravity from μg (i.e., stationary and non-rotating) to 2g (Figure 1A; Reed and Vanden Bosch, 2023). Each carousel has a capacity for six Phytofuge experiment modules, allowing for 12 modules per MVP facility (Figure 1B and 1C). Each Phytofuge module will be loaded with three custom-built Petri dishes, each containing two seeds, one for each At genotype (Figure 1D; described below).
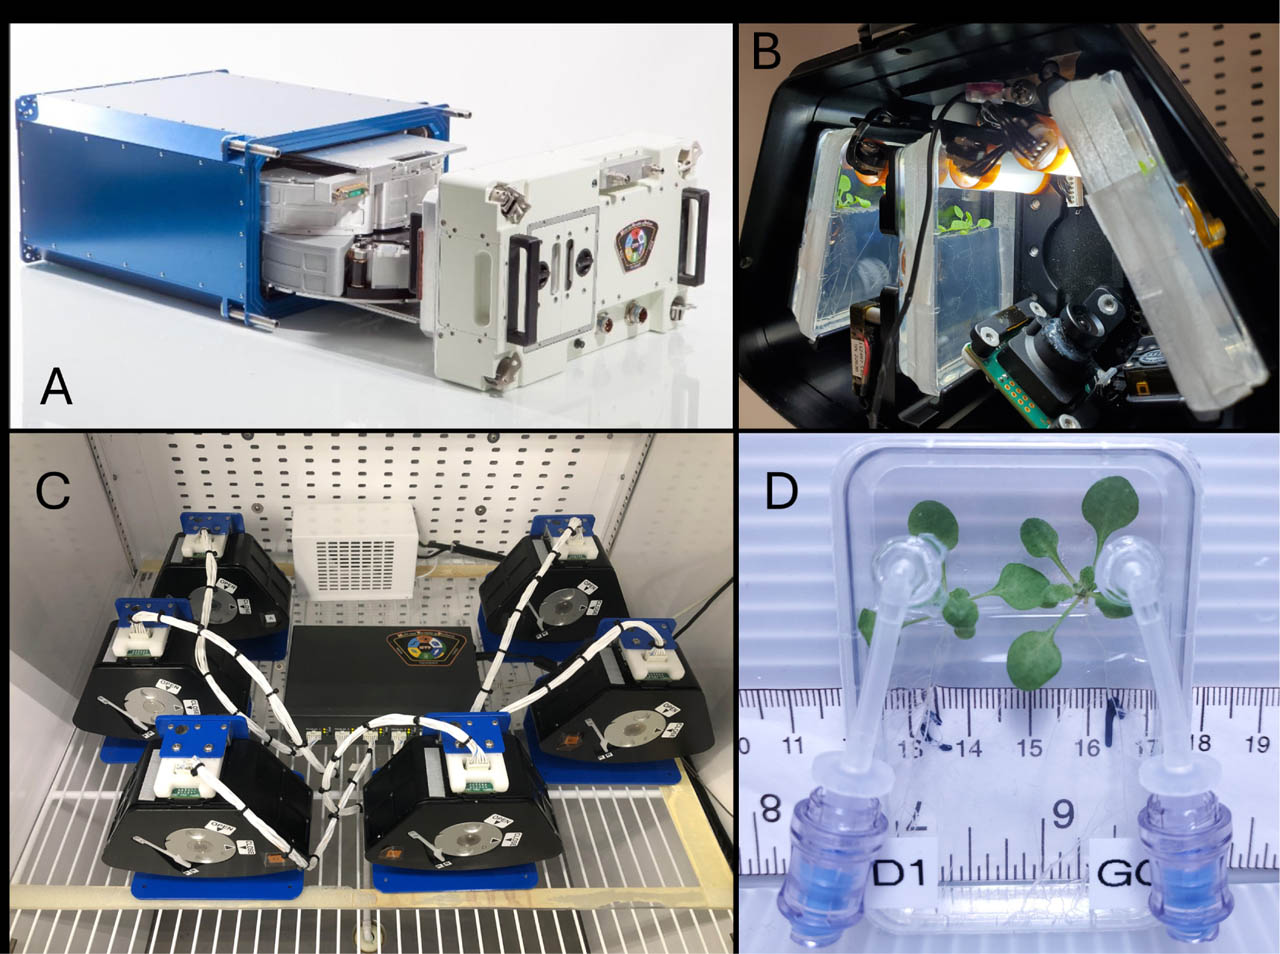
Figure 1.
Flight hardware for the MVP-Plant-02 mission with Golovinomyces cichoracearum (Gc) and Arabidopsis thaliana (At). (A) The Multi-use Variable-g Platform (MVP) has two carousels, each holding six Phytofuge units. (B) One Phytofuge experiment module with the lid removed contains three Petri dishes. (C) A setup of six Phytofuge units was used in the Science Verification Test (SVT). (D) One Phytofuge Petri dish is shown with inoculation modifications on the lid and 14-day-old At canopies.
The Gc/At flight experiment will use the At lines Columbia-0 (Col-0; wild-type and susceptible genotype) and powdery mildew resistance gene 4 (pmr4; moderately resistant line). Seeds of At will be propagated into specially designed Petri dishes (one seed per genotype per dish), wrapped in Duvytene blackout cloth (part no. FBO, Seattle Fabrics, Seattle, WA, USA) and held at 4°C to inhibit germination until inserted into the MVP flight hardware on the ISS, grown for 14 days on Murashige and Skoog medium (Sng et al., 2014) with Gelzan (cat. no. G1910, Sigma Aldrich, Inc., Milwaukee, USA), inoculated with Gc conidia, incubated for an additional 14 days, and harvested. Tissues will be fixed in RNAlater or glutaraldehyde for transcriptomics or fungal ultrastructure analyses, respectively. The CAD units will be used during the inoculation step to eject Gc conidia onto one-half of the At canopies.
Horticultural operations for CAD ground tests
Seeds of Cucurbita pepo L. cv. ‘Goldy’ F1 zucchini squash (West Coast Seed, Delta, British Columbia, Canada) were surface sterilized by soaking in deionized water for 15 min to soften outer seed coats. Sterile fine curved forceps were used to remove the seed coats. The embryo and endosperm tissues were soaked for 15 min in an aqueous 2.5% bleach solution with two drops of Tween-20 (CAS no. 9005-64-5, Fisher Scientific, Pittsburgh, PA, USA), then rinsed in sterile deionized water. Four seeds were planted per Phytatray (cat. no. P5929, Sigma-Aldrich, Inc.) in 100 mL of a Hydroponic Solution Agar containing a full-strength Hoagland solution (Schuerger and Mitchel, 1992), modified with 15 g of Difco Bacto Agar (Fisher Scientific). The squash seedlings were grown for 14 days. The Phytatrays were vented on day 10 by cutting 5 x 4 cm holes in the lids and covering the holes with sterilized 3M micropore tape (cat. no. 1530-3, Honest Medical, Oceanside, CA, USA). Squash true leaves were trimmed biweekly to only allow cotyledons to develop. Plants were watered twice weekly with modified Hoagland solution. On day 14, cotyledons were brush-inoculated with Gc conidia from 14-day-old colonies. Disease developed for 14 days, at which time conidia were used to inoculate a new squash population or harvested to inoculate At leaves in an experiment.
At seeds were sterilized 48 h prior to use by submerging them in 70% ethanol (EtOH) for 5 min, followed by submersion in a 50% aqueous bleach solution amended with Tween-20 for 10 min. The seeds were then rinsed with sterile deionized water. For growth in Phytofuge modules, Petri dishes were wrapped with 0.5-inch micropore tape, and At was grown for 14 (+/−1) days before inoculation with Gc conidia.
For the experiments described below, three custom-made Petri dishes were inserted into each Phytofuge module (Figure 1B). Petri plates were prepared by pouring 0.5x Murashige and Skoog medium (Sng et al., 2014) with Gelzan to fill the entire dish. Once the media was cured, the top 25% of the agar was excavated (Figure 1D) with a sterile spatula to create a void space for the At canopies. Arabidopsis thaliana seeds were planted on the excavated agar surfaces with Col-0 seeded on the left sides and pmr4 seeded on the right sides of all dishes.
Cyclone spore collector
Conidia were required to be contained in 1.5 mL microfuge tubes for the Gc/At flight experiment. However, the spores could not be gently scraped off squash cotyledons and deposited into the microfuge tubes. Thus, a cyclone spore collector (Figure S1) was designed and built based on studies by Evan et al. (1996) and Chen et al. (2004). In brief, the device was designed and manufactured from aluminum 6061 by the Photon Group, LLC (Merritt Island, FL, USA). The collection tube appendage (Figures S1 and S2) was offset from the centerline of the main collector body. The offset created a spiraling airstream with a dead spot of stationary air at the bottom of the connected microfuge tube (Figure S2). The target for the CAD experiments below was to collect between 0.05 and 0.1 cc of Gc conidia per microfuge tube. Throughout all tests, conidial amount was estimated based on the volume markings on the 1.5 mL microfuge vials. Based on preliminary work (data not shown), 0.1 cc of Gc conidia contained approximately 1.8 x 10⁶ spores.
Conidia application device
Figure 2 depicts the sub-units within the CAD system responsible for distributing Gc conidia. First, the CAD system was designed around the shape, size, and internal dimensions of a 1.5 mL microfuge tube (cat. no. 1615-5500, USA Scientific Inc., Ocala, FL, USA) (Figure 2A). The CAD sub-units were designed using Autodesk Inventor and 3D printed with a Prusa (Prague, Czech Republic). The 3D printed parts were composed of Black Polylactic Acid Filament from Hatchbox 3D (Rowland Heights, CA 91748, USA). The CAD device had two subunits, an injector base and an injector cover, which snapped together, forming a conidia module (Figures 2A and 2B). To assemble the CAD system, an individual microfuge tube was loaded with Gc conidia, and its cap was removed with sanitized diagonal cutters. The microfuge tube was pressed onto the injector base (Figure 2C). The conidia module was assembled and inserted into the barrel of a 50-cc syringe (50mL Luer-Lok™ Syringe, Becton Dickinson, Franklin Lakes, NJ, USA). The exterior of the conidia module had two nodules to friction-fit the conidial module into the syringe. The conidia module was gently pushed to the base of the syringe barrel where the CAD injector port aligned with that of the syringe (Figure 2B). When fully inserted, the conidia module occupied 26 cc of the syringe.
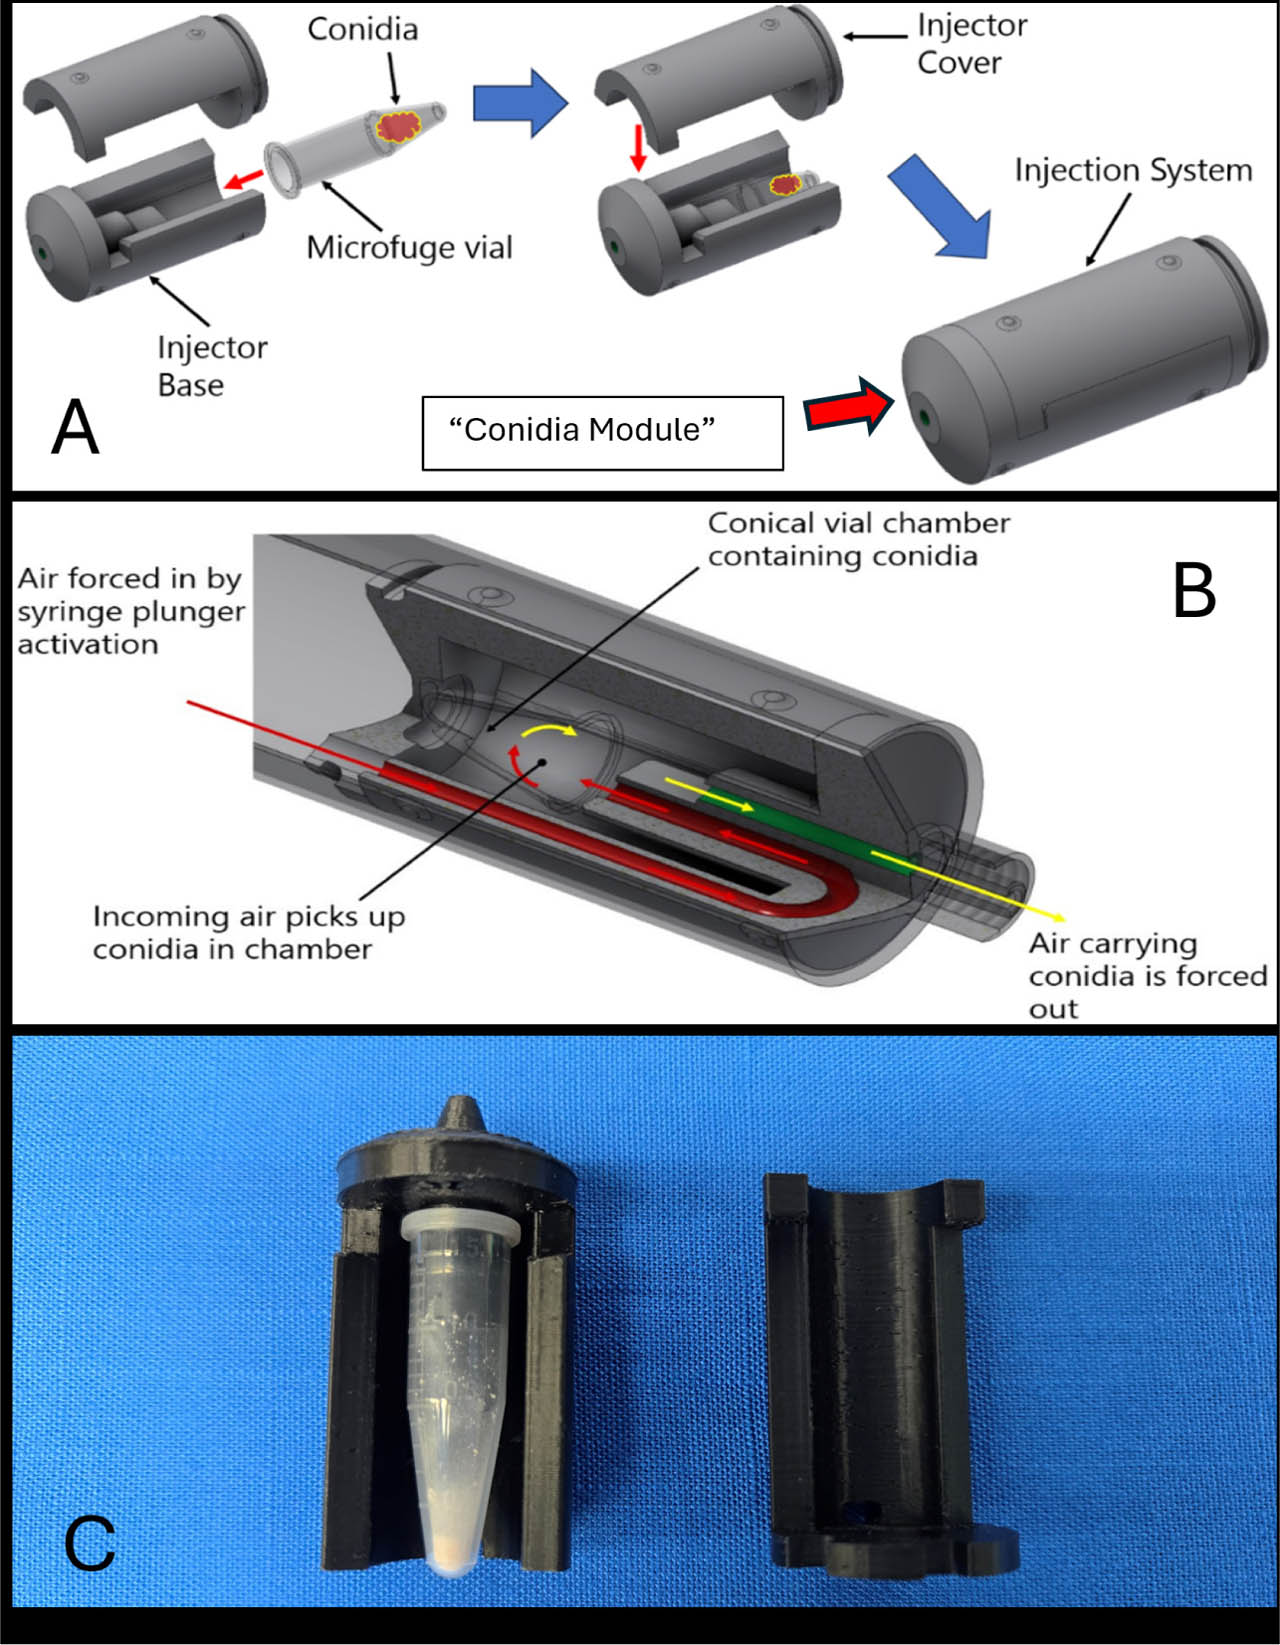
Figure 2.
The internal parts for a CAD unit are shown. (A) The illustration of CAD unit parts includes the Injector Base, which holds the spore-containing microfuge tube, and the Injector Cover, which connects to the Injector Base to form a capsule. The assembled system is called a Conidia Module. (B) The airflow within a CAD unit is shown in red (prior to hitting the spores) and in yellow (after picking up spores in the air stream). (C) A microfuge tube full of conidia is shown in a disassembled Conidia Module.
An assembled CAD unit attached to a Phytofuge Petri dish is depicted in Figure 3. The Phytofuge Petri dish lids had two ports (Figure 1D) to accommodate a single CAD syringe and a reservoir bag (30 mL PermLife Cell Culture Bag, OriGen BioMedical, Austin, TX, USA) to capture excess pressurized air. After the first injection, the CAD system and reservoir bag were flipped to inject spores onto the opposite At canopy. Initial results indicated that a single CAD system could be used twice to inject Gc conidia over both canopies in individual Petri dishes. Each port was configured with a needleless Luer lock connector (McMaster-Carr, Elmhurst, IL, USA), allowing the system to remain aseptically closed before, during, and after CAD connection.
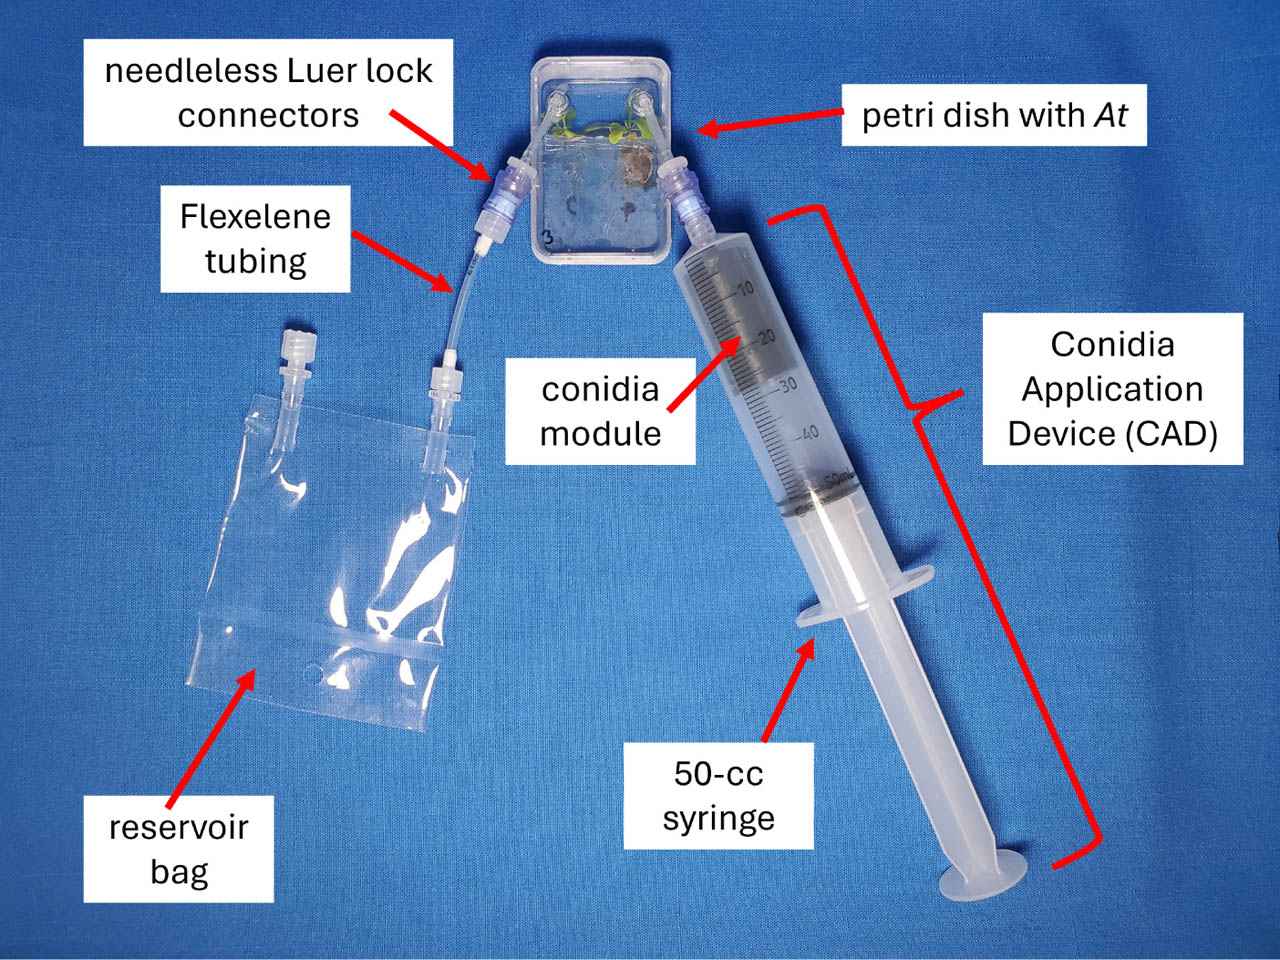
Figure 3.
The complete configuration of the CAD system connected to a mockup of the Petri dish. The 3D-printed conidia module was inserted into a 50-cc syringe and pushed into the syringe opening. The CAD unit and reservoir bag were attached to one Luer lock connector each, allowing for aseptic access to the inoculation ports above the canopies. The syringe plunger was drawn to the 50 mL mark to prepare the CAD for actuation.
An optimized inoculation procedure was developed through preliminary testing of parameters such as the amount of conidia, injection force, syringe drawback force, and the number of syringe pumps per port. The procedure utilized 0.1 cc of spores to inject once into the left port (above the Col-0 canopy) and thrice into the right port (above the pmr4 canopy), with hard pushes and drawbacks on the syringe plunger. Before the syringe was attached to each port, it was struck thrice on a hard surface to loosen conidia in the microfuge tube. The inoculation load of 0.1 cc per microfuge tube, approximately 1.8 x 10⁶ spores, was calculated after the spores passed through the CAD hardware and tubing. Thus, approximately 1.0 x 10⁶ spores entered the Petri dish void space after inoculation through both ports. The slight spore-load losses after injections were attributed to conidia getting caught in tubing and on CAD internal surfaces. The optimized procedure consistently produced successful disease across canopies of both cultivars (Figure 4) and thus was adopted for all subsequent tests.
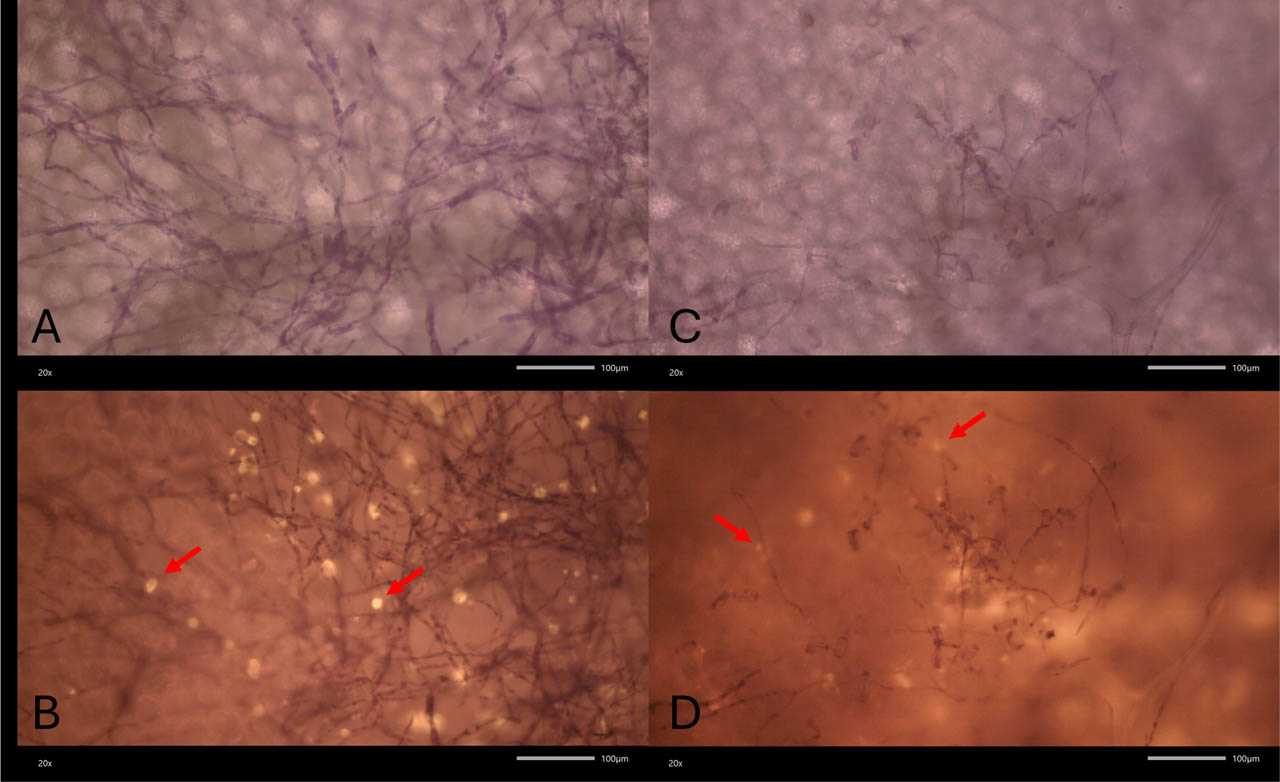
Figure 4.
Successful CAD inoculation of At canopies grown in a flight-like configuration using the optimized inoculation method. (A) Coomassie Brilliant Blue (CBB) mycelial stain of Gc growth on a Col-0 leaf at 20x. (B) Aniline Blue (AB) stain for callose (arrows) in a Col-0 leaf at 20x. (C) CBB stain of Gc mycelia on a powdery mildew resistant gene-4 (pmr4) leaf at 20x. (D) AB callose (arrows) stain on a pmr4 leaf at 20x. Note: the lower abundance of Gc mycelia and fewer callose deposits on the moderately resistant pmr4 leaf are expected.
Effects of the CAD on conidia viability
Conidia viability was assessed using the optimal CAD inoculation procedure to confirm that inoculation through the hardware did not negatively affect spore viability. Arabidopsis plants were grown in six Petri plates in flight-like configurations. Three plates were CAD-inoculated with 0.1 cc of conidia from 14-day-old Gc colonies, and three were brush-inoculated. Six leaves were assessed from each treatment: CAD-inoculated canopies behind the left port, CAD-inoculated canopies behind the right port, and brush-inoculated canopies. Leaves were stained with DCI for 3 minutes, washed with deionized water, and observed under an epifluorescent microscope. Conidia viability for each treatment was determined by counting the number of germinating spores (i.e., spores that produced a germ tube longer than half the length of the longest dimension of the conidium) out of the total number of spores present.
To assess conidia storage and shipment methods for the Gc/At flight experiment, two viability tests with Gc spores stored within CAD units were conducted. First, in CAD Storage Trial-1, five 1.5 mL microfuge tubes were used to vacuum approximately 0.1 cc of Gc conidia per tube from the surfaces of squash cotyledons with 14-day-old colonies. The microfuge tubes were maintained at 4°C for up to 28 days. One microfuge tube was removed at 0, 7, 14, 21, and 28 days. To assess conidial viability, sterile, fine-bristled paint brushes were used to transfer conidia from microfuge tubes onto squash leaf discs. Squash leaf discs were created using a #6 cork-borer from squash cotyledons cultivated as described above. The leaf discs were placed on modified Hydroponic Solution Agar amended with 18.22 g/L mannitol (CAS no. 69-65-8, Sigma Aldrich), 6.85 g/L sucrose (CAS no. 57-50-1, Sigma Aldrich), and 8 g/L agar (Bardin et al., 2007). Conidia were collected from microfuge tubes with sterile brushes and applied to the surface of each leaf disc. The Petri dishes were sealed and stored at room temperature for three days to promote conidial germination, at which point discs were stained with 3,3′-dihexyloxacarbocyanine iodide (DCI; 50 μg/mL in EtOH) (CAS no. 53213-82-4, Sigma Aldrich) and imaged with an epifluorescent microscope (serial no. 3311001542, Zeiss Axioskop 40, Göttingen, Germany) to estimate the percentage of viable spores through time. Viability was estimated as described above. Two randomized leaf discs were assessed per time point at 10x magnification.
In CAD Storage Trial-2, a comparison was conducted to estimate spore viability between Gc conidia stored in microfuge tubes alone versus tubes placed into CAD 3D-printed parts (Figure 2). Seven 1.5 mL microfuge tubes, each containing 0.1 cc of conidia, were fitted into conidia modules (Figure 2C) and positioned in syringes with their plungers fully actuated. The syringes' outlets were sealed with parafilm to limit gas exchange. All syringes were placed into sealed plastic bags to simulate the storage method for flight. An additional set of seven capped microfuge tubes, each containing 0.1 cc of conidia, were used as controls and sealed inside a separate bag. All samples were stored at 4°C until individual tubes were assayed at 0, 3, 7, 10, 14, 17, and 21 days with the leaf disc assay described above.
Conidia distribution across canopies
Three plates planted in a flight-like configuration were inoculated with 0.1 cc of conidia. All six canopies were stained with DCI for 3 minutes, washed with deionized water, and outlined on paper, with each leaf being assigned a number. All leaves on each canopy were individually imaged with an epifluorescent microscope at 10x magnification. In each field of view (919.49 x 1635.3 μm), spores were counted to place the area into one of five categories: (1) zero conidia, (2) one to nine conidia, (3) 10-99 conidia, (4) 100-999 conidia, and (5) 1000+ conidia. There was an average of 19 fields of view per mature At leaf. The areas were manually mapped across the canopies to provide a quantitative visual estimate of spore distribution. The data were transferred to digital silhouettes of the canopies created with Fiji (Schindelin et al., 2012) and mapped with Adobe Photoshop 2024 (Figure 5A-F). Additionally, one plate without plants or agar was inoculated with the same method to visualize the spore deposition pattern (Figure 5G).
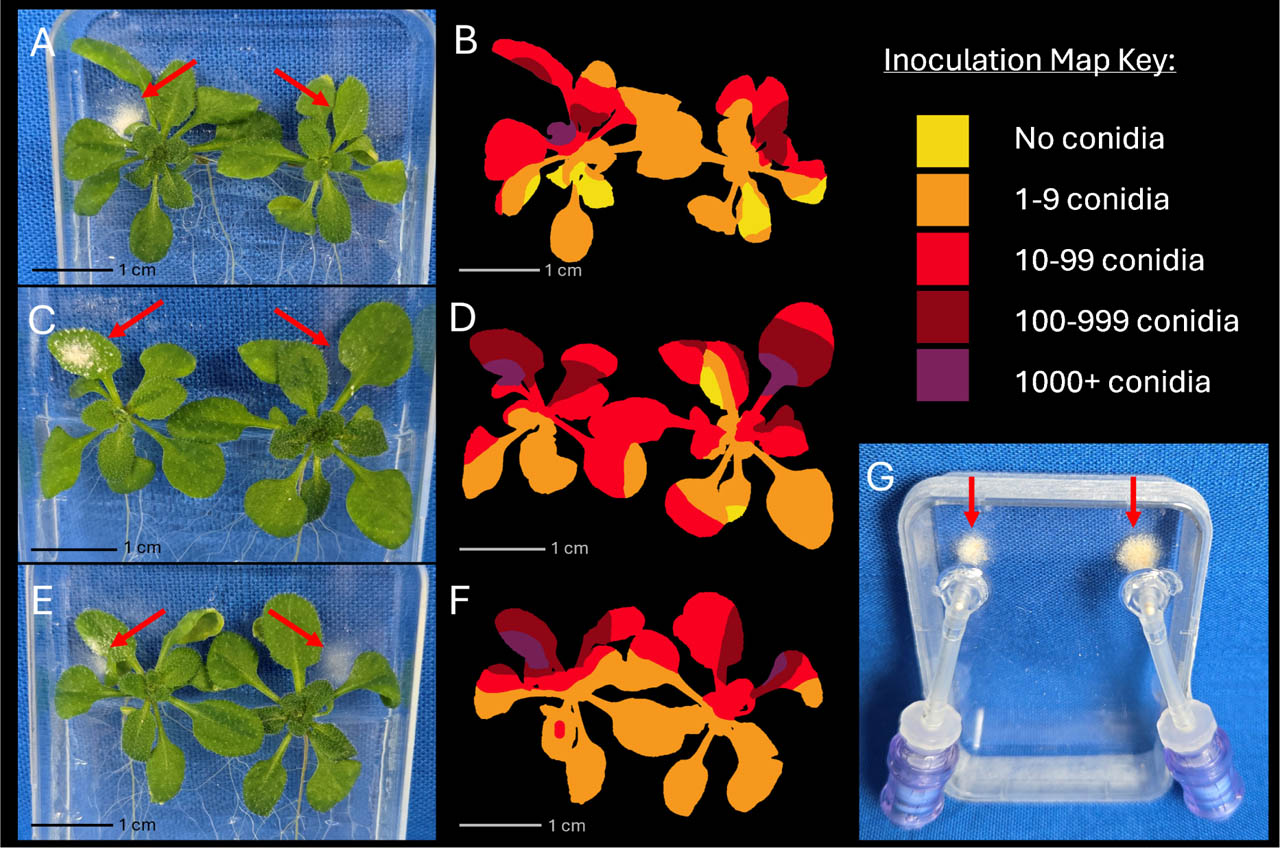
Figure 5.
Quantitative graphic of spore distribution after inoculation with the CAD system in a flight-like configuration. Note: The Inoculation Map Key presents data per field of view (919.49 x 1635.3 μm). There was an average of 19 fields of view per mature Arabidopsis leaf. (A) Image of the Plate 1 inoculation. (B) Plate 1 conidial abundance was mapped for each field of view at 10x magnification across all adaxial canopy surfaces. (C) Image of Plate 2 (analogous to A). (D) Conidial abundance map of Plate 2 (analogous to B). (E) Image of Plate 3 (analogous to A and C). (F) Conidial abundance map of Plate 3 (analogous to B and D). (G) The conidial deposition pattern from a flight-like CAD inoculation without canopies present is displayed (arrows).
Benchmark tests - SVT and EVT
The Science Verification Test (SVT; a required pre-flight test) was set up to test the Gc/At experimental protocols and timelines on six Phytofuge modules (Figure 1C). One half of the Phytofuge modules were inoculated, and one-half of the Phytofuge modules served as healthy controls. All CAD and Petri dish materials were sterilized with ethylene oxide, and Petri plates were assembled, as described above (see Conidia Application Device), and sealed with Micropore tape. The dishes were covered with Duvytene blackout cloth and conditioned to 4°C to delay germination (Sng et al., 2014), and conidia were collected and stored in sealed microfuge tubes, not pre-assembled CAD units.
To initiate the SVT, three Petri dishes were inserted into each of the six Phytofuge modules, which were connected to a controller to interface with the hardware. The hardware was set up in an incubator (E36HO, Percival Scientific, Inc., Perry, IA, USA) held at 22°C, 70% relative humidity, and 1000 ppm CO2. The incubator was intended to mimic all environmental conditions of the MVP facility, aside from μg. The At plants were allowed to develop to a nominal canopy size for 15 days prior to inoculation.
Inoculation was performed in a Class 2 Biological Safety Cabinet (NuAire, Minneapolis, MN, USA) on three of the Phytofuge modules (nine plates total). One Phytofuge was handled at a time, with all three plates being removed and secured into a mounting system called the Worktop (Figure S3). The CADs were assembled as described above, and a 0.2-micron filter was attached to the end of the syringe. The Luer lock interfaces were wiped with a BZK wipe (Acme United Corporation, Fairfield, CT, USA), and the reservoir bag was attached to the right connector. To inoculate, the syringe was tapped on a hard surface three times and its plunger drawn to the 50 mL mark. The filter was detached, and the syringe was attached to the left connector. The Gc spores were dispersed by pushing the plunger swiftly once until it contacted the conidia module. With the plunger still pushed in, the syringe was detached and tapped an additional three times to dislodge remaining conidia. It was reattached to the right connector (switched with the reservoir bag, which was reattached to the left). The plunger was slowly drawn out to the 50 mL mark, then the syringe was rapidly pumped three times. All materials were detached from the plate, and biowaste was discarded. This procedure was repeated with all other plates, using a fresh CAD unit and reservoir bag each time. After all inoculations were complete, the Phytofuge modules were transported back to the incubator, reconnected to the controller, and nominal conditions were resumed for an additional 13 days to allow fungal growth and disease development.
After 13 days, the At canopies were harvested and placed in previously described chemical fixatives. It is beyond the scope of this paper to describe the full harvest procedure and analyses in detail. Emphasis here will be placed on the functionality of the CAD inoculation devices. At harvest, half of the At canopies were processed to assess Gc aerial mycelium, conidiophores, and secondary conidia. Canopies were fixed in 3% glutaraldehyde (Ted Pella, Inc.) in 1x phosphate-buffered saline with 0.1% Triton X-100. After fixation, the samples were kept at ambient temperature for 4 h, then at 4°C for 8 days before processing the tissues for fluorescent staining or electron microscopy. Samples were rinsed thrice in 1x phosphate-buffered saline, then in sterile deionized water. Canopies were stained with DCI as described above, followed by dissection of all leaves and a comprehensive microscopic screening for disease symptoms and signs under the epifluorescent microscope (described below).
Leaves were cleared overnight with 90% EtOH, washed in deionized water, stained with Coomassie Brilliant Blue (CBB) (CAS no. 6104-59-2, Sigma Aldrich) for 20 seconds, rinsed in deionized water, washed in 0.07 M sodium phosphate buffer, pH 9, stained with Aniline Blue (AB) (CAS no. 66687-07-8, Sigma Aldrich) for 40 min, rinsed in sodium phosphate buffer, pH 9, and mounted on slides for assessment. The number of colonies present was determined by identifying CBB-stained conidia that had germinated and begun mycelial growth. The number of callose deposits was observed with the AB stain. Disease presence was determined using information from both stains: colony presence indicated fungal growth, and callose deposits indicated penetration and infection via haustoria. The number of leaves per canopy containing germinated conidia was recorded for all inoculated At canopies. The second half of the At canopies were assessed for transcriptomics analysis, not described here.
The Experiment Verification Test (EVT; a required pre-flight test), was structured in a nearly identical manner as the SVT, aside from the following. Eight Phytofuge modules were used, with half (12 plates) being inoculated. Source colonies of Gc conidia yielded fewer spores than expected. Thus, microfuge tubes were filled with only approximately 0.05 cc of conidia. Due to the lower spore volumes, the first inoculation into the Col-0 port was performed with slightly less pressure to conserve spores for the subsequent pmr4 inoculation. Plates were inoculated on day 14 because the canopies grew faster due to optimized plant growth parameters. A slight modification made to the Worktop included the addition of Velcro straps to better secure the plates during pmr4 inoculation. Post-harvest processing was identical to that of the SVT.
Results
Effects of the CAD on conidia viability
Viability rates of conidia inoculated with the CAD system or via brush inoculation were not significantly different. Out of approximately 2,000 spores counted for each treatment, CAD-inoculated conidia had 23.3% viability, while brush-inoculated conidia had 23.2% viability.
CAD Storage Trial-1 provided a baseline curve for comparing the viability of conidia when stored at 4°C. Viability persisted through 21 days, with a significant decrease at 14 days and no viability at 28 days (Table 1). In the CAD Storage Trial-2, conidial viability was compared between a set of CAD-stored microfuge tubes and a control set stored similarly to that of Trial-1. The T=0 time-step yielded lawns of Gc mycelia on squash leaf discs for both storage variables, exhibiting consistent conidial behavior (Table 1). Spore viability on day three was similar between the two storage variables, at approximately 50% for both methods. However, at 7 days, the viability of the CAD-stored conidia was reduced to 0% and remained as such for the rest of the experiment. The microfuge-stored conidia followed the expected viability trend observed in preliminary testing (Table 1).
Table 1.
Percent viability of conidia stored at 4°C in microfuge tubes vs in the CAD over time. Two tests (CAD Storage Trial-1 and -2) are displayed in which different time points were assayed. The results for the different storage methods of Storage Trial-2 are in separate columns. A dash indicates that no data were taken at that time point for that test.
| Storage Time (days) | CAD Storage Trial-1 | CAD Storage Trial-2 (stored in microfuge) | CAD Storage Trial-2 (stored in CAD) |
|---|---|---|---|
| T=0 | 58.0% | 94.0% | 91.7% |
| T=3 | - | 42.0% | 58.7% |
| T=7 | 39.2% | 79.6% | 0.0% |
| T=10 | - | 45.6% | 0.0% |
| T=14 | 7.1% | 2.4% | 0.0% |
| T=17 | - | 1.7% | 0.0% |
| T=21 | 0.1% | 0.5% | 0.0% |
| T=28 | 0.0% | - | - |
Conidia distribution across canopies
All leaves contained at least one conidium. Conidial abundance was approximated per 10x field of view (919.49 x 1635.3 μm) under a microscope, and there was an average of 19 fields of view per mature At leaf. Five leaves in the first Petri plate, the areas furthest from the inoculation ports, contained nine or fewer conidia (Figures 5A-B). The remaining 17 leaves had at least 10 conidia, with seven leaves containing at least 100 conidia. The second plate (Figures 5C-D) had 19 leaves with 10 or more conidia and 12 leaves containing at least 100 conidia. The third set of canopies (Figures 5E-F) had the most standard distribution of spores, with no field of view containing zero conidia. The third plate had 16 leaves with 10 or more conidia and six leaves containing at least 100 conidia. In all cases, the largest number of spores per field of view was located directly under the inoculation port. Leaf placement under the inoculation ports (Figures 5A, C, and E) differed among the three cases and likely contributed to differences in spore distribution and ricochet effects across leaf surfaces. Additionally, it was observed that a large number of spores were ejected from both inoculation ports using this method (Figure 5G).
Benchmark tests - SVT and EVT
In the SVT, CAD units were used to inoculate nine Petri plates. Six canopies were assessed using DCI (Figure 6A), CBB (Figure 6B), and AB (Figure 6C) fluorescent stains to detect disease symptoms and signs (Table 2). All CAD units successfully ejected conidia onto At canopies with no hardware malfunctions (Figure 6D). In total, 62 mature leaves across six canopies (26 leaves for Col-0; 36 leaves for pmr4) were assessed. Of the 62 leaves stained, 16 leaves (eight Col-0; eight pmr4) exhibited one or more conidia infecting At tissues, resulting in a 25.8% success rate for combined development of aerial mycelia and disease symptoms (Figure 6A-C). Conidia (dead or alive) were present on 100% of mature leaves in each canopy.
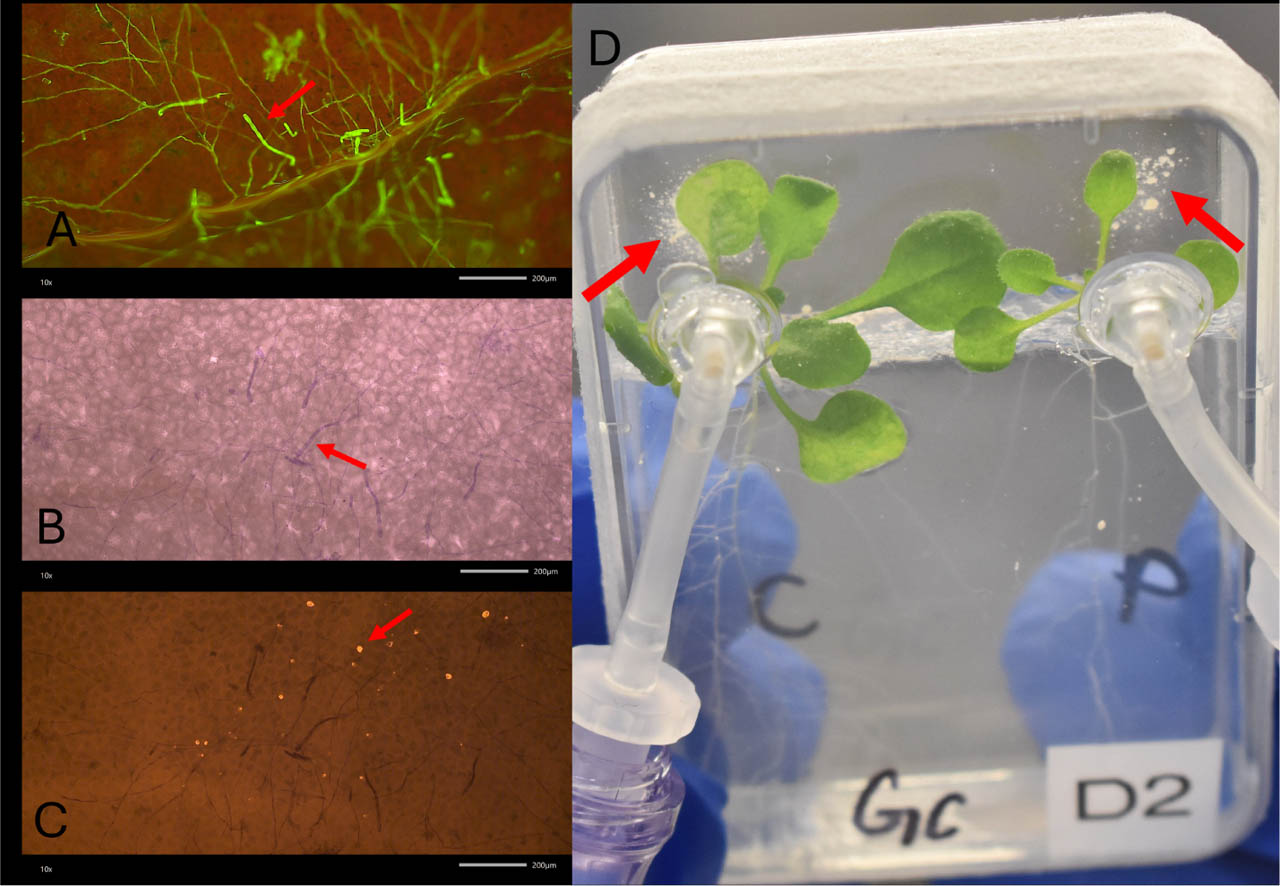
Figure 6.
The SVT injection and fluorescent stain analysis. (A) Canopies were first stained with DCI to view mycelia, conidiophores, and secondary conidia (arrow) at 10x magnification for an initial screening of fungal presence. (B) A more comprehensive analysis was done at 10x magnification with CBB stain (Col-0 canopy shown here) to view mycelia, conidiophores, and secondary conidia (arrow); and with (C) AB stain (matching image pair to B) to show disease development through callose deposits (arrow) along the mycelial network. (D) A nominal inoculation is displayed from the SVT with nearly equivalent amounts of conidia behind both ports (arrows).
During the EVT, CAD units were used to inoculate 12 Petri plates, six of which were processed with the fluorescent stains DCI (Figure 7A), CBB (Figure 7B), and AB (Figure 7C). All CAD units successfully injected conidia into the Petri dishes' void spaces, with all inoculated canopies receiving Gc conidia (Figure 7D). There were no CAD hardware malfunctions observed in the EVT. A total of 74 leaves were assessed (37 for Col-0; 17 for pmr4) for disease signs and symptoms (Table 2). Of the 74 leaves stained and examined, 27 leaves (18 Col-0; 5 pmr4) exhibited one or more conidia infecting host tissues (Figure 7A-C). The EVT had a higher success rate than the SVT for all leaf inoculations, with 36.5% of leaves displaying infection, and a similar range of conidial dispersal, with 100% of canopies having spore presence.
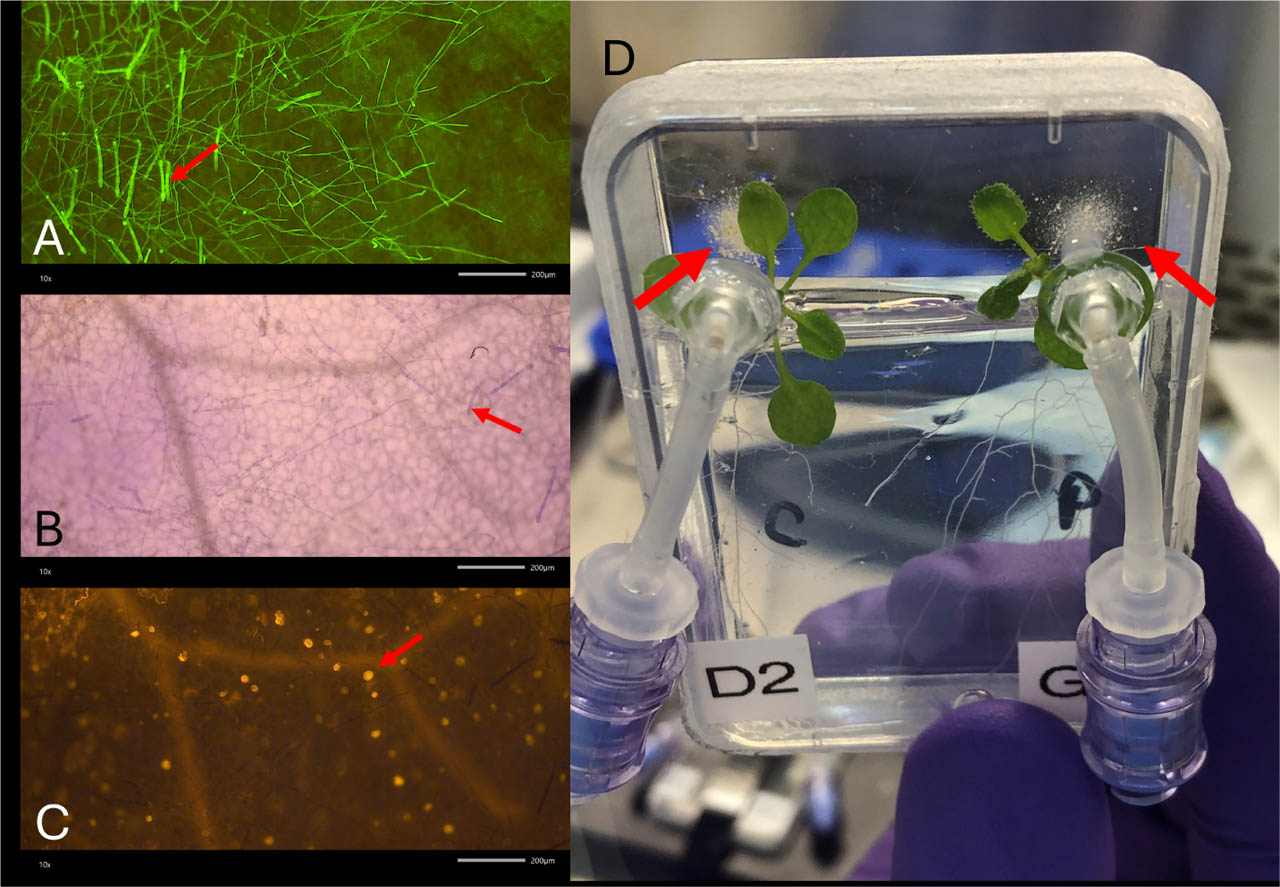
Figure 7.
The EVT injection and fluorescent stain analysis. (A) Canopies were first stained with DCI to view mycelia, conidiophores, and secondary conidia (arrow) at 10x magnification for an initial screening of fungal presence. (B) A more comprehensive analysis was done at 10x magnification with CBB stain (Col-0 canopy; same as A) to view mycelia, conidiophores, and secondary conidia (arrow); and with (C) AB stain (matching image pair to B) to show disease development through callose deposits (arrow) along the mycelial network. (D) A nominal inoculation is observed in the EVT, with nearly equivalent amounts of conidia at both ports (arrows).
Table 2.
Disease development across all canopies inoculated during the SVT and EVT benchmark tests. The value of total leaves includes every leaf on all canopies present during inoculation. All leaves had fungal presence post-CAD inoculation in the form of conidia (both viable and non-viable). Disease presence is defined as the number of leaves containing viable conidia that produced a mycelial network (observed with the mycelial stain, CBB) and penetrated the leaf tissue with an infection peg and haustoria (observed with the callose stain, AB).
| Total At leaves | # At leaves with disease | % At leaves with disease | |
|---|---|---|---|
| SVT Col-0 | 26 | 8 | 30.8 |
| SVT pmr4 | 36 | 8 | 22.2 |
| EVT Col-0 | 37 | 18 | 48.6 |
| EVT pmr4 | 17 | 5 | 29.4 |
Discussion
The CAD system was successfully developed as the first plant canopy aerial inoculation device designed for use in μg. The CAD units ejected conidia onto the majority of leaves in all tests, with 100% nominal injections and successful disease presence in the SVT and EVT. Despite many spores adhering to the back walls of the Petri dishes (Figures 6D and 7D), conidia were observed on all mature At leaves, indicating spore dispersal across all canopies.
There were many challenges in developing the CAD system for inoculating plant leaves in space. In addition to known engineering obstacles of flight experiments, such as crew time and resource limitations (Reed and Vanden Bosch, 2023), the independent requirements of both the Gc phytopathogen and At host in the spaceflight environment had to be considered. A diversity of techniques have been used to apply fungal spores to plant leaves in terrestrial greenhouse and growth chamber studies including (i) settling towers in which spores are aerosolized several decimeters above plant canopies and allowed to settle in a 1g air environment (Stien et al., 2006; Sowa and Paczos-Grzeda, 2021), (ii) direct sticky tape transfers (Loarce et al., 2016), (iii) direct transfer of spores with paint brushes (Ghanmi et al., 2004), and (iv) transfer of spores with sterile spatulas (Menzies et al., 2019). In addition, fungal spores are often dispersed into carrier fluids such as Fluorinert (Schuerger and Hammer, 2003), light mineral oil (Carson, 2011), or Bayol (Gnanesh et al., 2013) and then applied as spore suspensions to plant leaves. All the techniques listed above for ground-based assays are problematic for applying dried Gc conidia to At leaves during flight due to constraints such as the μg environment and astronaut safety. Opening a receptacle containing Gc conidia in μg would expose the spores to contaminants in the ISS environment, risk the sterility of the Gc/At experiment, and possibly contaminate other concomitant plant growth experiments on the ISS. Additionally, source and target plants cannot be flown concurrently, which would be required for sticky tape, brush, or sterile spatula transfers. Carrier fluid exposures of many hours to many days are lethal for most fungal spores (see references listed above). For example, powdery mildew conidia remain viable for only a few hours, no longer than approximately 24 h, in sterile deionized water (Sivapalan, 1993), a benign carrier fluid. Thus, the approach of collecting and storing Gc conidia dry within 1.5 mL microfuge tubes was adopted.
The CAD inoculation system designed for the Gc/At pathosystem can serve as a guideline for other flight-experiment inoculation designs. Alterations will likely be needed to accommodate different phytopathogens, hosts, and plant growth systems. For example, other propagules may infect non-foliar plant tissues or respond better to a water-based storage and inoculation system, as utilized for P. sojae in Ryba-White et al. (2001). One consideration not pursued here, due to time and budget constraints, was improving the physical operation of the syringe. Developing a system with an automatic injection process, such as a spring-based or pneumatic injector, would allow for uniform inoculations. It was observed that the inoculation varied slightly between operators. A “hard push” will equate to different forces depending on an astronaut's physique and interpretation of the protocol.
Throughout CAD experiments described herein, Gc conidia dispersal was a primary goal of the project. Although the CAD inoculation system was successful during the SVT and EVT, most of the injected conidia adhered to the back wall of the Petri dishes. Thus, a more uniform dispersal of conidia would likely result in a greater number of viable spores contacting leaf surfaces. An effort to further optimize spore dispersal during CAD inoculation, such as through altering port placement, should be considered. Injection of spores into Petri dishes was more consistent when physical vibrational forces were applied to the CAD units by lightly striking the inoculation devices against a hard surface. During conidia collection, it appeared that the cyclone vacuum caused the spores to pack at the bottom of the microfuge tube, making them more difficult to dislodge during injection. Striking the CAD units against a hard surface effectively agitated or loosened the masses of conidia, allowing the air to more easily collect most of the spores during syringe plunger operation.
The ability to store conidia in the CAD unit for long periods of time will be crucial for its use in future flight experiments. The current hypothesis for the viability loss of conidia stored in the CAD units was the possibility that the material used to make the 3D-printed conidia module – Polylactic acid (PLA) - was hygroscopic, resulting in the rapid desiccation of the conidia. In the presence of the well-hydrated, healthy conidia, the PLA might have absorbed water vapor from the inside of the microfuge vials. The CAD injector base and cover were not printed with 100% infill, so there were small air gaps between the 3D-printed PLA filaments, which could have absorbed water vapor and further promoted desiccation of the conidia. Additionally, the PLA could have interacted with the conidia via off-gassing of unknown volatile organic compounds. Thus, the CAD units and the conidia will be stored separately during flight for the Gc/At experiment and assembled on orbit immediately preceding inoculation.
For the timeline of the Gc/At flight experiment, a protocol to store Gc conidia in a viable state for up to 21 days was developed. As an obligate biotroph, Gc conidia would not remain viable off-host for longer than 24–48 h (Sivapalan. 1993). Thus, with the Gc/At experiment, the known viable storage period of the short-lived Gc conidia was extended. However, in populations of stored spores, viability was lower than when inoculating with fresh conidia. To accommodate this, the SVT, EVT, and flight experiment were designed with an overabundance of host replicates. Thus, with thousands of spores in each CAD injection, disease presence was within the successful range for each variable in both SVT and EVT. Additionally, the presence of conidia on 100% of leaves in the inoculation system demonstrated the CAD system's dispersal ability. Spore viability, while important for our flight experiment, will vary by phytopathogen. The viabilities observed in the SVT and EVT were products of conidial fragility off-host and the storage method required for flight.
Conclusions
Plant production is a critical element in long-term human space exploration. Understanding how plants and phytopathogens interact in space will enhance resource security and productivity. Multiple plant pathogen species have already been shown to exist and persist in the spaceflight environment (Schuerger et al., 2022). Additionally, it has been suggested that plant diseases develop faster and with a broader range of host/pathogen combinations in μg when compared to Earth (Schuerger, 2021a). There are many challenges of spaceflight research that add complexity to known mechanisms of host/pathogen interactions, and standard plant pathology research is not yet optimized for space. The Conidia Application Device, the first hardware developed for phytopathogen inoculation in space, was a step towards overcoming this barrier. The CAD system demonstrated an ability to successfully and aseptically eject viable powdery mildew conidia onto Arabidopsis thaliana canopies in a flight-like configuration, resulting in subsequent disease development. The inoculation procedure was optimized to include a tap of the syringe to dislodge conidia, one pump in the first port and three pumps in the second port to distribute a comparable number of spores to each side, and forceful pumping to promote turbulence. Throughout testing, the optimized method of CAD operations produced successful inoculation rates across canopies in the Gc/At flight experiment system.
The CAD unit will enable phytopathology research in μg, including foliar disease development in μg on plants grown from seed and inoculated in μg. The field of space plant pathology lacks sufficient data to support complex plant growth experiments. Without engineering support, questions that require on-orbit testing will remain unanswered, and systems to protect space agriculture will remain underdeveloped. Complete avoidance of disease is impossible with open plant growth systems in space. Thus, mitigation practices must be established to avoid unanticipated epidemics in an environment with limited resources. Effective disease management protocols can only be developed through a fundamental understanding of host/pathogen interactions in space.
Acknowledgements
This work was supported by funding from the NASA Space Biology Office (#80NSSC22K0209). We would like to thank Redwire Space Technologies Inc. for designing and developing the CAD, as well as Sam Logan, the principal designer of the CAD system. Additionally, we would like to thank Clayton Grosse and Ashleigh Ruggles for their invaluable assistance in performing operations and managing hardware for preliminary and benchmark experiments (i.e., SVT and EVT).
Notes
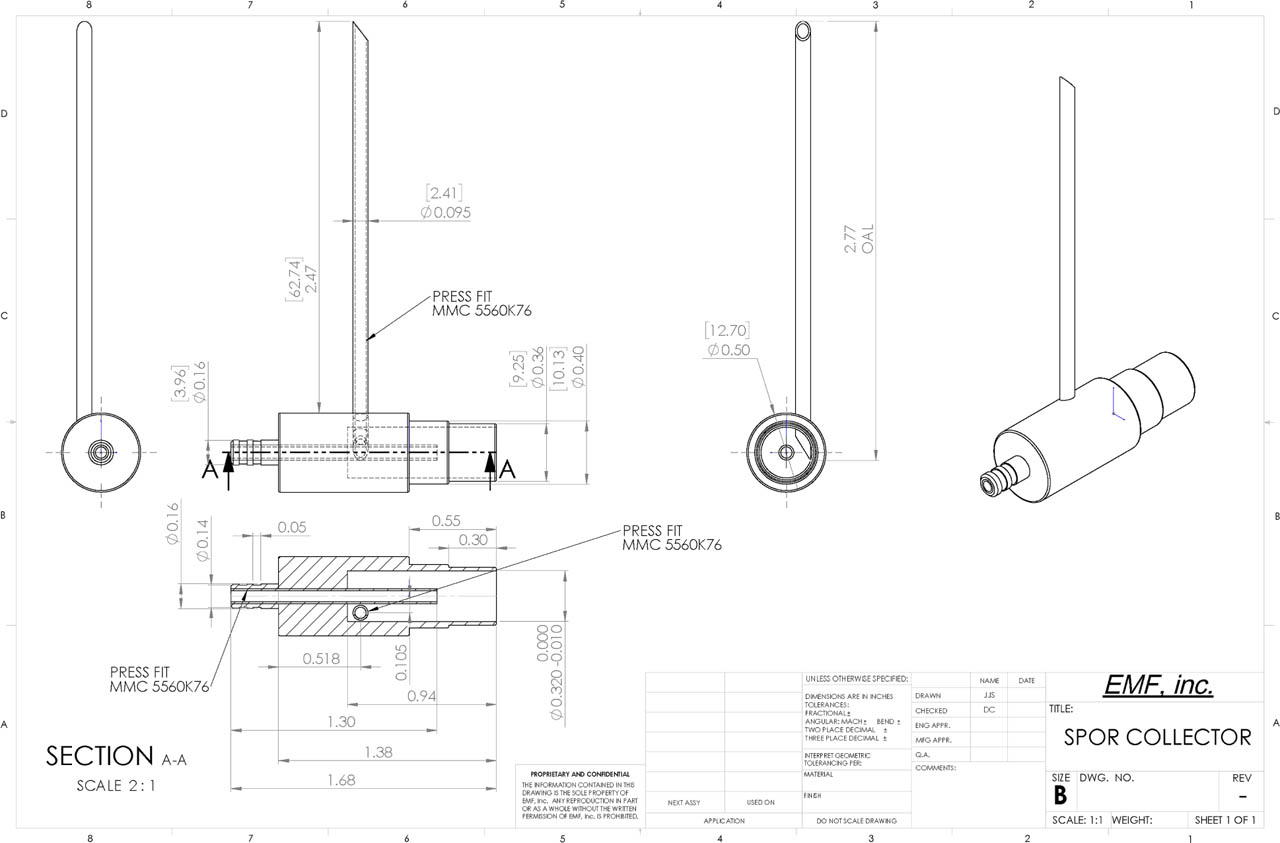
Figure S1.
AutoCAD drawing of the cyclonic spore collector. The collection appendage (arrow) was slightly offset from the center alignment to create a cyclonic vacuum effect on the collected spores. Collected conidia would swirl around the center cavity of the spore collector until eventually settling in the attached microfuge tube. The diagram was used with permission from the Photon Group, LLC. The design package used for generating Figure S1 was SolidWorks version sp3 (Dassault Systèmes, Waltham, MA, USA).
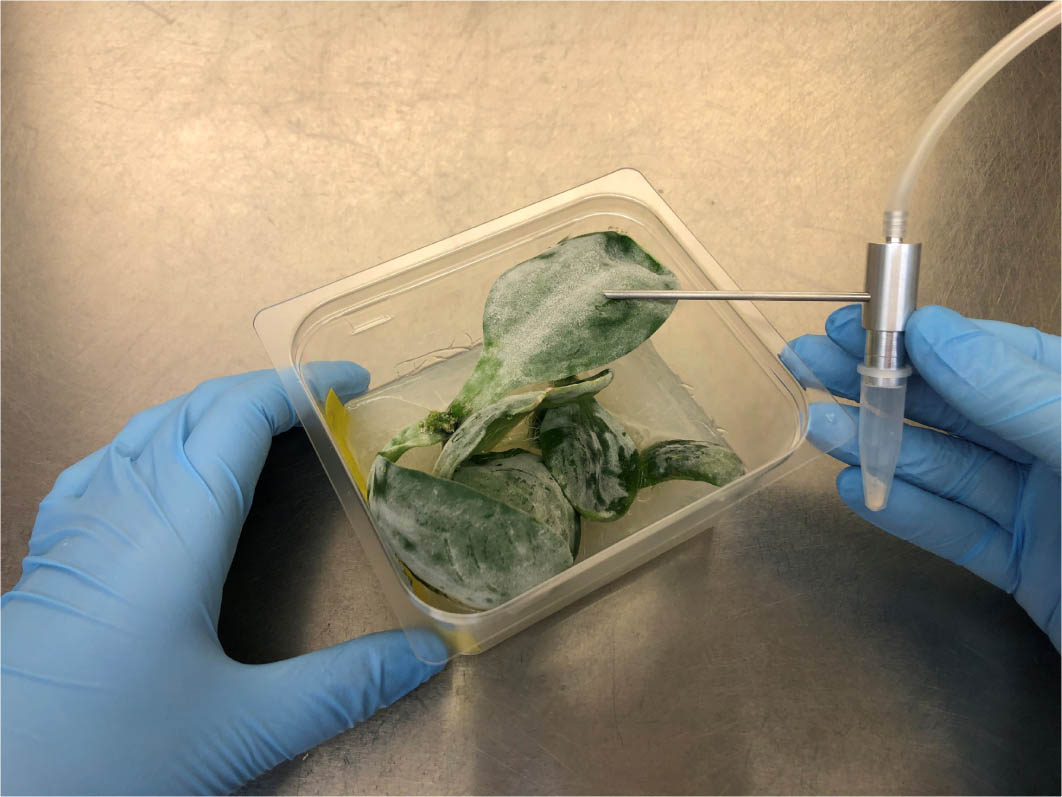
Figure S2.
The cyclone spore collector was used to vacuum conidia from squash cotyledon surfaces into microfuge vials. The tubing on the cyclone spore collector flange was connected to a vacuum pump. The collection appendage was passed over 14-day-old Gc colonies growing on squash cotyledons to gently vacuum spores through the spore collector and into the attached microfuge tube.
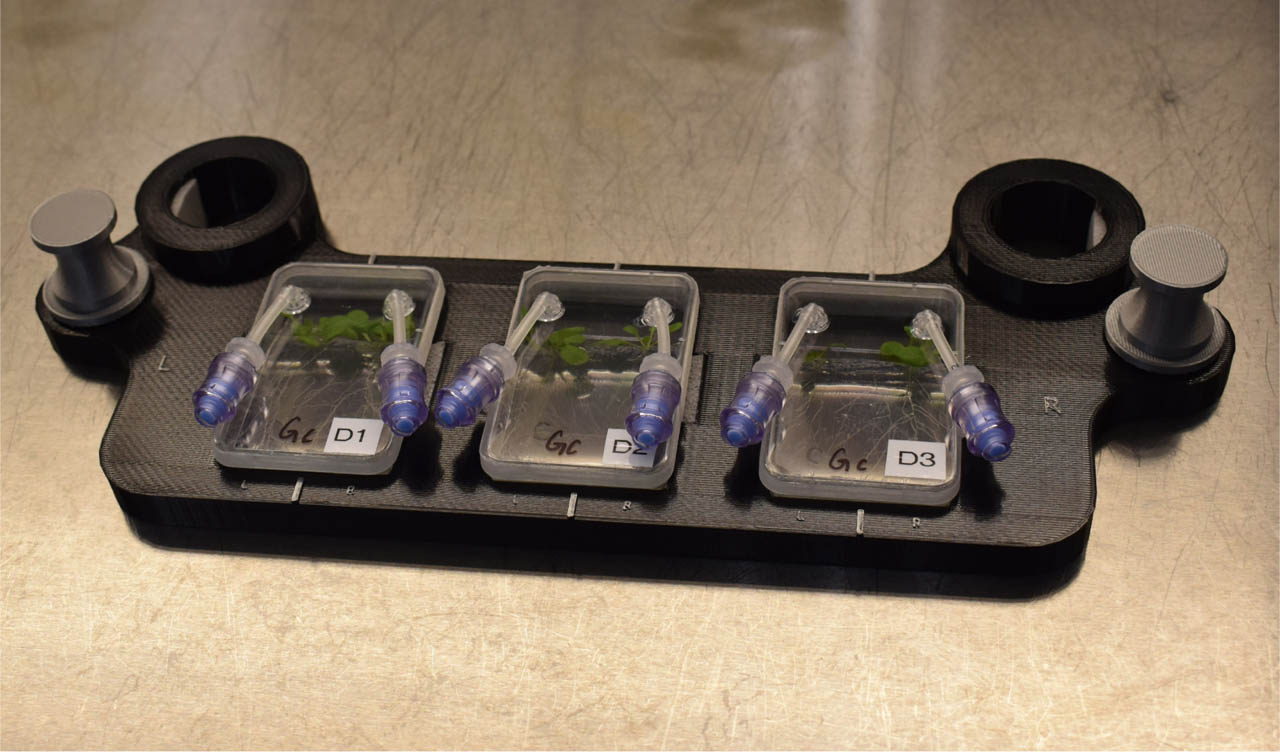
Figure S3.
Three Phytofuge plates were assembled on the Worktop immediately prior to SVT inoculation. The Worktop was designed to prevent severe jostling of the Petri plates during inoculation, especially the 3-pump inoculation into the right port. Additionally, it will function to hold the plates stationary in microgravity. During the EVT, vertical Velcro straps were added to the design to increase security.