
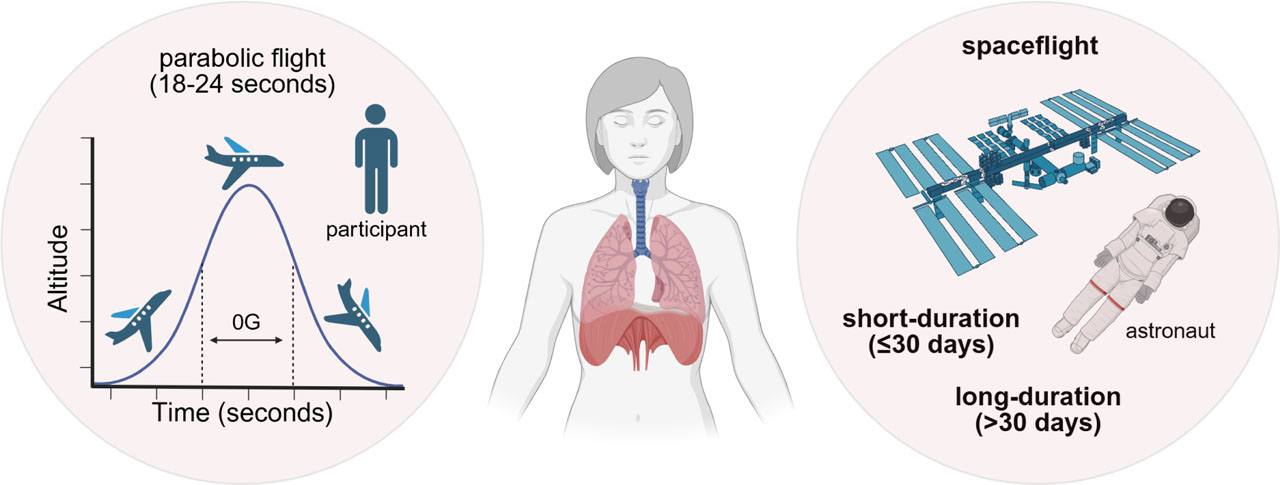
Figure 1.
Schematic diagram of systematic review focus on exploring functional pulmonary system outcome measures in space during parabolic flight, short- and long-duration spaceflight. Diagram shows parabolic flight path to create microgravity and space station in space for short- and long-duration spaceflight studies. Created with BioRender.com
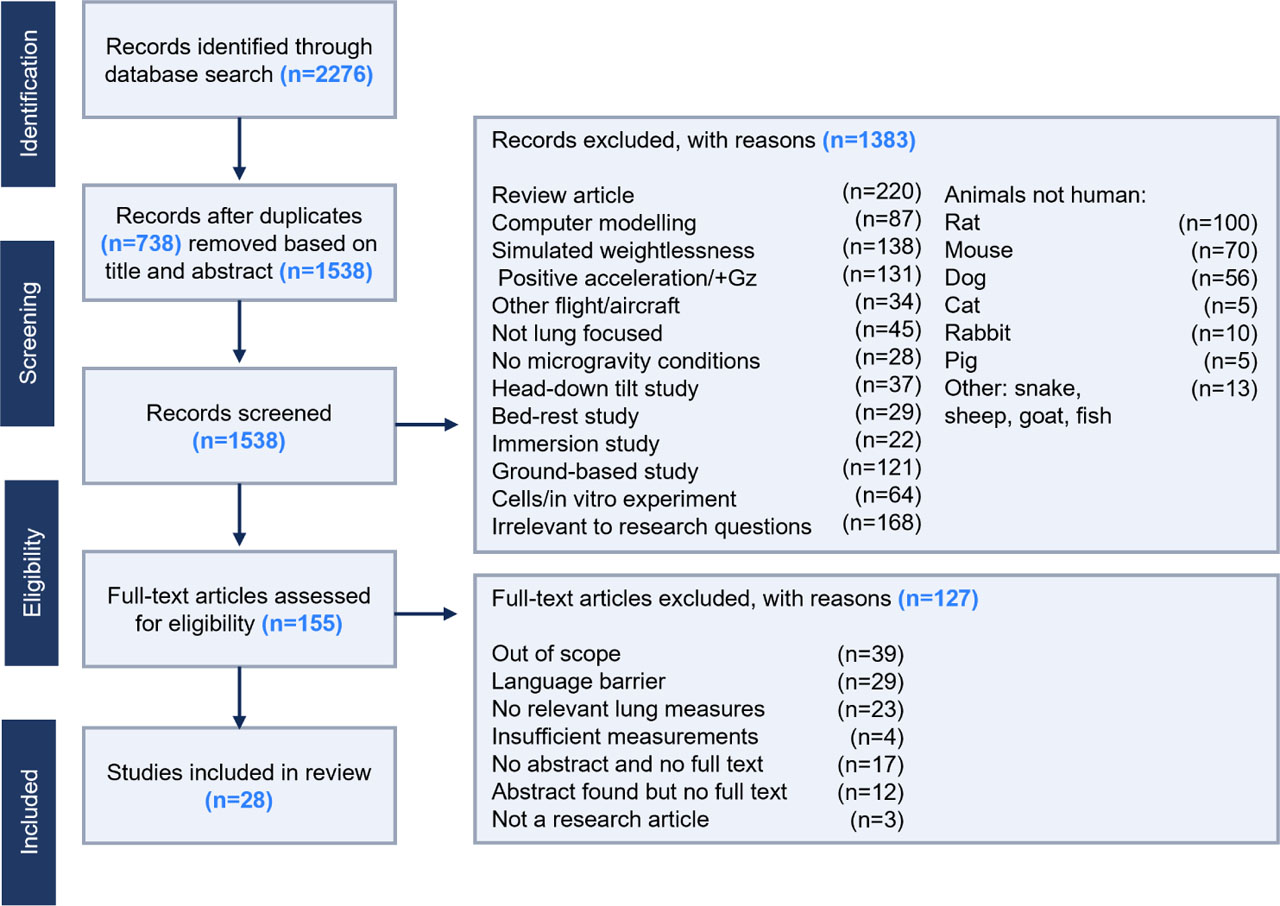
Figure 2.
PRISMA flow diagram demonstrating summary of literature search and screening process.
Table 1.
Characteristics and pulmonary outcome measures of included studies.
| Study | Number of participants (n) | Sex (M/F) | Flight type | 0G exposure duration | Outcome measures |
|---|---|---|---|---|---|
| Baevsky et al. 2007 | 8 | 8/0 | Long | 179 d | Respiration frequency |
| Bettinelli et al. 2002a | 6 | 4/2 | Parabolic | 20 s | Pressure, compliance |
| Bettinelli et al. 2002b | 4 | 3/1 | Parabolic | 20 s | Compliance |
| Conkin et al. 2017 | 8 | 8/0 | Short | 10 d | Respiration frequency |
| Dellacá et al. 2004 | 5 | 4/1 | Parabolic | 20 s | Breathing time, MIF, V̇E, compliance, respiratory work, elastic work |
| Di Rienzo et al. 2008 | 4 | 3/1 | Short | 16 d | Respiration frequency |
| Dutrieue et al. 2003 | 9 | 4/5 | Parabolic | 22 s | Breathing time, FEF |
| Dutrieue et al. 2005 | 7 | 4/3 | Parabolic | 18 s | Breathing time |
| Edyvean et al. 1991 | 5 | 5/0 | Parabolic | 18 s | Respiration frequency, pressure, compliance, resistance |
| Elliott et al. 1996 | 7 | 4/3 | Short | 9 d | PEFR |
| Elliott et al. 2001 | 5 | 4/1 | Short | 13 d | Respiration frequency |
| Estenne et al. 1992 | 5 | 5/0 | Parabolic | 20 s | Breathing time, MIF, respiration frequency |
| Frerichs et al. 2001 | 7 | 6/1 | Parabolic | 20 s | Respiration frequency |
| Frerichs et al. 2005 | 8 | 7/1 | Parabolic | 20 s | Respiration frequency |
| Guy et al. 1991 | 9 | 5/4 | Parabolic | 24 s | FEF, PEFR |
| Hahn et al. 2013 | 22 | 16/6 | Parabolic | 21 s | Respiration frequency, resistivity |
| Levine et al. 1996 | 6 | 4/2 | Short | 14 d | V̇O2, V̇E, work rate, economy |
| Limper et al. 2014 | 18 | 9/9 | Parabolic | 23 s | V̇O2 |
| Prisk et al. 1993 | 7 | 4/3 | Short | 9 d | Pulmonary diffusing capacity |
| Prisk et al. 1995 | 8 | 5/3 | Short | 23 d | Respiration frequency, V̇O2, V̇CO2, MIF, breathing time, pressure, V̇E |
| Prisk et al. 2000 | 5 | 4/1 | Short | 16 d | Respiration frequency, V̇E, pressure |
| Prisk et al. 2006 | 10 | 9/1 | Long | 163 d | Respiration frequency, V̇O2, V̇CO2, FEF, PEFR, pressure, V̇E |
| Sá et al. 2009 | 5 | 4/1 | Short | 17 d | Breathing time, MIF, V̇E |
| Stegemann et al. 1997 | 4 | 4/0 | Short | 10 d | V̇O2, V̇CO2, V̇E |
| Trappe et al. 2006 | 4 | 4/0 | Short | 17 d | V̇O2, V̇E |
| Väida et al. 1997 | 10 | 10/0 | Parabolic | 20 s | Pulmonary diffusing capacity |
| Verbanck et al. 1997 | 4 | 4/0 | Short | 10 d | Pulmonary diffusing capacity |
| Verheyden et al. 2010 | 11 | 11/0 | Long | 180 d | Respiration frequency |
[i] MIF - mean inspiratory flow, V̇E - minute ventilation, FEF - forced expiratory flow, PEFR - peak expiratory flow rate, V̇O2 - oxygen consumption, V̇CO2 - carbon dioxide production. A full list of definitions of pulmonary terms is found in Supplementary Material 2.
Table 2.
Analysis of risk of bias of included studies using RoBANS.
| Study | Selection of participants | Confounding variables | Intervention (exposure) measurement | Blinding of outcome assessment | Incomplete outcome data | Selective outcome reporting | Overall risk of bias |
|---|---|---|---|---|---|---|---|
| Baevsky et al. 2007 | Low | Unclear | Low | Unclear | Low | Low | Low |
| Bettinelli et al. 2002a | Low | Unclear | Low | Unclear | Low | Low | Low |
| Bettinelli et al. 2002b | Low | Low | Low | Unclear | Low | Low | Low |
| Conkin et al. 2017 | Low | Low | Low | Low | Low | Low | Low |
| Dellacá et al. 2004 | Low | Unclear | Low | Unclear | Low | Low | Low |
| Di Rienzo et al. 2008 | Low | Unclear | Low | Unclear | Unclear | Low | Unclear |
| Dutrieue et al. 2003 | Low | Low | Low | Low | Low | Low | Low |
| Dutrieue et al. 2005 | Low | Low | Low | Low | Low | Low | Low |
| Edyvean et al. 1991 | Low | Unclear | Low | Unclear | Low | Low | Low |
| Elliott et al. 1996 | Low | Low | Low | Unclear | Unclear | Low | Low |
| Elliott et al. 2001 | Low | Low | Low | Low | Low | Low | Low |
| Estenne et al. 1992 | Low | Unclear | Low | Low | Low | Low | Low |
| Frerichs et al. 2001 | Low | Unclear | Low | Unclear | Low | Low | Low |
| Frerichs et al. 2005 | Low | Low | Low | Unclear | Low | Low | Low |
| Guy et al. 1991 | Low | Low | Low | Unclear | Low | Low | Low |
| Hahn et al. 2013 | Low | Unclear | Low | Unclear | Unclear | Low | Unclear |
| Levine et al. 1996 | Low | Unclear | Low | Low | High | Low | Unclear |
| Limper et al. 2014 | Low | Low | Low | Low | Low | Low | Low |
| Prisk et al. 1993 | Low | Low | Low | Low | High | Low | Low |
| Prisk et al. 1995 | Low | Low | Low | Low | Low | Low | Low |
| Prisk et al. 2000 | Low | Low | Low | Low | Low | Low | Low |
| Prisk et al. 2006 | Low | Low | Low | Unclear | Unclear | Low | Low |
| Sá et al. 2009 | Low | Low | Low | Low | Low | Low | Low |
| Stegemann et al. 1997 | Low | Low | Low | Low | Low | Low | Low |
| Trappe et al. 2006 | High | Unclear | Low | Unclear | Low | Low | Unclear |
| Väida et al. 1997 | Low | Low | Low | Low | Low | Low | Low |
| Verbanck et al. 1997 | Low | Low | Low | Low | Unclear | Low | Low |
| Verheyden et al. 2010 | Low | Unclear | Low | Low | Low | Low | Low |
Table 3.
Summary of pulmonary functional outcome measures in microgravity during parabolic flight, short- and long-duration spaceflight.
| Outcome measure | Parabolic | Short | Long |
|---|---|---|---|
| Respiration frequency | ✔ | ✔ | ✔ |
| Minute ventilation (V̇E) | ✔ | ✔ | ✔ |
| Volume of oxygen consumption (V̇O2) | ✔ | ✔ | ✔ |
| Volume of carbon dioxide production (V̇CO2) | – | ✔ | ✔ |
| Forced expiratory flow (FEF) | ✔ | – | ✔ |
| Mean inspiratory flow (MIF) | ✔ | ✔ | – |
| Peak expiratory flow rate (PEFR) | ✔ | ✔ | ✔ |
| Breathing time | ✔ | ✔ | – |
| Pulmonary diffusing capacity | ✔ | ✔ | – |
| Pulmonary capillary blood volume (VC) | – | ✔ | – |
| Pulmonary capillary blood flow (Qc) | – | ✔ | – |
| Pressure | ✔ | ✔ | ✔ |
| Compliance | ✔ | – | – |
| Resistance | ✔ | – | – |
| Resistivity | ✔ | – | – |
| Respiratory work | ✔ | – | – |
| Elastic work | ✔ | – | – |
| Exercise work rate | – | ✔ | – |
| Exercise economy | – | ✔ | – |
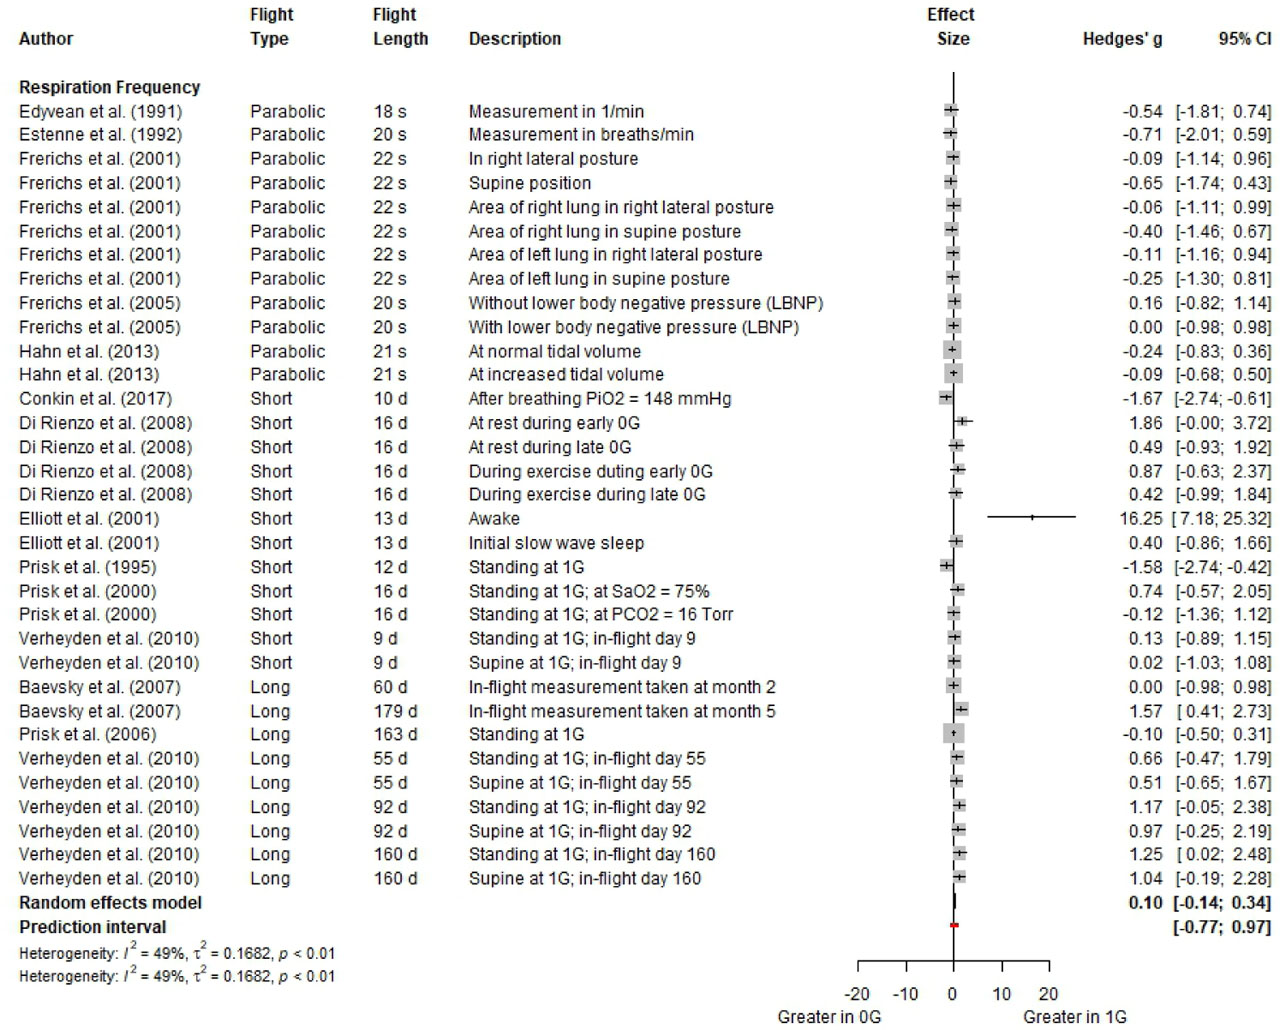
Figure 3.
Forest plot for respiration frequency in 0G compared to 1G (i.e., a right-ward shift indicated a larger measure in 1G). Effect sizes are reported as Hedge’s g with 95% confidence intervals.
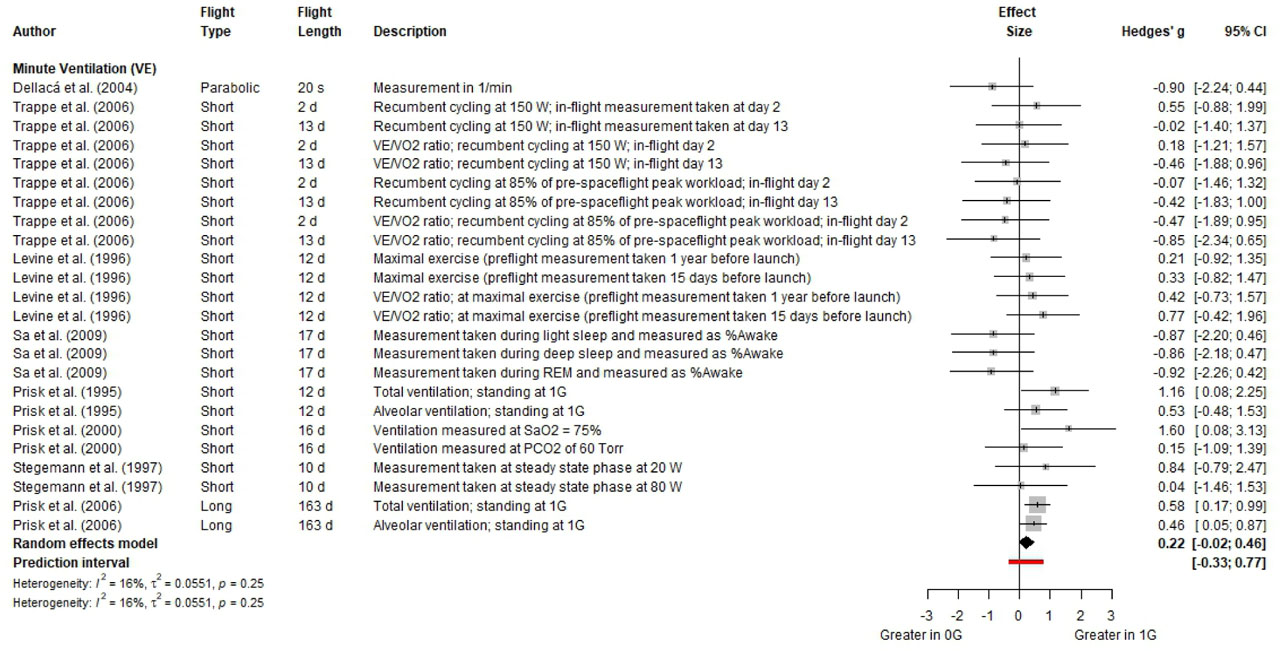
Figure 4.
Forest plot for minute ventilation in 0G compared to 1G (i.e., a right-ward shift indicated a larger measure in 1G). Effect sizes are reported as Hedge’s g with 95% confidence intervals.
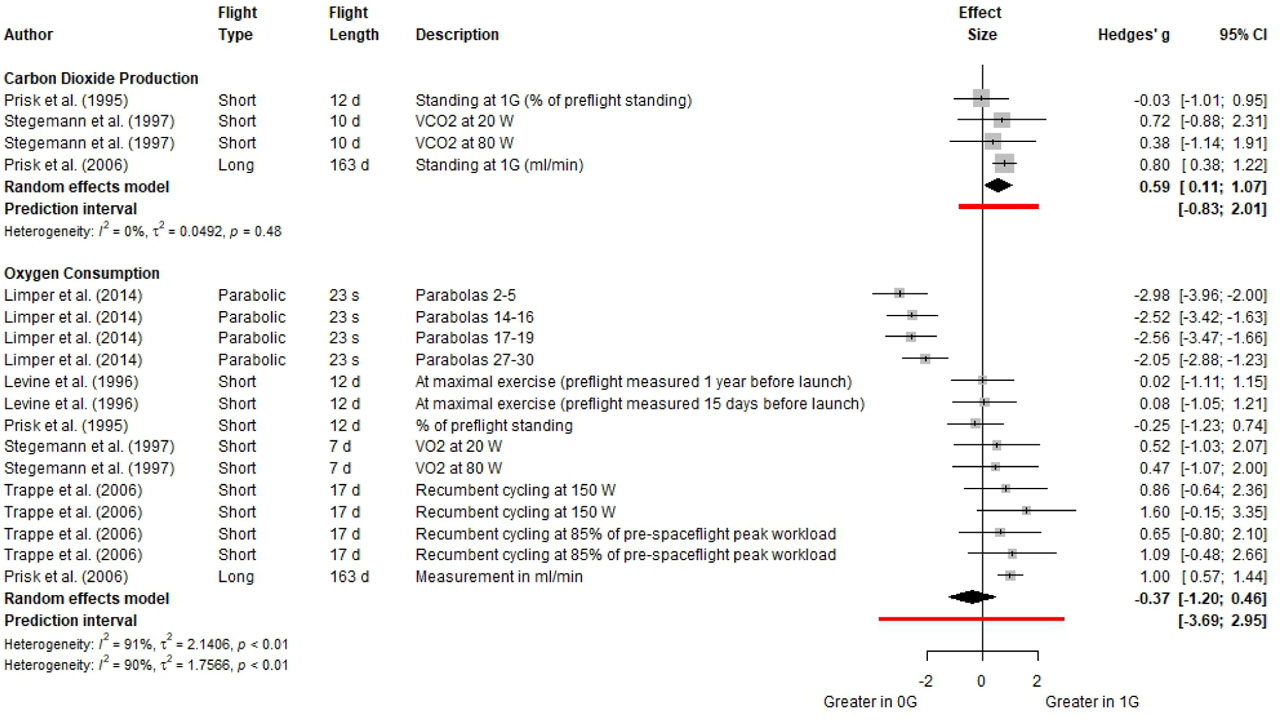
Figure 5.
Forest plot for parameters of pulmonary cellular respiration in 0G compared to 1G (i.e., a right-ward shift indicated a larger measure in 1G). Effect sizes are reported as Hedge’s g with 95% confidence intervals.
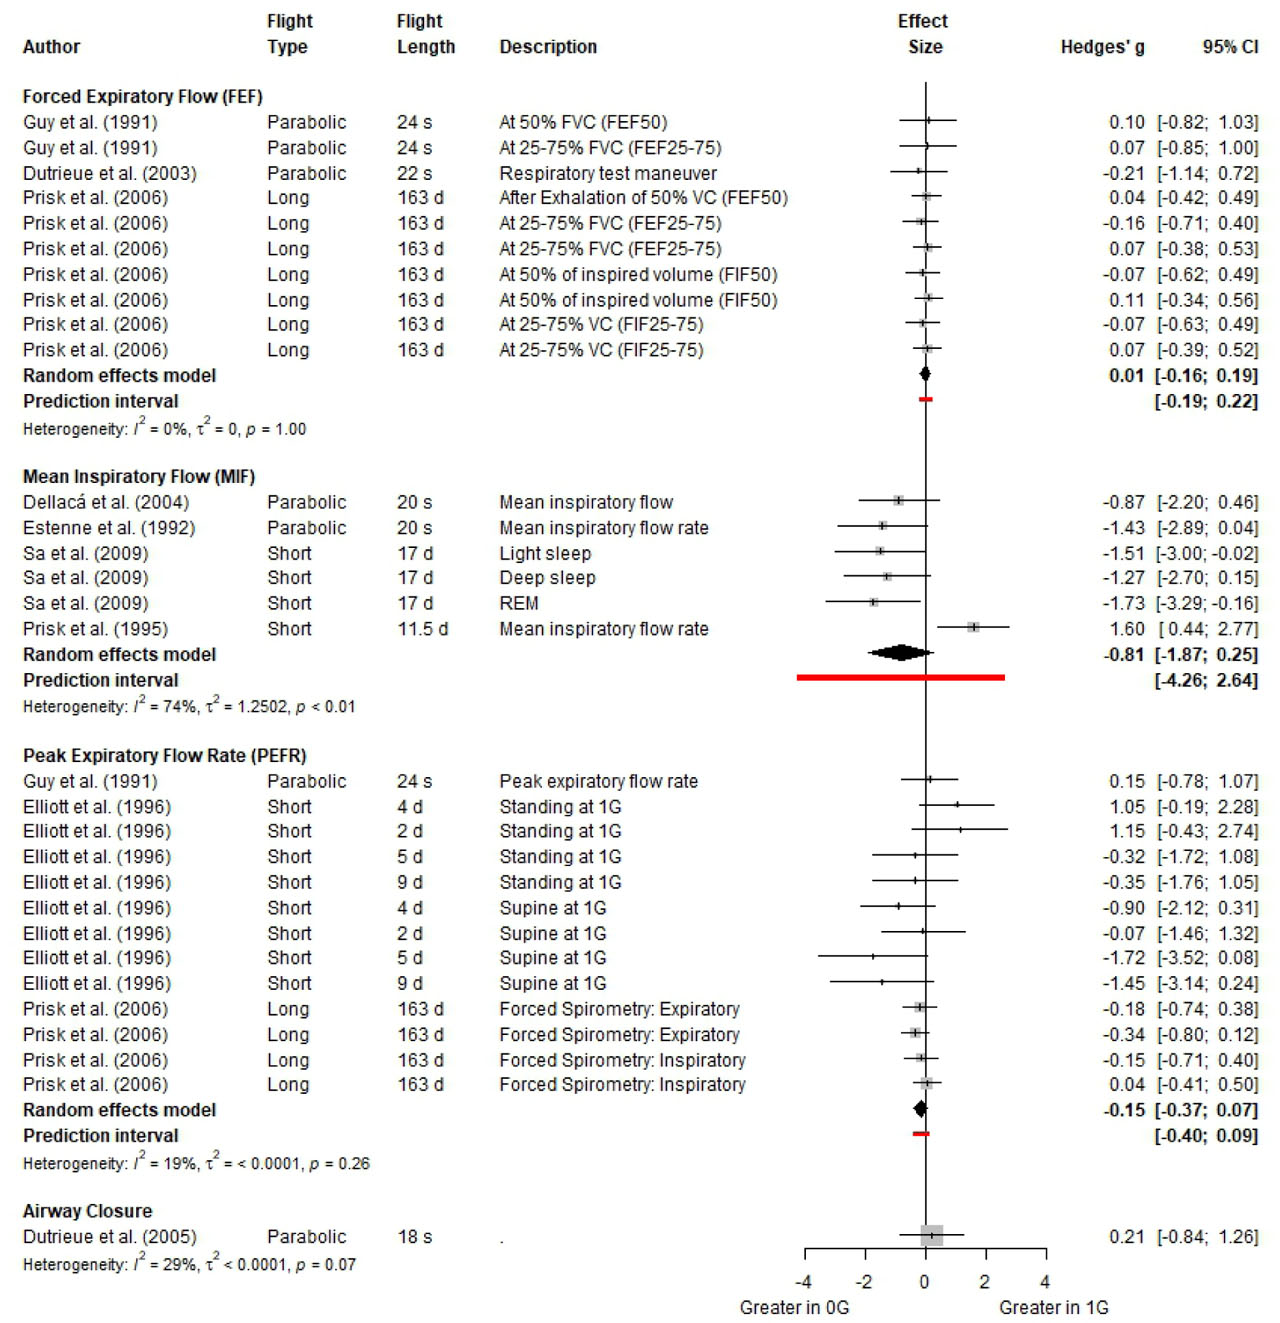
Figure 6.
Forest plot for parameters of pulmonary flow rates in 0G compared to 1G (i.e., a right-ward shift indicated a larger measure in 1G). Effect sizes are reported as Hedge’s g with 95% confidence intervals.
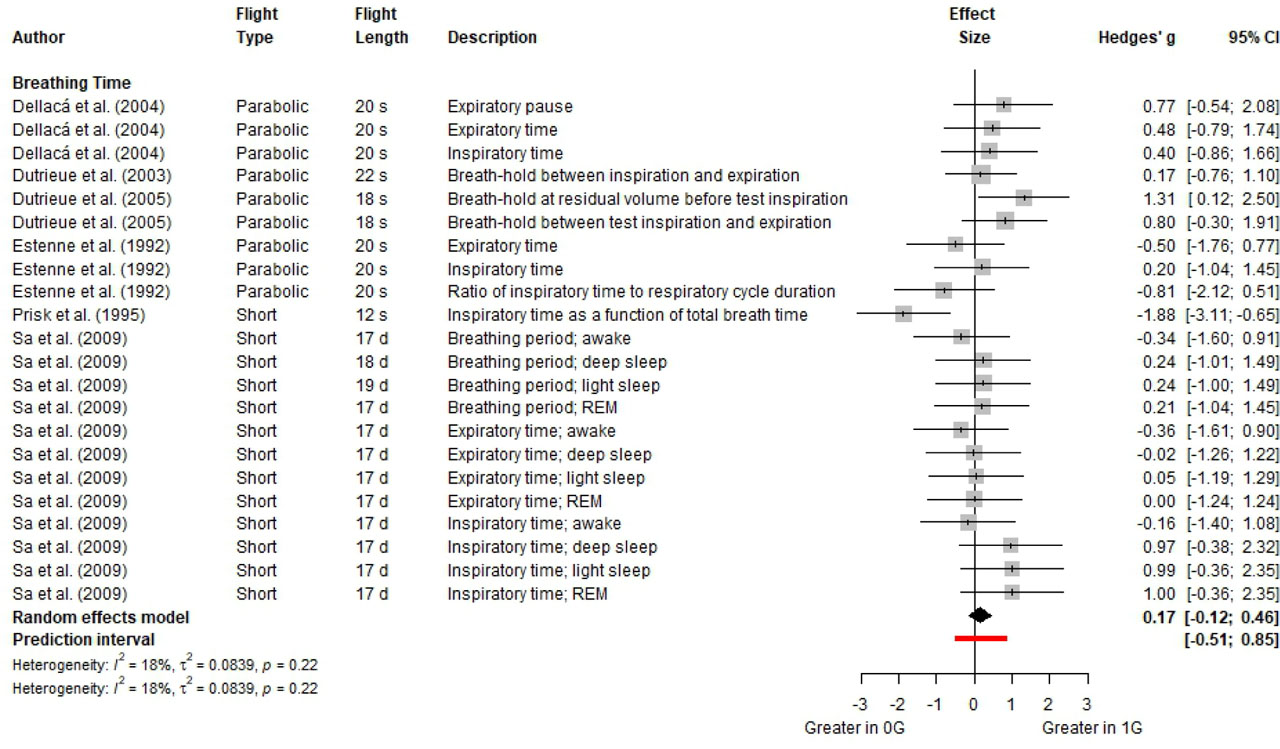
Figure 7.
Forest plot for breathing time in 0G compared to 1G (i.e., a right-ward shift indicated a larger measure in 1G). Effect sizes are reported as Hedge’s g with 95% confidence intervals.
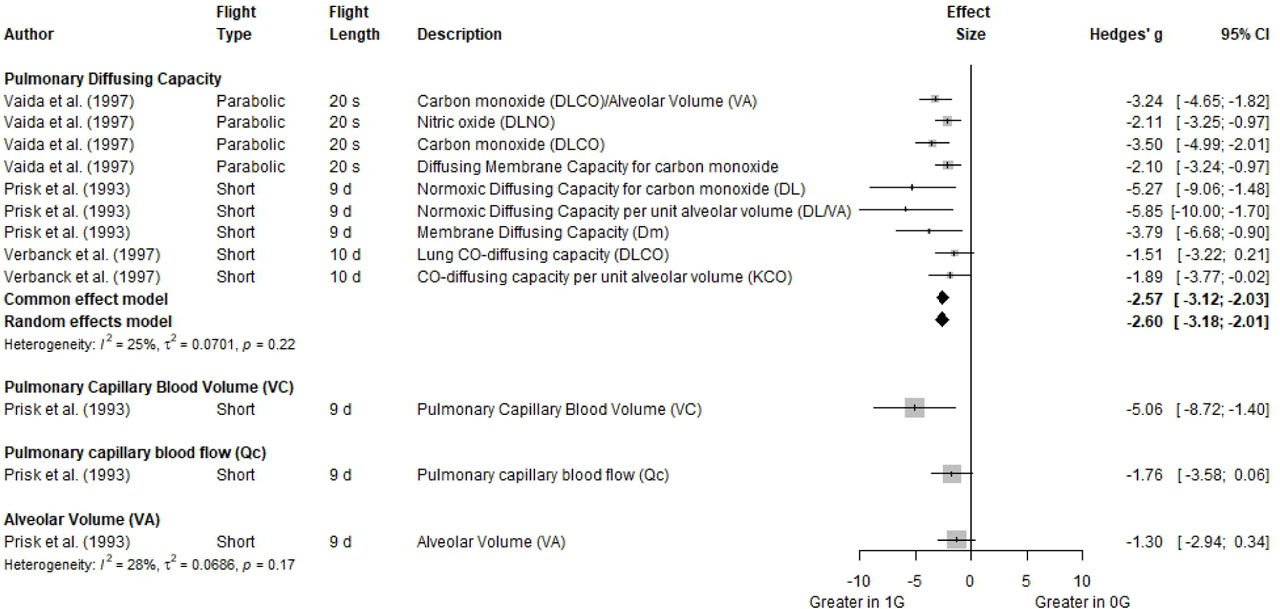
Figure 8.
Forest plot for pulmonary diffusing capacity in 0G compared to 1G (i.e., a right-ward shift indicated a larger measure in 1G). Effect sizes are reported as Hedge’s g with 95% confidence intervals.
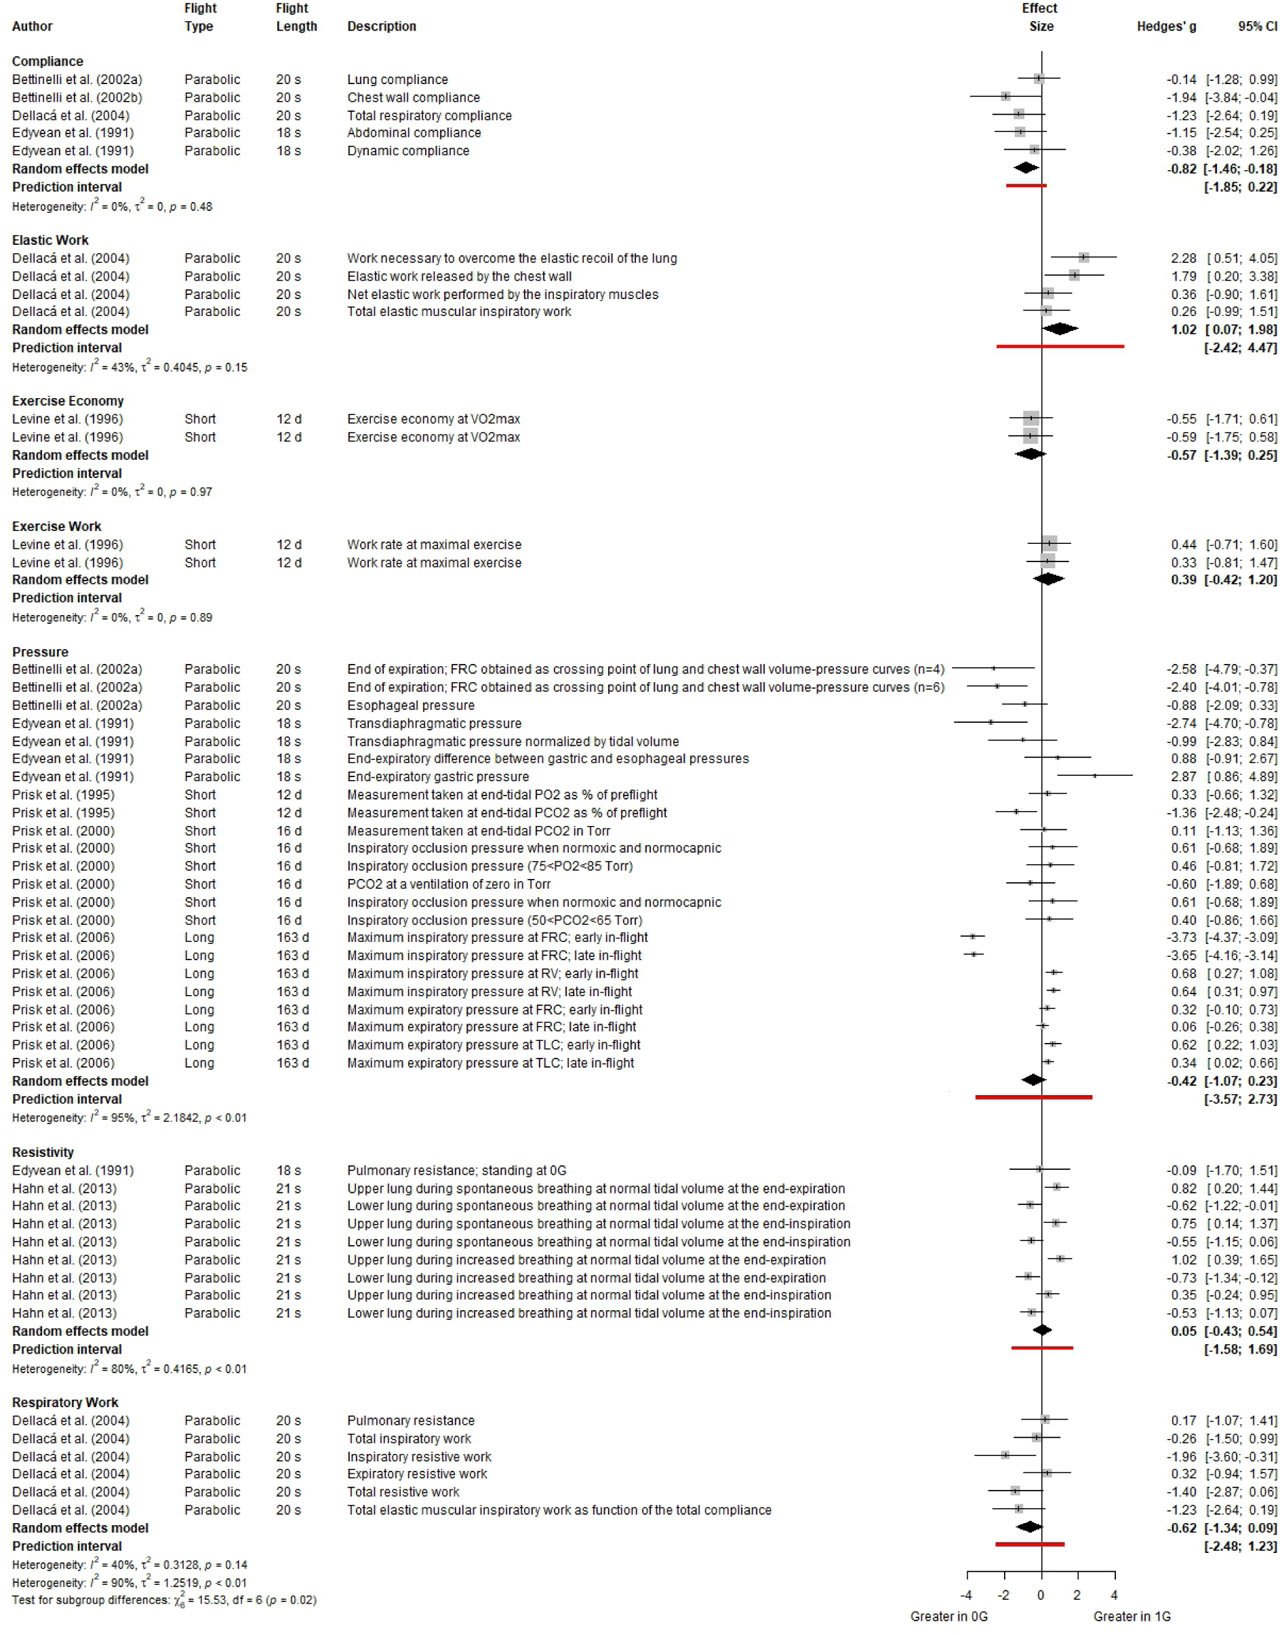
Figure 9.
Forest plot for pulmonary pressure, compliance, and resistance parameters in 0G compared to 1G (i.e., a right-ward shift indicated a larger measure in 1G). Effect sizes are reported as Hedge’s g with 95% confidence intervals.
Table 4.
Results of the meta-analysis for changes in pulmonary function outcome measures in microgravity, and between different time categories (i.e., parabolic, short, long) in microgravity.
| Parameter | Residual Het. | Effect of Microgravity | Effect of Time | |
|---|---|---|---|---|
| SMD (95% CI) | p-value | p-value | ||
| CO2 production | 0.3084 | 0.5622 (−0.0063, 1.1306) | 0.0526 | 0.1582 |
| O2 consumption | <0.0001 | −0.0927 (−1.1816, 0.9963) | 0.8676 | <.0001 |
| Respiratory Frequency | 0.0001 | −0.0152 (−0.5364, 0.506) | 0.9544 | 0.3242 |
| Pulmonary Diffusing Capacity | 0.1383 | −2.163 (−3.3896, −0.9364) | 0.0005 | 0.5730 |
| Minute Ventilation | 0.2065 | 0.227 (−0.2059, 0.6600) | 0.3041 | 0.1019 |
| Breathing Time | 0.0258 | −0.070 (−0.7533, 0.6133) | 0.8408 | 0.5350 |
| Compliance | 0.3256 | −0.8549 (−1.5946, −0.1152) | 0.0235 | N/A |
| Pressure | 0.2820 | −0.6487 (−0.9539, −0.3435) | <.0001 | 0.9617 |
| Resistivity | 0.9086 | −0.0058 (−0.5602, 0.5486) | 0.9835 | 0.9835 |
| FEF | 0.8955 | −0.0222 (−0.4115, 0.3672) | 0.9112 | 0.8860 |
| MIF | 0.0006 | −0.5258 (−2.0184, 0.9668) | 0.4899 | 0.4545 |
| PEFR | 0.8034 | −0.115 (−0.5273, 0.2972) | 0.5845 | 0.6251 |
Table S.1.
Search strategy.
| Search number | Term | Keywords in search format |
|---|---|---|
| 1 | Lung | exp Respiratory Dead Space/ or exp Respiratory Function Tests/ or exp Respiratory Mechanics/ or exp Respiratory Rate/ or exp Respiratory System/ or exp Respiratory Physiological Phenomena/ or exp Respiratory Muscles/ or exp lung/ or exp Diagnostic Techniques, Respiratory System/ or exp Pulmonary Ventilation/ or exp Ventilation-Perfusion Ratio/ or exp Pulmonary Gas Exchange/ or exp Respiration/ or exp Pulmonary Diffusing Capacity/ or Lung.ab. Or Pulmonary.ab. |
| 2 | Space | exp spaceflight/ or exp gravitation/ or exp Weightlessness/ or exp Astronauts/ or exp Spacecraft/ or exp Extraterrestrial Environment/ or Microgravity.ab. |
| 3 | Combined Search | 1 AND 2 |
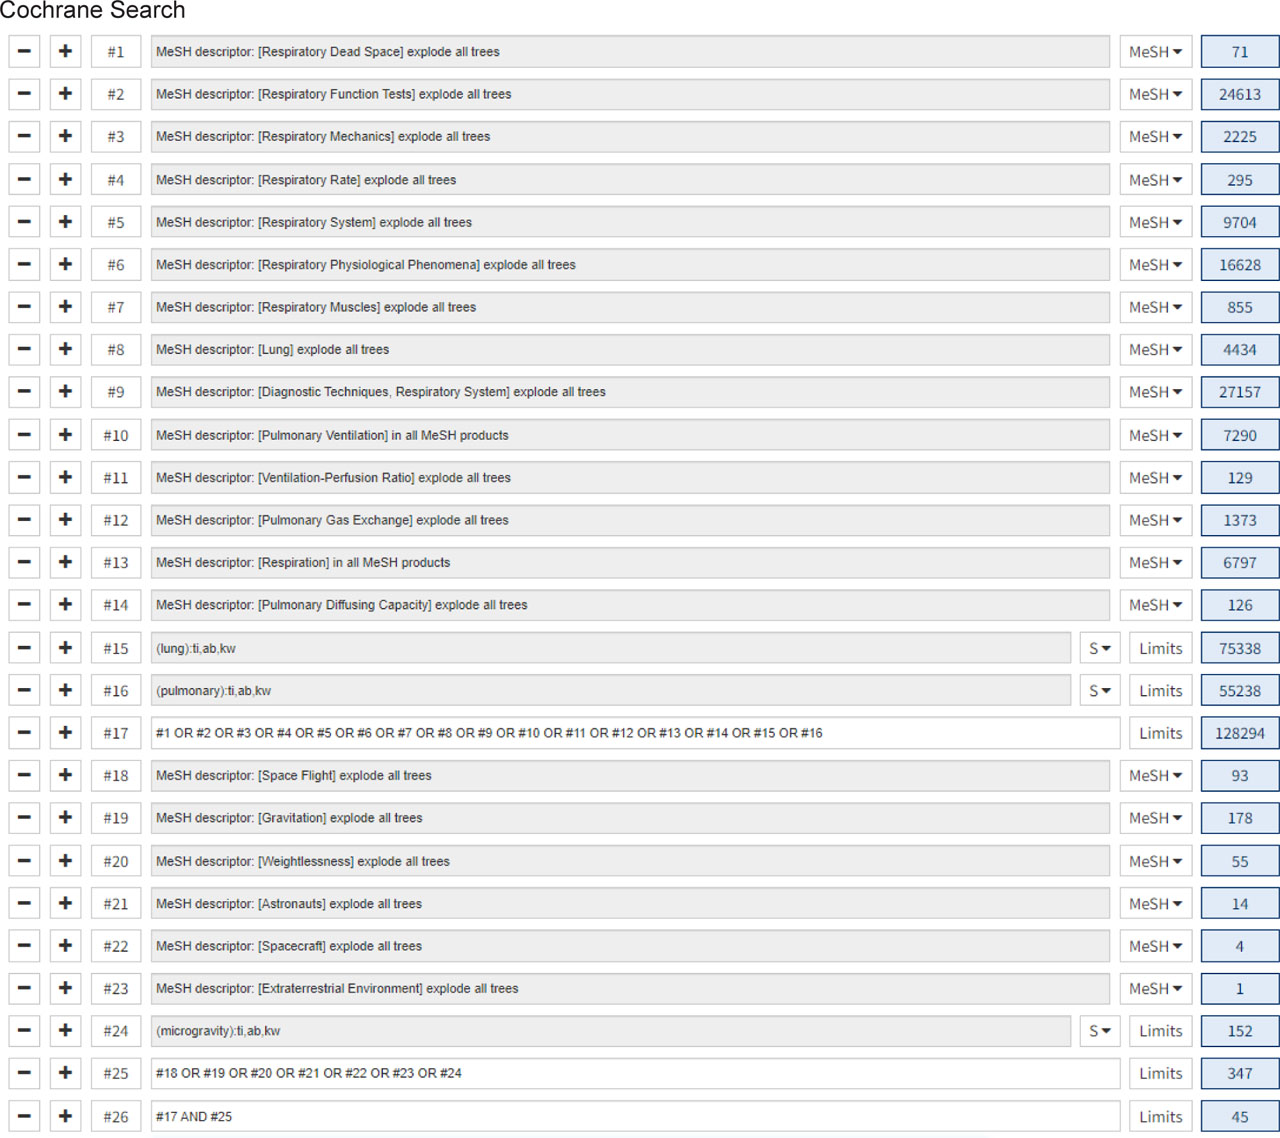
Figure S1.
Snapshot of Cochrane search strategy
| Section and Topic | Item # | Checklist item | Location where item is reported |
|---|---|---|---|
| TITLE | |||
| Title | 1 | Identify the report as a systematic review. | Included |
| ABSTRACT | |||
| Abstract | 2 | See the PRISMA 2020 for Abstracts checklist. | Seen and followed |
| INTRODUCTION | |||
| Rationale | 3 | Describe the rationale for the review in the context of existing knowledge. | Included |
| Objectives | 4 | Provide an explicit statement of the objective(s) or question(s) the review addresses. | Included |
| METHODS | |||
| Eligibility criteria | 5 | Specify the inclusion and exclusion criteria for the review and how studies were grouped for the syntheses. | Section 2.2 and 2.3 |
| Information sources | 6 | Specify all databases, registers, websites, organisations, reference lists and other sources searched or consulted to identify studies. Specify the date when each source was last searched or consulted. | Section 2.1 |
| Search strategy | 7 | Present the full search strategies for all databases, registers and websites, including any filters and limits used. | Section 2.1 and Supplementary Material |
| Selection process | 8 | Specify the methods used to decide whether a study met the inclusion criteria of the review, including how many reviewers screened each record and each report retrieved, whether they worked independently, and if applicable, details of automation tools used in the process. | Section 2.2 |
| Data collection process | 9 | Specify the methods used to collect data from reports, including how many reviewers collected data from each report, whether they worked independently, any processes for obtaining or confirming data from study investigators, and if applicable, details of automation tools used in the process. | Section 2.2 and 2.3 |
| Data items | 10a | List and define all outcomes for which data were sought. Specify whether all results that were compatible with each outcome domain in each study were sought (e.g. for all measures, time points, analyses), and if not, the methods used to decide which results to collect. | Section 2.3 and 2.4 |
| 10b | List and define all other variables for which data were sought (e.g. participant and intervention characteristics, funding sources). Describe any assumptions made about any missing or unclear information. | Section 2.3 and 2.4 | |
| Study risk of bias assessment | 11 | Specify the methods used to assess risk of bias in the included studies, including details of the tool(s) used, how many reviewers assessed each study and whether they worked independently, and if applicable, details of automation tools used in the process. | Section 2.2 |
| Effect measures | 12 | Specify for each outcome the effect measure(s) (e.g. risk ratio, mean difference) used in the synthesis or presentation of results. | Section 2.3 and 2.4 |
| Synthesis methods | 13a | Describe the processes used to decide which studies were eligible for each synthesis (e.g. tabulating the study intervention characteristics and comparing against the planned groups for each synthesis (item #5)). | Section 2.2 and 2.3 |
| 13b | Describe any methods required to prepare the data for presentation or synthesis, such as handling of missing summary statistics, or data conversions. | Section 2.4 | |
| 13c | Describe any methods used to tabulate or visually display results of individual studies and syntheses. | Section 2.3 | |
| 13d | Describe any methods used to synthesize results and provide a rationale for the choice(s). If meta-analysis was performed, describe the model(s), method(s) to identify the presence and extent of statistical heterogeneity, and software package(s) used. | Section 2.4 | |
| 13e | Describe any methods used to explore possible causes of heterogeneity among study results (e.g. subgroup analysis, meta-regression). | Section 2.4 | |
| 13f | Describe any sensitivity analyses conducted to assess robustness of the synthesized results. | Section 2.4 | |
| Reporting bias assessment | 14 | Describe any methods used to assess risk of bias due to missing results in a synthesis (arising from reporting biases). | Section 2.2 |
| Certainty assessment | 15 | Describe any methods used to assess certainty (or confidence) in the body of evidence for an outcome. | Section 2.4 |
| RESULTS | |||
| Study selection | 16a | Describe the results of the search and selection process, from the number of records identified in the search to the number of studies included in the review, ideally using a flow diagram. | Section 3.1 |
| 16b | Cite studies that might appear to meet the inclusion criteria, but which were excluded, and explain why they were excluded. | Section 3.1 | |
| Study characteristics | 17 | Cite each included study and present its characteristics. | Section 3.1 |
| Risk of bias in studies | 18 | Present assessments of risk of bias for each included study. | Section 3.2 |
| Results of individual studies | 19 | For all outcomes, present, for each study: (a) summary statistics for each group (where appropriate) and (b) an effect estimate and its precision (e.g. confidence/credible interval), ideally using structured tables or plots. | Section 3.3 |
| Results of syntheses | 20a | For each synthesis, briefly summarise the characteristics and risk of bias among contributing studies. | Section 3.2 |
| 20b | Present results of all statistical syntheses conducted. If meta-analysis was done, present for each the summary estimate and its precision (e.g. confidence/credible interval) and measures of statistical heterogeneity. If comparing groups, describe the direction of the effect. | Section 3.3 | |
| 20c | Present results of all investigations of possible causes of heterogeneity among study results. | Section 3.3 | |
| 20d | Present results of all sensitivity analyses conducted to assess the robustness of the synthesized results. | Section 3.3 | |
| Reporting biases | 21 | Present assessments of risk of bias due to missing results (arising from reporting biases) for each synthesis assessed. | Section 3.3 |
| Certainty of evidence | 22 | Present assessments of certainty (or confidence) in the body of evidence for each outcome assessed. | Section 3.3 |
| DISCUSSION | |||
| Discussion | 23a | Provide a general interpretation of the results in the context of other evidence. | Section 4.1 |
| 23b | Discuss any limitations of the evidence included in the review. | Section 4.2 | |
| 23c | Discuss any limitations of the review processes used. | Section 4.2 | |
| 23d | Discuss implications of the results for practice, policy, and future research. | Section 4.3 | |
| OTHER INFORMATION | |||
| Registration and protocol | 24a | Provide registration information for the review, including register name and registration number, or state that the review was not registered. | Review was not registered |
| 24b | Indicate where the review protocol can be accessed, or state that a protocol was not prepared. | Protocol was not prepared | |
| 24c | Describe and explain any amendments to information provided at registration or in the protocol. | N/A | |
| Support | 25 | Describe sources of financial or non-financial support for the review, and the role of the funders or sponsors in the review. | Included in ‘Funding’ section |
| Competing interests | 26 | Declare any competing interests of review authors. | Included in ‘Declaration of competing interest’ |
| Availability of data, code and other materials | 27 | Report which of the following are publicly available and where they can be found: template data collection forms; data extracted from included studies; data used for all analyses; analytic code; any other materials used in the review. | Included in ‘Data statement’ |
[i] From: Page MJ, McKenzie JE, Bossuyt PM, Boutron I, Hoffmann TC, Mulrow CD, et al. The PRISMA 2020 statement: an updated guideline for reporting systematic reviews. BMJ 2021;372:n71. doi: 10.1136/bmj.n71
[ii] For more information, visit: http://www.prisma-statement.org/