
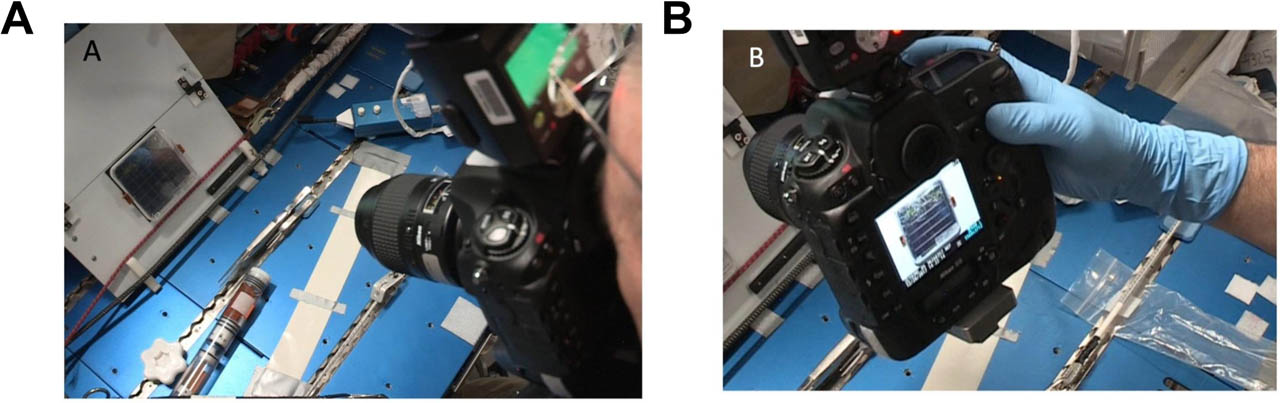
Figure 1.
Hand-held crew photography of plant seedlings at the Maintenance Work Area. (A) Astronaut Scott Tingle photographs Arabidopsis seedlings growing in 10 cm Petri dishes as part of APEX-05 experiment during ISS Expedition 54. (B) Checking the point of capture image quality is often limited to viewing on the internal screen of the digital SLR camera.
Table 1.
High-Level Python Packages Used.
| Package Name | Distribution Name | Version | Function |
|---|---|---|---|
| Streamlit | streamlit | 1.19.0 | Create and process front-end inputs, web server. |
| PlantCV | plantcv | 3.14.2 | High-level processing and phenotypic analysis functions. |
| OpenCV | opencv-contrib-python-headless | 4.6.0.66 | Dependency for PlantCV, use for high-level image array manipulation and community ArUco marker detection functionality. |
| NumPy | numpy | 1.21.0 | Basic handling of images and color channels as arrays. |
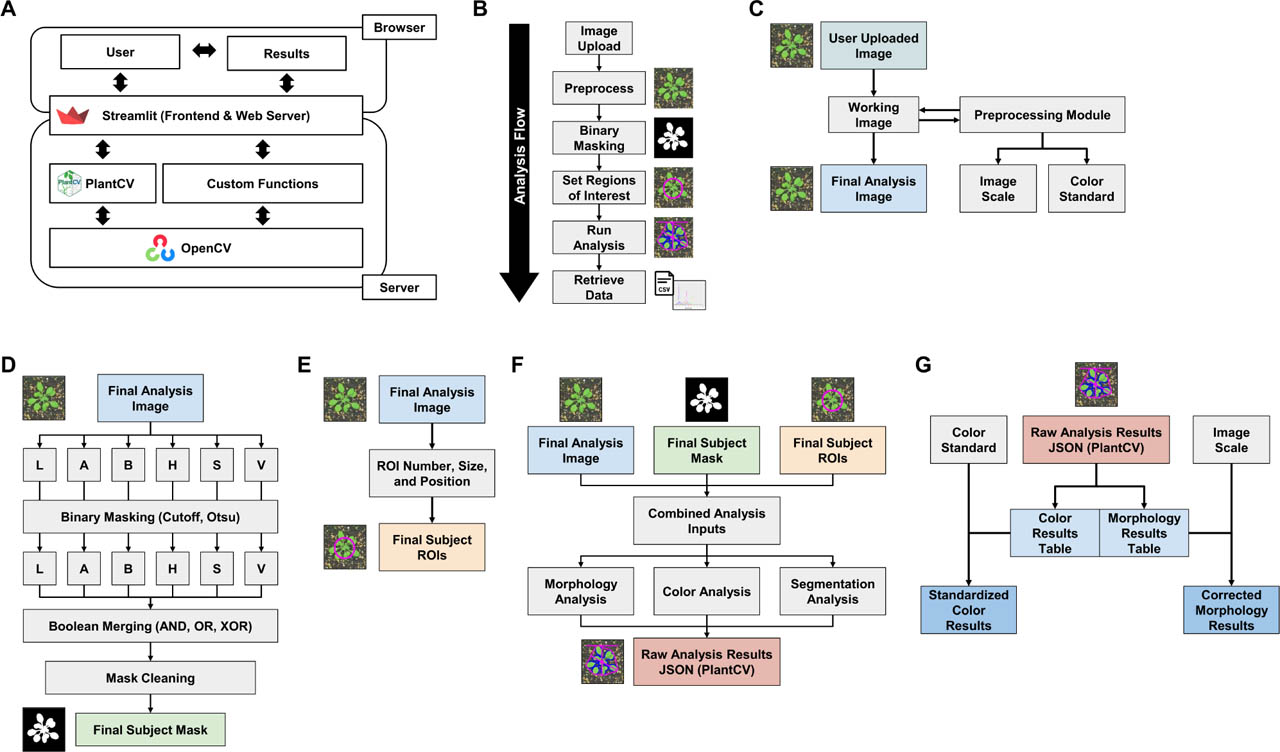
Figure 2.
Diagram of package flow. Users upload images to and adjust parameters for SOAPP in the browser using the Streamlit-generated and served front end. Data is analyzed by SOAPP using these parameters on the server through the Streamlit web server, which executes both PlantCV and custom functions implemented using OpenCV. (A) Overview of software architecture and packages used. (B) Overview of image analysis steps. (C) Overview of upload and preprocess operation flow. (D) Diagram of plant masking operation procedure. (E) Process for definition of regions of interest within the image. (F) Overview of analysis inputs and workflow. (G) Data output compilation and presentation process.
Table 2.
Preprocessing Modules.
| Module Name | Module Function |
|---|---|
| Astrobotany Sticker - Color Correction | Perform histogram white balancing color correction based on the Astrobotany Sticker. |
| Astrobotany Sticker - Color Reference | Measure color references from an Astrobotany Sticker and use it in downstream data processing. |
| Astrobotany Sticker - Frame Correct | Use the Astrobotany Sticker to keystone correct the image. |
| Astrobotany Sticker - Scale | Measure image scale from Astrobotany Sticker and use in downstream data processing. |
| Astrobotany Sticker - Show Marker | Confirm and visualize Astrobotany Sticker detection. |
| Crop Image | Crop image horizontally and vertically by defined amount. |
| Keystone Correction | Keystone correct image based on manually defined coordinates. |
| Marker Frame Adjust | Use ArUco markers in rectangular 1:3 format to automatically keystone correct images based on user defined methods. |
| Marker Scale Finder | Measure image scale from ArUco markers based on user-input size. |
| Rotate Image | Rotate image by 90-degree increments. |
| Set Color Standard | Manually set red, green, and blue color reference values for downstream data processing. |
| Set Image Scale | Manually define image scale for downstream data processing. |
Table 3.
Vegetative Indices Calculated by SOAPP.
| Name | Abbreviation | Name in SOAPP | Formula | Reference |
|---|---|---|---|---|
| Green Index | GI | index_GI | [(255-∣G-165∣ + 255-∣R-37.5∣ + 255-∣B-37.5∣) / (3*255)] / 12 * (1-[(255-∣G-165∣ + 255-∣R-37.5∣ + 255-∣B-37.5∣) / (3*255)]) | Signorelli et al., 2023 |
| Green Leaf Index | GLI | index_GLI | [(2*G)-R-B] / [(2*G)+R-B] | Louhaichi et al., 2001 |
| Normalized Difference Anthocyanin Index | NDAI | index_NDAI | (R-G) / (R+G) | Kim & van Iersel, 2023 |
| Red Reflectance | Rr | index_Rr | R / (R + G + B) | N/A |
| Green Reflectance | Rg | index_Rg | G / (R + G + B) | N/A |
| Blue Reflectance | Rb | index_Rb | B / (R + G + B) | N/A |
| Green Red Vegetation Index | GRVI | index_GRVI | (Rg - Rr) / (Rg + Rr) | Tucker, 1979 |
| Modified Green Red Vegetation Index | MGRVI | index_MGRVI | (Rg^2 - Rr^2) / (Rg^2 + Rr^2) | Bendig et al., 2015 |
| Red Green Blue Vegetation Index | RGBVI | index_RGBVI | [Rg^2 - (Rb*Rr)] / [Rg + (Rb*Rr)] | Bendig et al., 2015 |
| Visible Atmospherically Resistant Index | VARIgreen | index_VARIgreen | (Rg - Rr) / (Rg+Rr+Rb) | Gitelson et al., 2002 |
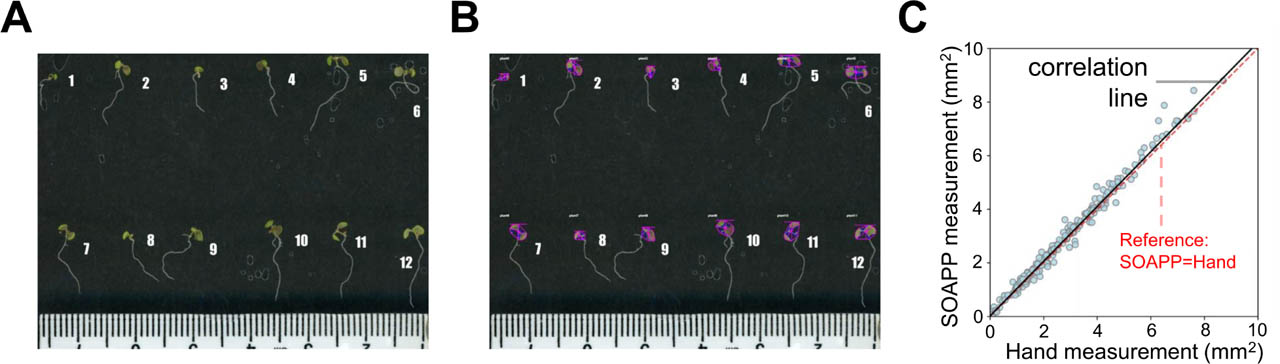
Figure 3.
Comparison of hand and SOAPP measurements on plate-grown Arabidopsis foliage. (A) Representative image from Arabidopsis thaliana image dataset. (B) Analyzed image from image dataset. (C) Comparison of hand area measure and SOAPP-produced area measurement.
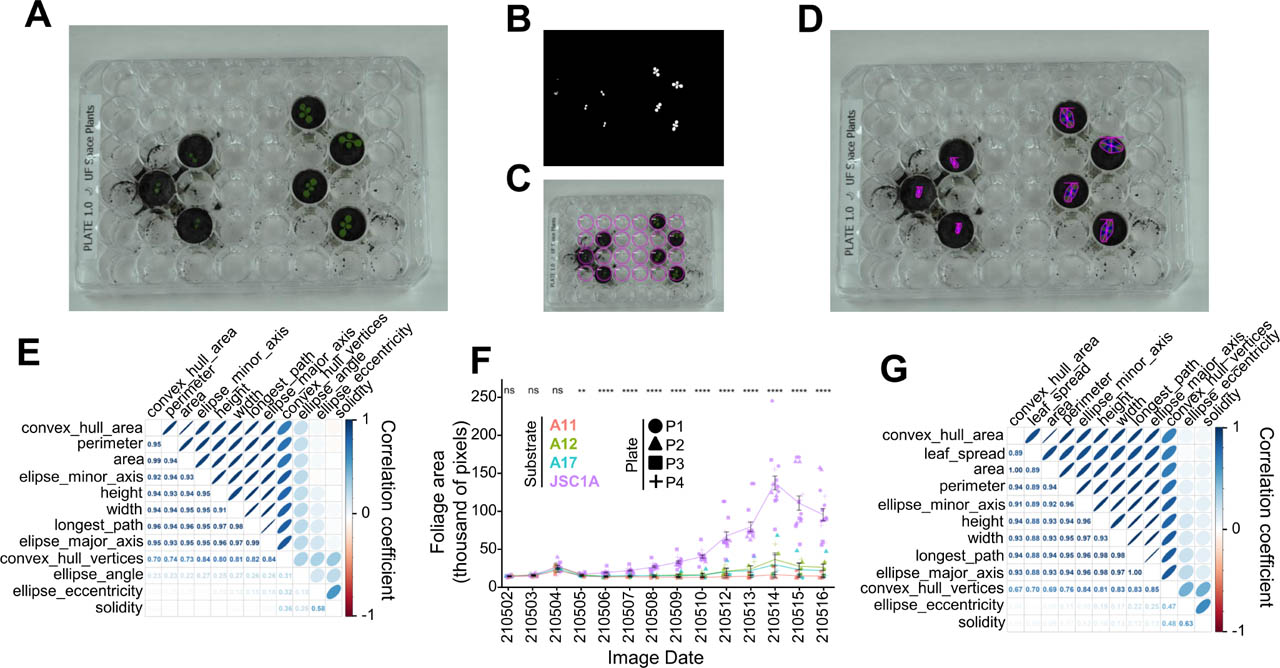
Figure 4.
Analysis of Arabidopsis thaliana grown on lunar regolith from image dataset OSD-476. (A) Representative image of the dataset. (B) Mask produced with SOAPP. (C) Region of interest layout of SOAPP image analysis. (D) Analysis output image produced by SOAPP. (E) Correlation plot of parameters extracted from analyzed morphological images. Ellipse shape and color indicate correlation coefficient values. (F) Green pixel leaf area of plants over image dataset time course. Line and error bars indicate substrate-wise mean and standard error respectively. ns, not significantly different; **, p<0.01; ****, p<0.0001, One-way ANOVA with Tukey Post-Hoc. (G) Correlation plot of plate-wise mean SOAPP values and hand measurement “leaf_spread”. Images from OSD-476 (https://osdr.nasa.gov/bio/repo/data/studies/OSD-476) from original work reported in Paul et al. (2022). A11, A12, A17, Plants grown in regolith returned by the crews of Apollo 11, 12 and 17 respectively; JSC1A, plants grown in lunar regolith simulant JSC1A; P1–P4, samples taken from replicate plants grown in the wells of plates 1–4.
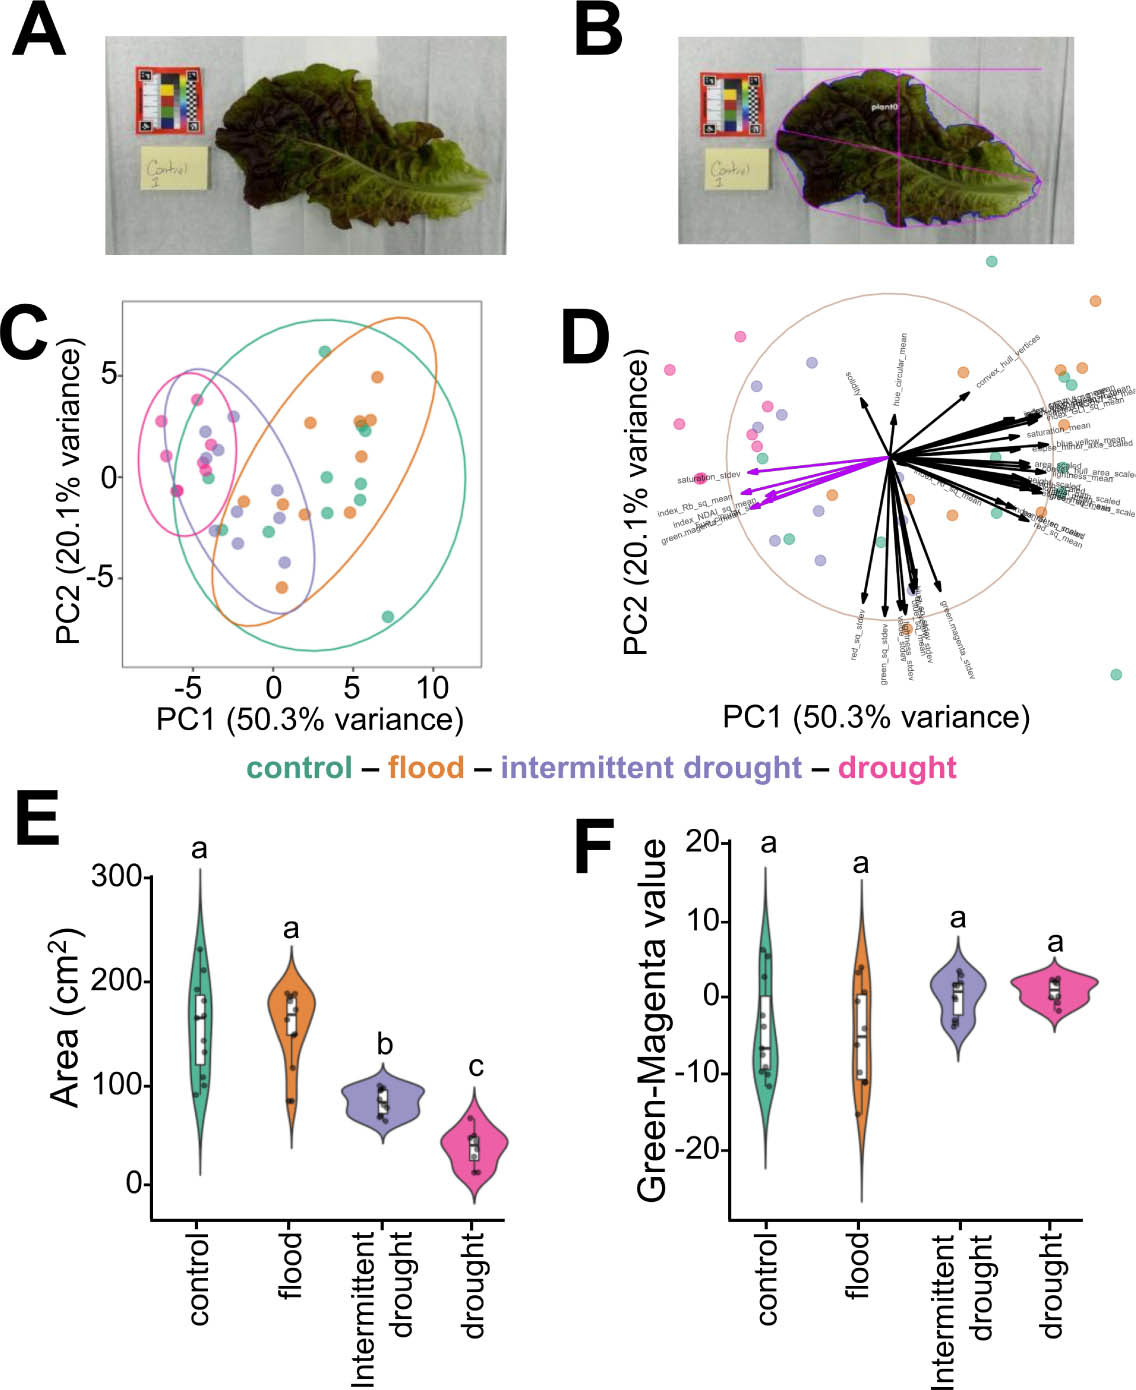
Figure 5.
Analysis of lettuce leaves grown under variable watering regimens. (A) Representative image of collected image dataset from harvested lettuce leaves. (B) Analysis image output of representative image. (C) Principal Component plot of color and morphology with ellipse indicators of 90% confidence intervals. (D) Principal Component Biplot of color and morphology. Length of lines represent the degree of contribution of each variable to each Principal Component. Purple vector lines reflect parameters: saturation_stdev, index_Rb_sq_mean, index_NDAI_sq_mean, hue_circular_stdev, green.magenta_mean. (E) Leaf area values observed among watering regime plants. (F) Green-Magenta color axis values among leaves harvested across watering regime-grown plants. Bars sharing the same letter are not significantly different one-way ANOVA and by Tukey's HSD (p=0.05).
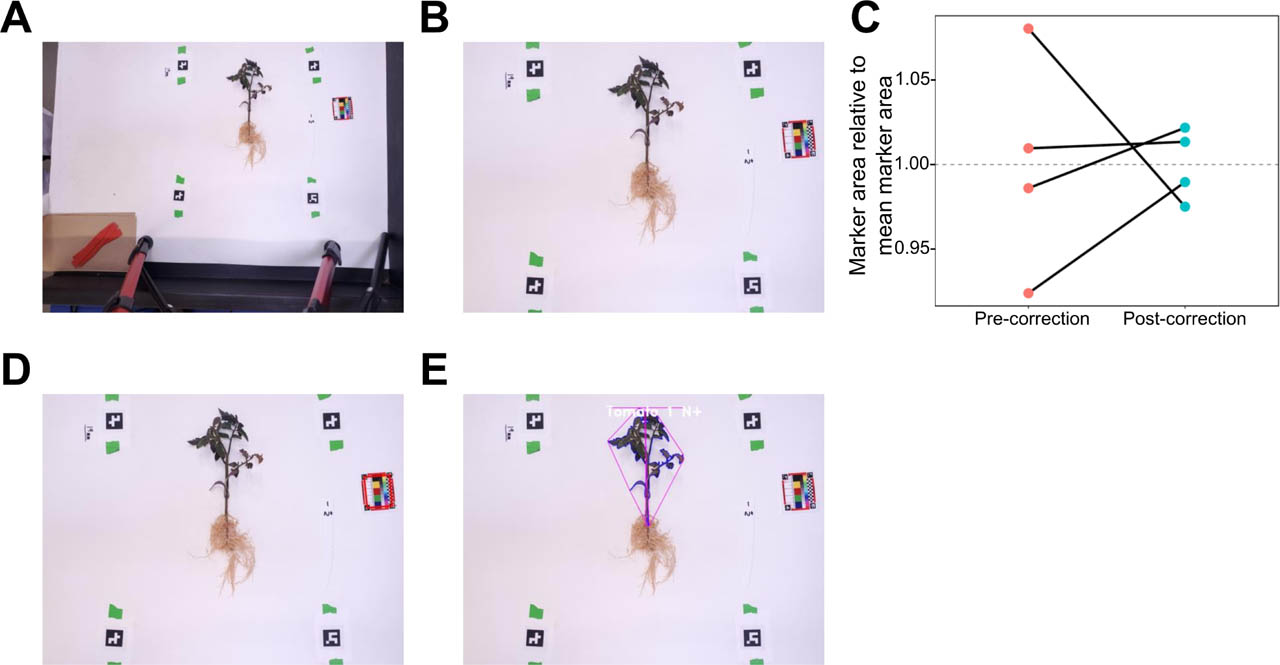
Figure 6.
Demonstration of marker-based frame correction and astrobotany sticker. (A) Original image of tomato plant on white background with markers in a perfect square orientation with 3:1 marker identity. (B) Post-marker-based keystone corrected image using the correction method “SQUARE” and an inset value of 300 pixels, maintaining the original image resolution. (C) Marker size relative to the mean size of four markers before and after correction. (D) Corrected image with Astrobotany sticker positively recognized for automated use as a scale and color standard. (E) SOAPP-analyzed, corrected image.