
Introduction
Plant phenomics, the analysis of plant images, represents a powerful, non-invasive method to elucidate how plants function under diverse conditions. Numerous measurement systems are employed in imaging-based studies, including information-rich techniques such as hyperspectral imaging, 3D tomography, and infrared and fluorescence imaging (reviewed in Saríc et al., 2022; Abebe et al., 2023; and Li et al., 2014). However, for spaceflight experimentation on plants, e.g., growing on the International Space Station (ISS), the principal imaging modality is often crew-performed digital photography illuminated by either a camera flash or ambient lighting. Some spaceflight hardware, such as the Advanced Plant Habitat (APH), incorporated integral cameras that could take highly reproducible images over time (Monje et al., 2020). However, in many instances of crew-tended work, the available option is hand-held crew photography utilizing equipment such as digital SLR cameras. Images of samples are taken either in situ in their growth chamber, or of samples removed and placed, e.g., on a custom-built photo-grid often mounted in the Maintenance Work Area (Figure 1). Crews are extensively trained to capture high-quality photographs.
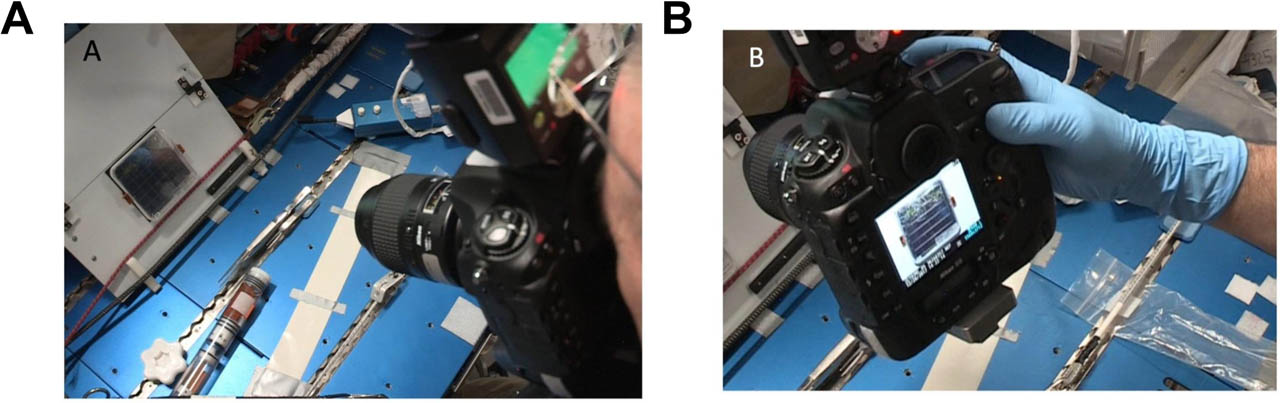
Figure 1.
Hand-held crew photography of plant seedlings at the Maintenance Work Area. (A) Astronaut Scott Tingle photographs Arabidopsis seedlings growing in 10 cm Petri dishes as part of APEX-05 experiment during ISS Expedition 54. (B) Checking the point of capture image quality is often limited to viewing on the internal screen of the digital SLR camera.
Nonetheless, inevitable variations in lighting and image orientation can make the extraction of quantitative data from the resulting images complex and time-consuming. In addition, the realities of the imaging locale and the hand-held equipment means that positioning the camera both at a precise distance and angle from the face of the sample (to set a defined magnification and prevent image distortion) is unrealistic. Thus, although they are inherently information rich, a challenge to analyzing these kinds of images from spaceflight experiments is in defining and correcting for these effects.
Modern phenomics tools use computer vision to automate such post-image capture measurement processes, reducing the overall time to generate datasets and (critically) removing researcher subjectivity to the quantification of traits. For example, such tools have been employed in applications as varied as understanding how genetics and drought interact to determine seed traits in rice (Marrano et al., 2022) or following the development of root disease in beans (Pierz et al., 2023), to the automated imaging of duckweed growth (Cox et al., 2022). However, these phenomics tools often require prior knowledge of key data features or data requirements, such as defined image quality, that are established during software development. There can also be complex installation processes and/or required licenses for use of the software. NASA's Open-Source Science Initiative (OSSI; science.nasa.gov/open-science/) envisions approaches to analyzing spaceflight data that are freely open and accessible to scientists, educators, students, and citizen scientists alike. A suite of standardized, open-source, easy to use image analysis tools would be an important step towards this goal. To reduce the barriers to analyzing plant spaceflight image data, we have therefore leveraged two open-source Python packages, PlantCV (Gehan et al., 2017) and OpenCV (Bradski, 2000), to develop a web-based application called Simple Online Automated Plant Phenomics (SOAPP). The elements comprising SOAPP and its package dependencies are presented in Table 1.
Table 1.
High-Level Python Packages Used.
| Package Name | Distribution Name | Version | Function |
|---|---|---|---|
| Streamlit | streamlit | 1.19.0 | Create and process front-end inputs, web server. |
| PlantCV | plantcv | 3.14.2 | High-level processing and phenotypic analysis functions. |
| OpenCV | opencv-contrib-python-headless | 4.6.0.66 | Dependency for PlantCV, use for high-level image array manipulation and community ArUco marker detection functionality. |
| NumPy | numpy | 1.21.0 | Basic handling of images and color channels as arrays. |
OpenCV is a library of open-source computer vision algorithms maintained by the Open Source Vision Foundation (OpenCV.org). PlantCV is an open-source extension package to OpenCV developed specifically for plant phenotyping and is managed through the Donald Danforth Plant Science Center (plantcv.danforthcenter.org). Both provide modular software architectures that allow functionalities to be combined to build flexible image analysis workflows. SOAPP utilizes these capabilities to automatically quantify plant aerial phenotypes from user-uploaded images. It is an open-source application that requires no programming experience and is freely accessible at https://github.com/lvbauer/soapp. SOAPP specifically addresses some of the major challenges in analyses of spaceflight imaging data arising from the often-variable background lighting environment and image-to-image differences in camera angle and distance inherent in hand-held crew photography. SOAPP also provides a highly accessible, standardized analysis output, facilitating comparisons between images from disparate plant spaceflight experiments. In this paper, we describe SOAPP's implementation, use, and capabilities. SOAPP's open-source nature has already allowed an initial assessment of accuracy with Arabidopsis seedling growth (Hughes et al., 2025) and we now extend this validation with analyses of both legacy data as well as phenomics on multiple species.
Methods
Goals and summary of application architecture
The goal of developing SOAPP was to implement a user-friendly Streamlit (www.streamlit.io) web application interface for creating both single-measurement and high-throughput phenomics analysis pipelines for the aerial tissue in plant images based on PlantCV and OpenCV functionality (Fig. 2A). It is important to note that this software is designed primarily to support analysis of aerial tissues. Quantifying root system phenotypes introduces an additional set of challenges, with the roots often embedded in opaque substrates that make analyses difficult. When root systems are visible, accurately mapping their highly branched architectures and distinguishing individual features within dense, often overlapping root structures presents a complex analytical problem. The latter challenge is particularly pronounced in spaceflight-grown samples, where constrained growth volumes and the absence of gravitropic cues can cause the root systems of neighboring plants to intermingle after only a few days of growth. Fortunately, image analysis tools that effectively quantify root phenotypes such as RhizoVision Explorer (Seethepalli et al., 2021), faRIA (Narisetti et al., 2021), and RootNav 2.0 (Yasrab et al., 2019) have already been developed. SOAPP is designed to provide complementary data on shoot growth and development.
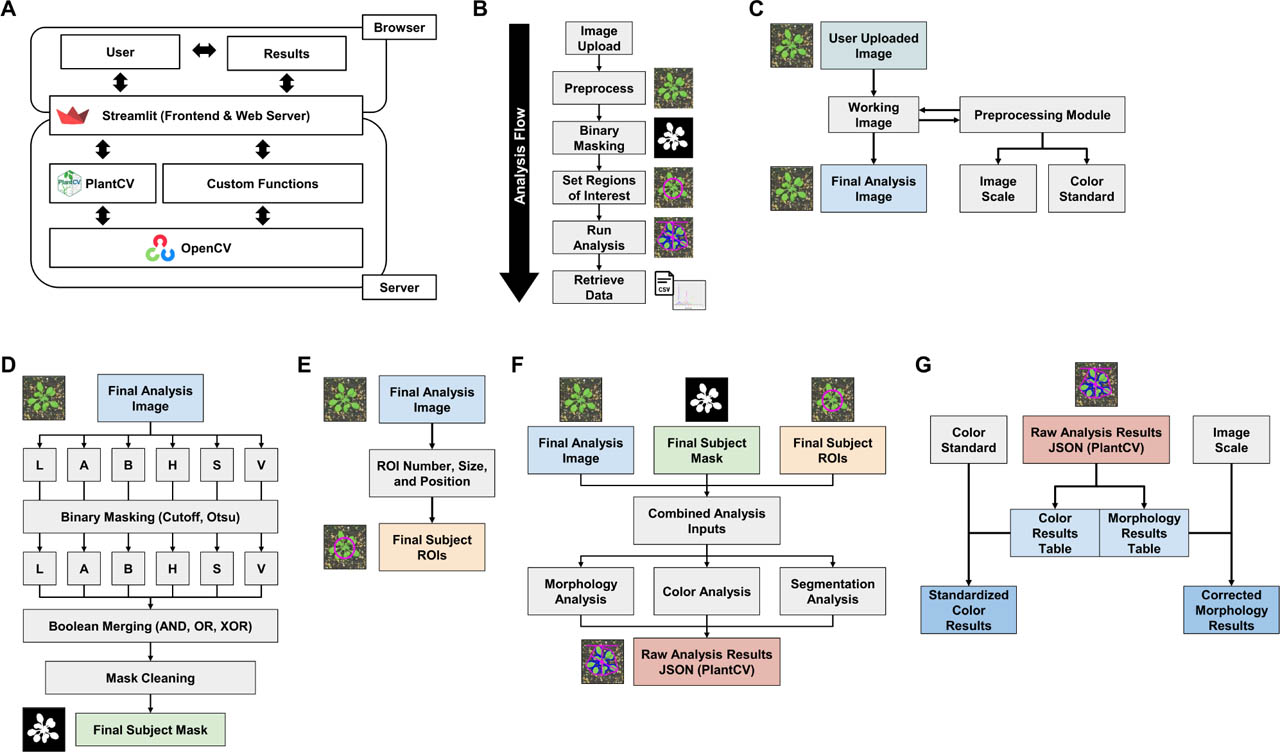
Figure 2.
Diagram of package flow. Users upload images to and adjust parameters for SOAPP in the browser using the Streamlit-generated and served front end. Data is analyzed by SOAPP using these parameters on the server through the Streamlit web server, which executes both PlantCV and custom functions implemented using OpenCV. (A) Overview of software architecture and packages used. (B) Overview of image analysis steps. (C) Overview of upload and preprocess operation flow. (D) Diagram of plant masking operation procedure. (E) Process for definition of regions of interest within the image. (F) Overview of analysis inputs and workflow. (G) Data output compilation and presentation process.
Overview of Using SOAPP
To build an analysis pipeline, users upload images to SOAPP and manually define measurement parameters for the first image. Once the first image is measured, the image analysis workflow can be automatically repeated on a set of user-uploaded images.
To guide users through the phenomics configuration process, SOAPP defines five steps in the phenomics process: (i) preprocessing, (ii) masking, (iii) defining regions of interest, (iv) image analysis, and (v) data retrieval (Fig. 2B). An additional optional step, that of high-throughput, allows the user to apply the analysis pipeline established in steps 1–5 to a series of images currently uploaded to SOAPP. Images with three (red, green, and blue) 8-bit color channels (24 bit-color), formatted as a Portable Network Graphic (PNG), Tagged Image File Format (TIFF), or Joint Photographic Experts Group format (JPEG) image files can be uploaded to SOAPP as the input data, regardless of original source.
(i). Preprocessing Images
SOAPP implements a modular and extensible image preprocessing system that enables user-directed, sequential application of discrete preprocessing modules through an intuitive interface (Fig. 2C). These modules include standard image formatting tools such as cropping to remove unwanted regions and image rotation, as well as application-specific functions like keystone correction for perspective distortions, color correction and standardization methods, and both manual and automated scale determination methods. All currently available preprocessing modules are listed in Table 2. The standardized structure of these modules facilitates easy development and integration of additional tools, making the system both flexible and customizable. This comprehensive and user-friendly approach ensures images are properly prepared for downstream phenotypic analysis, enhancing accuracy and supporting SOAPP's mission as an open-source solution for plant phenomics. The modular design of the preprocessing workflow architecture enables future expansion of preprocessing tools, such as camera lens distortion correction and defect-specific noise adjustments.
Table 2.
Preprocessing Modules.
| Module Name | Module Function |
|---|---|
| Astrobotany Sticker - Color Correction | Perform histogram white balancing color correction based on the Astrobotany Sticker. |
| Astrobotany Sticker - Color Reference | Measure color references from an Astrobotany Sticker and use it in downstream data processing. |
| Astrobotany Sticker - Frame Correct | Use the Astrobotany Sticker to keystone correct the image. |
| Astrobotany Sticker - Scale | Measure image scale from Astrobotany Sticker and use in downstream data processing. |
| Astrobotany Sticker - Show Marker | Confirm and visualize Astrobotany Sticker detection. |
| Crop Image | Crop image horizontally and vertically by defined amount. |
| Keystone Correction | Keystone correct image based on manually defined coordinates. |
| Marker Frame Adjust | Use ArUco markers in rectangular 1:3 format to automatically keystone correct images based on user defined methods. |
| Marker Scale Finder | Measure image scale from ArUco markers based on user-input size. |
| Rotate Image | Rotate image by 90-degree increments. |
| Set Color Standard | Manually set red, green, and blue color reference values for downstream data processing. |
| Set Image Scale | Manually define image scale for downstream data processing. |
(ii). Masking Plant Foliage
SOAPP guides users through creating a binary mask that separates plant material from the background by converting the preprocessed image from RGB into the HSV (Hue, Saturation, Value) and LAB (Lightness, a, b) color spaces using PlantCV's rgb2gray_hsv and rgb2gray_lab functions. For each color channel, the user can apply binary, range, or Otsu thresholding via PlantCV's respective threshold. binary, threshold.range, and threshold.otsu functions. Binary thresholding converts pixels above/below a user-defined value to white/black, whereas range defines an upper and lower limit for valid pixel values, and Otsu automatically determines an optimal threshold. The resulting binary masks from different channels are then combined using Boolean operations through PlantCV's logical_and, logical_or, and logical_xor functions to create a final mask that accurately captures the plant material. This interactive masking process enables users to visualize and iteratively refine the masks until the plant is properly segmented from the background for downstream analysis steps (Fig. 2D). While currently relying on PlantCV's thresholding methods, SOAPP's modular architecture enables future integration of additional masking algorithms beyond PlantCV's offerings, including machine learning-based approaches such as semantic segmentation (Cheng et al., 2023).
(iii). Defining Regions of Interest
After creating the binary mask, SOAPP allows users to define regions of interest (ROIs) for analysis (Fig. 2E). This is accomplished by selecting a grid of ROIs overlaid on the image using PlantCV's roi.multi function. The defined ROIs are displayed as colored circles on the original image, and users can iteratively add, remove, or resize ROIs as needed to accurately capture the desired samples. While SOAPP currently uses circular ROIs, its modular design allows for integrating custom ROI selection methods in the future, such as advanced techniques like polygon or freehand ROI drawing tools. By providing both grid-based and individual ROI options along with visualization and adjustment capabilities, SOAPP ensures precise ROI definition for diverse sample arrangements, guiding downstream quantification of phenotypic traits for individual plants or groups simultaneously.
(iv). Running Image Analysis
After defining the ROIs, SOAPP allows users to select from a range of analysis methods to quantify phenotypic traits of the plant samples (Fig. 2F). The “Analyze Object” function of PlantCV extracts shape descriptors like area, perimeter, height, and width from the plant object within each ROI, providing insights into overall plant size and morphology. The “Analyze Color” function quantifies the color composition of plant material. It generates histograms and computes values such as hue, saturation, and value from the different RGB, HSV, and LAB color spaces, exposing changes in pigmentation that can potentially reveal features such as stress responses (Gil et al., 2022). The “Watershed Segmentation” analysis segments the plant into individual leaves/parts geometrically, enabling the counting of leaves/branches and measuring traits for each segment, facilitating the study of leaf-level phenotypes. While SOAPP currently implements the core PlantCV analysis suite, its modular architecture allows integrating additional analysis methods tailored to specific applications, including advanced techniques like machine learning-based feature extraction. Users can select any combination of these analyses based on their requirements. The analysis is performed on the masked plant regions using the corresponding PlantCV functions. All analysis outputs are generated in PlantCV's standard JSON format, providing a structured representation of the extracted phenotypic data. This consistent formatting enables integration with downstream data processing pipelines or visualization tools. By offering a range of analysis options along with the ability to extend with custom methods, SOAPP provides a flexible and powerful approach to quantifying diverse aerial phenotypic traits from plant images in a user-friendly manner.
(v). Data Retrieval
SOAPP provides users with multiple options for retrieving phenotypic analysis results. In addition to exporting data in PlantCV's native structured JSON format, data can be stored as a flattened comma-separated value (CSV) format for easy import into spreadsheets or statistical software (Fig. 2G). If scale information is available from manual input or automated scale-finding tools, all size-based measurements, such as area and perimeter, are automatically scaled to real-world units in the CSV export (Fig. 2G). When using unit scaling in morphological analysis, appropriately scaled phenotypic measurements will be reported in the morphology data output CSV file, identifiable with the suffix “_scaled” in the variable name. When color analysis is performed, SOAPP generates color histogram visualizations for each analyzed plant object using PlantCV's analyze_color function output to aid quantitative interpretation of color composition data. SOAPP also calculates mean and standard deviation metrics from these histograms using either the arithmetic mean for linear values, the circular mean for circular values such as hue, and the root mean square, which accounts for non-linear color encodings within images. All values are reported using the arithmetic mean (indicated with no suffix) and root mean square (indicated with measurement suffix “_sq”); however, the appropriate values should be used given the colorspace encoding of the user images. When using a color standard preprocessing model, standardized values are reported as either linear distance between calculated means and the standard value (indicated with measurement suffix “_corr”) or with the distance between observed and expected standard values being applied to the phenotypic measurement (indicated with measurement suffix “_corr_wb”). Additionally, SOAPP calculates a suite of RGB vegetative indices previously reported, such as the Red Green Blue Vegetation Index, listed in Table 3.
Table 3.
Vegetative Indices Calculated by SOAPP.
| Name | Abbreviation | Name in SOAPP | Formula | Reference |
|---|---|---|---|---|
| Green Index | GI | index_GI | [(255-∣G-165∣ + 255-∣R-37.5∣ + 255-∣B-37.5∣) / (3*255)] / 12 * (1-[(255-∣G-165∣ + 255-∣R-37.5∣ + 255-∣B-37.5∣) / (3*255)]) | Signorelli et al., 2023 |
| Green Leaf Index | GLI | index_GLI | [(2*G)-R-B] / [(2*G)+R-B] | Louhaichi et al., 2001 |
| Normalized Difference Anthocyanin Index | NDAI | index_NDAI | (R-G) / (R+G) | Kim & van Iersel, 2023 |
| Red Reflectance | Rr | index_Rr | R / (R + G + B) | N/A |
| Green Reflectance | Rg | index_Rg | G / (R + G + B) | N/A |
| Blue Reflectance | Rb | index_Rb | B / (R + G + B) | N/A |
| Green Red Vegetation Index | GRVI | index_GRVI | (Rg - Rr) / (Rg + Rr) | Tucker, 1979 |
| Modified Green Red Vegetation Index | MGRVI | index_MGRVI | (Rg^2 - Rr^2) / (Rg^2 + Rr^2) | Bendig et al., 2015 |
| Red Green Blue Vegetation Index | RGBVI | index_RGBVI | [Rg^2 - (Rb*Rr)] / [Rg + (Rb*Rr)] | Bendig et al., 2015 |
| Visible Atmospherically Resistant Index | VARIgreen | index_VARIgreen | (Rg - Rr) / (Rg+Rr+Rb) | Gitelson et al., 2002 |
Reproducing and Automating Analysis
During any point of analysis, users can download an exact configuration file of their defined workflow. This configuration file is formatted as a human-readable JSON file. At the start of a subsequent analysis, the user can upload a configuration file to SOAPP, populating all previously defined parameters throughout all stages of analysis. Additionally, users can also download intermediate images from each major analysis pipeline step, such as the original, preprocessed, masked, and analyzed images with overlaid ROIs and measurements for visual verification. This recording of each pipeline step is also critical for compliance with the FAIR standards (www.go-fair.org) that require data and analyses to be Findable, Accessible, Interoperable, and Reusable.
Configuring the initial analysis usually takes only a few minutes. Once the analysis workflow is defined, the process can be automatically applied to all images currently uploaded in the user's application instance. It is important to note that such automated analysis is dependent on a consistent image format across the uploaded user images. However, this requirement is usually the norm when replicate experiments or analyses made on datasets from the same growth and imaging hardware are being compared. After such automated processing has been performed, bulk analysis results can be downloaded as a .ZIP file containing results and intermediate data for each image analyzed.
Results
Case Study 1: Validating SOAPP Measurements Using Analysis of Arabidopsis Grown on Agar Plates
Hughes et al. (2025) reported SOAPP could make highly reproducible measurements of hypocotyl length from images of seedlings across multiple accessions of Arabidopsis thaliana, with essentially no measurement-to-measurement variation across multiple rounds of analysis. In comparison, these researches found an average variance of 5.47% in results when equivalent measurements were performed manually using the ImageJ image analysis software (Schneider et al., 2012). To extend this validation of the accuracy of measurements made using SOAPP, we reanalyzed image data from five of the Arabidopsis ecotypes used in the Hughes et al. (2025) study: Doubravnik-7, IP-Deh-1, Ha-HBT1-2, Ler-1, and Li-7. Instead of hypocotyl length, we used SOAPP to extract the area of the foliage as a metric likely to be widely used by plant space biology researchers as a proxy for biomass accumulation. Measurements were performed using both manual analysis through ImageJ and via SOAPP to ask how closely these two measurement approaches correlated. Briefly, seeds were sown onto Petri plates containing gel growth medium consisting of 50% Murashige and Skoog nutrients (w/v), 1% sucrose (w/v), and 1.2% of agar (w/v). Plants were then grown under both 1 x g gravity (vertically oriented plates) and simulated microgravity conditions created using a rotating 2D clinostat running at 1 rpm (Kiss et al., 2019) for seven days (see Hughes et al., 2025 for detailed growth parameters). Following this growth period, plates were imaged using a high-resolution Epson scanner. A representative image of this dataset is presented in Figure 3A. The goal of including multiple ecotypes and two conditions known to alter plant growth profiles was to generate a wide range of plant sizes. Vegetative tissue area was measured both by hand using ImageJ and via SOAPP to assess consistency of vegetative tissue measurement between these two analytical approaches. As manual analyses using ImageJ require some practice and skill for accuracy, to ensure the robustness and consistency comparative data, all hand-measurements were collected by a single researcher with several years of experience in these kinds of manual plant image analysis tasks. A representative output image is presented in Figure 3B. Scale was measured manually with the ruler included in each image using ImageJ's scale function, and area measurements reported as square millimeters for both SOAPP and hand measurement data. Manual ImageJ and SOAPP measurements for 214 total plants were compared using an individual plant-wise linear regression performed with Python package SciPy (version 1.12.0; Scipy.org). Figure 3C shows results of individual plant comparisons versus an equivalent reference reflecting a theoretical complete agreement between the two approaches. The linear regression (y = 0.01839 + 1.039x; p = 3.262e-204) yielded r = 0.9938, indicating SOAPP was able to effectively match hand measured values.
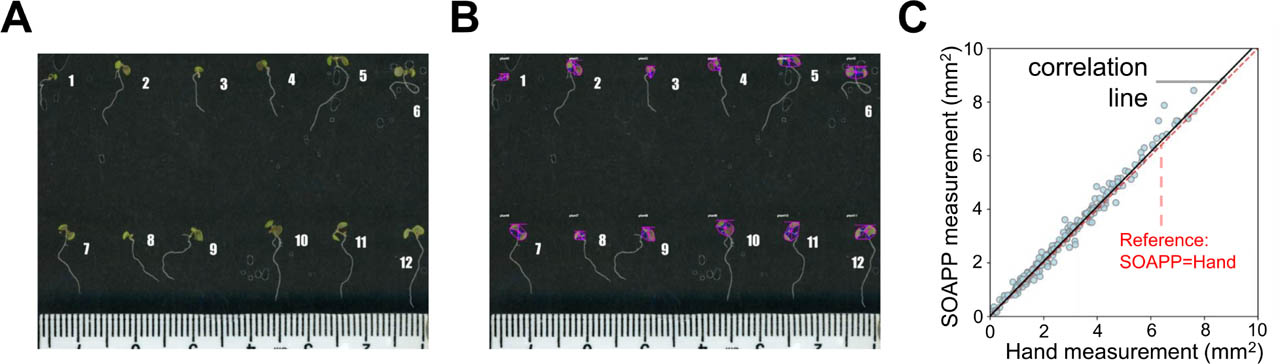
Figure 3.
Comparison of hand and SOAPP measurements on plate-grown Arabidopsis foliage. (A) Representative image from Arabidopsis thaliana image dataset. (B) Analyzed image from image dataset. (C) Comparison of hand area measure and SOAPP-produced area measurement.
Case Study 2: Adding Value to Existing Datasets — Reanalysis of OSD476 - Arabidopsis Grown on Lunar Regolith
The accumulating imaging data from spaceflight-related plant biology experiments appearing in publications and being deposited in NASA's Open Science Data Archive offers a rich resource for extracting further insight into plant responses to growing in space. SOAPP provides a simple approach to rapidly mining these existing datasets. For example, daily images of Arabidopsis grown on both true lunar regolith and in the JSC1A simulant (Paul et al., 2022) were obtained from the NASA Open Science Data Repository (OSD-476). Images acquired from July 2–16, 2021 (coded as 210502-210516) were analyzed for plant shape characteristics of green tissue using SOAPP for comparison to those of the original publication (Paul et al., 2022).
SOAPP's automated phenotyping of these images (Fig. 4A–D) enabled comprehensive quantification of multiple traits, including plant area, perimeter, solidity (object area/convex hull area), convex hull area and vertices, longest path, width, and height, as well as ellipse properties like angle and eccentricity. The extracted multi-trait data facilitated exploratory data analysis and pairwise correlation studies (Fig. 4E) using R library “corrplot” version 0.95. These analyses offer the possibility to uncover new potential relationships between different phenotypic parameters, such as correlations between plant area, perimeter, and convex hull properties that may help provide new insights into growth patterns and responses to the regolith substrate. Leaf area for each plant was plotted over time, showing the increase in healthy tissue in JSC1A substrate-grown plants in comparison to the three Apollo mission true regolith samples (Fig. 4F). SOAPP measurements were averaged plate-wise and matched with their corresponding measurements of the widest spread of the rosette made by hand using ImageJ. The associations between these manual measurements of rosette diameter (variable name “leaf_spread”) and SOAPP measured values reported on a per-time, per plate basis are shown in Figure 4G.
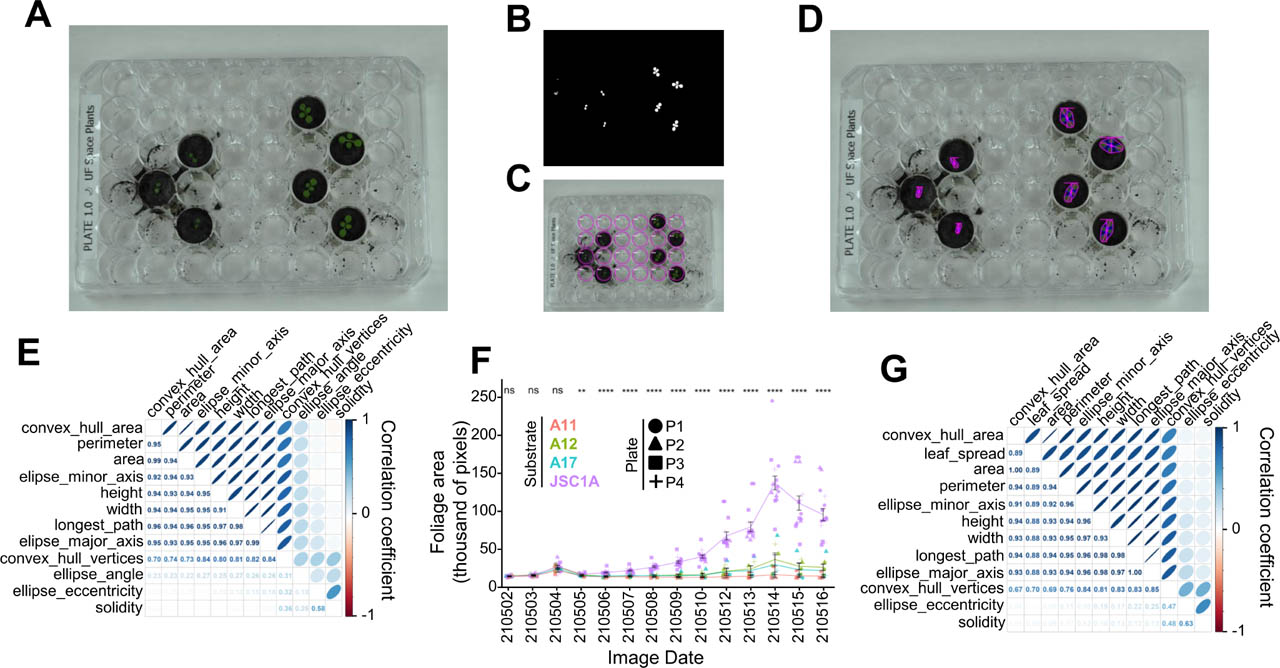
Figure 4.
Analysis of Arabidopsis thaliana grown on lunar regolith from image dataset OSD-476. (A) Representative image of the dataset. (B) Mask produced with SOAPP. (C) Region of interest layout of SOAPP image analysis. (D) Analysis output image produced by SOAPP. (E) Correlation plot of parameters extracted from analyzed morphological images. Ellipse shape and color indicate correlation coefficient values. (F) Green pixel leaf area of plants over image dataset time course. Line and error bars indicate substrate-wise mean and standard error respectively. ns, not significantly different; **, p<0.01; ****, p<0.0001, One-way ANOVA with Tukey Post-Hoc. (G) Correlation plot of plate-wise mean SOAPP values and hand measurement “leaf_spread”. Images from OSD-476 (https://osdr.nasa.gov/bio/repo/data/studies/OSD-476) from original work reported in Paul et al. (2022). A11, A12, A17, Plants grown in regolith returned by the crews of Apollo 11, 12 and 17 respectively; JSC1A, plants grown in lunar regolith simulant JSC1A; P1–P4, samples taken from replicate plants grown in the wells of plates 1–4.
The original analysis of these plants growing in regolith and regolith simulant by Paul et al. (2022) used a manual approach similar to that described above to quantify rosette diameter. Their analysis showed that regolith leads to slower plant growth that plateaus after approximately 15 days post germination. These researchers further showed that plants grown in JSC1A lunar regolith simulant outperformed those in the true lunar regolith. The rapid foliage morphology quantification with SOAPP allowed us to both confirm and extend these previously reported rosette diameter-based conclusions. Thus, as noted above, SOAPP measures a range of rosette shape-related parameters in addition to rosette diameter such as “area” and “longest_path”. Figure 4G shows a strong correlation between these other parameters and rosette diameter (defined by the parameter “leaf_spread”) indicating that the original conclusions drawn by Paul et al. (2022) based on rosette size alone likely robustly reflected an effect also captured in these other size and morphology characteristics. Figure 4E shows that most of these shape-related characteristics strongly correlate with each other and so we therefore concentrated on using one representative parameter, green leaf area (the “area” variable in the figure), as an example of extracting additional insights from these datasets. Thus, by measuring green tissue area, SOAPP identified day 15 (210515 in Fig. 4F) as the timepoint where JSC1A-grown plants begin to exhibit morphological features of worsening health outcomes beyond slower growth, as inferred from a reduction in green leaf area within the rosette. This phenomenon is not observed in the rosette diameter analysis in Paul et al. (2022), where diameter measurement plateaus beginning at day 13 but does not decline. This reduction in the area parameter revealed by SOAPP reflects a loss of green tissue within the leaf structures of the rosette, likely reflecting the onset of senesce. Figure 4F further indicates that a similar trend in reduction in green tissue may be evident in the Apollo 12- and Apollo17-regolith grown plants. Unfortunately, the small size of the rosette and large variability in the plants in these samples means these differences are not significant. In this context, the “solidity” parameter provides SOAPP with a further measure of green leaf fill density within the rosette. The weak correlation between rosette diameter and the solidity parameter (Fig. 4G) reinforces the idea that measurements based on rosette diameter alone do not capture these kinds of changes in overall plant crown closure.
Case Study 3: Using SOAPP to Rapidly Screen for Stress Responses — Analysis of Flooding and Drought Responses in Single Leaves
One potentially important spaceflight-related application of image analysis is in assessment of physiological responses— for example, detecting visual clues as to stress-related patterns of development such as the reduction in green leaf area described above. These kinds of analyses can not only provide important insights into responses during post-experiment analyses of plant flight experiments but also hold great potential for the crew to perform real-time diagnosis of plant vigor from relatively simple digital photography. Indices such as Normalized Difference Vegetative Index (NDVI) and Enhanced Vegetation Index (EVI; Huete et al., 2002), or even following the accumulation of the purple stress pigment anthocyanin (Li & Ahammed, 2023), are all optical techniques widely used in making these kinds of measurements and are implemented in SOAPP. Accurately applying these approaches becomes challenging under the varying lighting regimes inherent in crew photography. However, SOAPP can quantitatively extract and correct color data to help make these measurements robustly. The following analysis demonstrates SOAPP's use of a simple internal color standard to make measurements that accurately reflect true differences in sample color data in plants exposed to water stress.
Lettuce (Lactuca sativa cv. Outredgeous) was grown at Kennedy Space Center in an Advanced Plant Habitat (APH; NASA, 2017)-analog growth system. The growth hardware consisted of a substrate-filled science carrier housed within a standard Percival environmental control chamber that was designed to mimic the APH growth system. Science carrier quadrants were packed with the APH-standard porous clay substrate (arcillite; Monje et al., 2020) to ensure methodological consistency with International Space Station plant-growth protocols. Plants were cultivated under an 18/6 h (light/dark) photoperiod with an average photosynthetic photon flux density of 300 μmol·m−2·s−1. The lighting spectrum consisted of 16% blue, 24% green, and 60% red light, with an additional 36 μmol·m−2·s−1 of far-red light (700–800 nm). All plants were watered daily from germination until 14 days after planting (DAP). After this initial period, four watering regimes were implemented: flood (specifically, waterlogging of the root system), control, intermittent drought, and chronic drought. The root waterlogging treatment was applied by filling the science carrier with water to the top of the arcillite layer and allowing the substrate to dry to only ~2% below this flood fill level before re-watering. The control treatment was allowed to dry to ~52% substrate moisture and maintained at that level. Plants subjected to intermittent drought followed the control regime for the first 14 DAP, after which irrigation was withheld until visible leaf wilting occurred (typically after 5–6 days). These lower water levels were maintained for 24 h, and then the science carrier was re-watered to control levels before the cycle was repeated. Chronic drought plants were gradually reduced to ~35% substrate moisture content and maintained by minimal daily watering.
At the end of the experiment, individual leaves from each plant were harvested and photographed on a neutral white background (Fig. 5A). These images were then analyzed for shape and color using SOAPP (Fig. 5B). Binary masks were constructed from the L, A, and B channels to account for inter-image variation in leaf color relative to the neutral background. Image scale values were measured from the AIRI Bio-Imaging Spectrum Calibration Scale (Astrobotany. com) included with each image and applied to analysis using SOAPP's “Set Image Scale” preprocessing module. To account for the non-linear color values of the images, SOAPP-generated root mean squared-derived RGB and Vegetative Index values were chosen for final analysis.
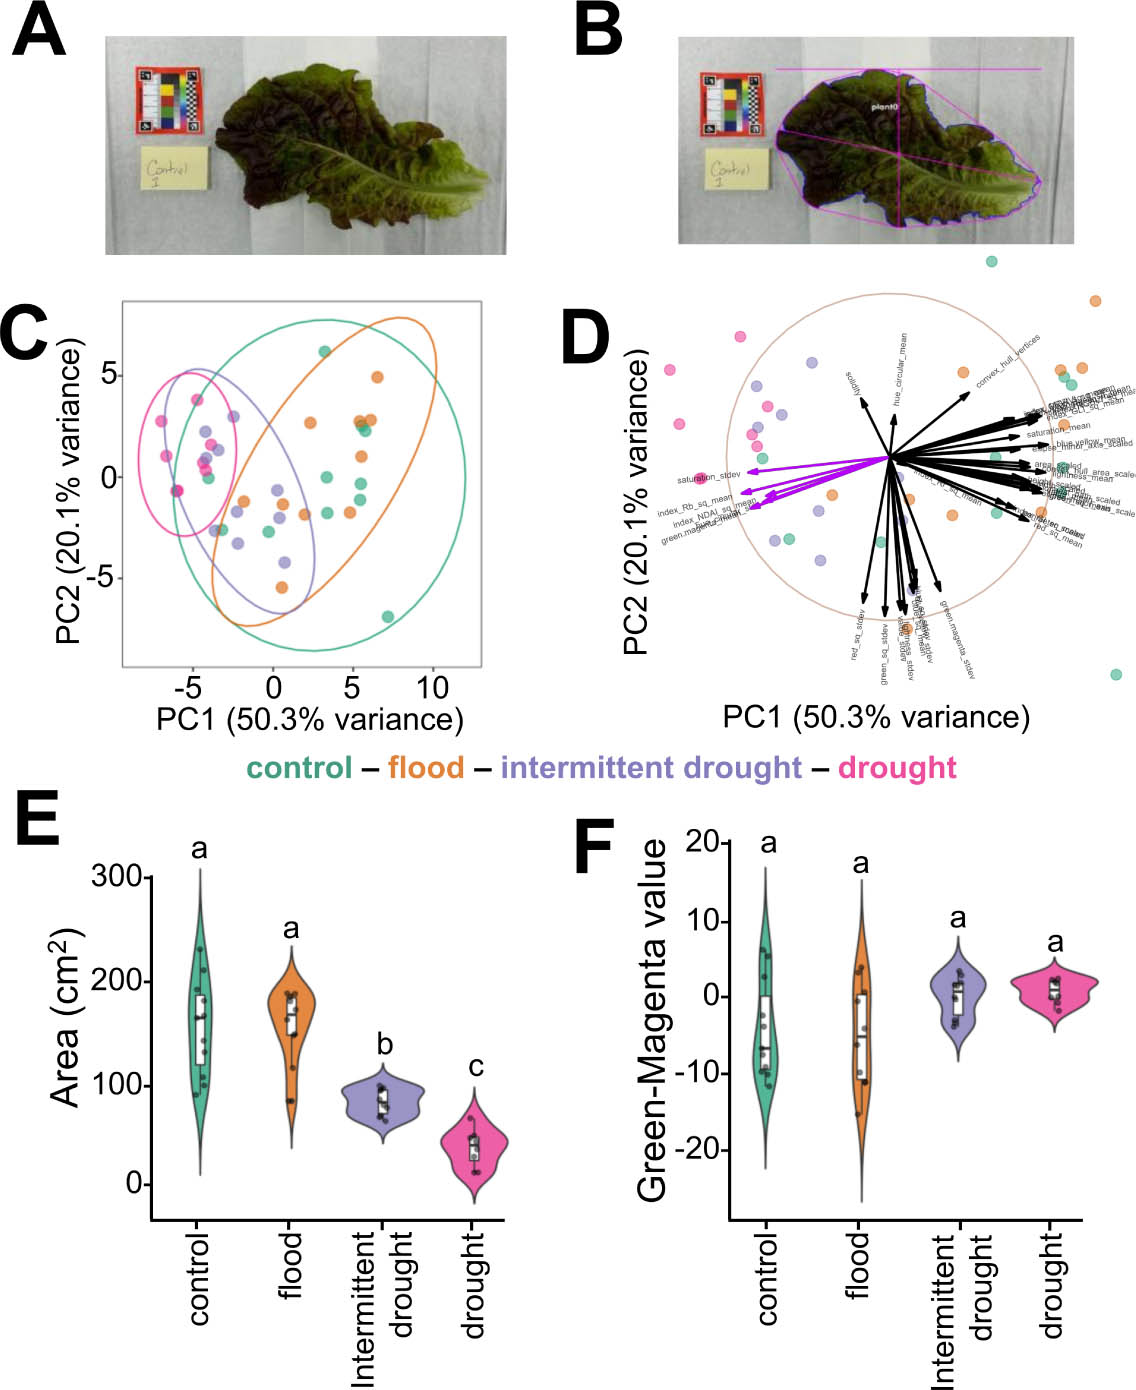
Figure 5.
Analysis of lettuce leaves grown under variable watering regimens. (A) Representative image of collected image dataset from harvested lettuce leaves. (B) Analysis image output of representative image. (C) Principal Component plot of color and morphology with ellipse indicators of 90% confidence intervals. (D) Principal Component Biplot of color and morphology. Length of lines represent the degree of contribution of each variable to each Principal Component. Purple vector lines reflect parameters: saturation_stdev, index_Rb_sq_mean, index_NDAI_sq_mean, hue_circular_stdev, green.magenta_mean. (E) Leaf area values observed among watering regime plants. (F) Green-Magenta color axis values among leaves harvested across watering regime-grown plants. Bars sharing the same letter are not significantly different one-way ANOVA and by Tukey's HSD (p=0.05).
Dimensional reduction of the high-dimensional colorimetric and morphological phenotypic data was performed using Principal Component Analysis. Principal Component (PC) 1 and PC2 were then plotted with ellipses capturing the 90% confidence interval for each watering regime (Fig. 5C). This analysis revealed that while the two drought regimes clustered together, there is little discrimination between the control and the flooding treatment. To gain further insight into the features driving this clustering, phenotype variable loadings for PC1 and PC2 were plotted alongside eigenvalues in a biplot (Fig. 5D). In this representation of the data, the eigenvalues reflect the absolute amount of variance explained by each PC and the loadings (vector lengths) show the degree of contribution of each variable to the PC. This analysis revealed some of the color features driving the separation of the drought phenotypes from the control and waterlogging treatments. These factors included: variance in the color saturation and the circular mean of the hue, the mean of the green-magenta signal, and the root mean square of the Normalized Difference Anthocyanin Index (NDAI) and of the blue reflectance (Rb) parameters, providing both clues as to mechanistic changes, such as potential accumulation of anthocyanins, and directing the next steps of analysis.
Therefore, leaf area and the LAB color space channel “A” that represents the green-to-magenta color axis were next plotted individually (Fig. 5E, F) and tested for significant effects on phenotype by water interaction using a One-Way ANOVA with Tukey Post-Hoc test using R. This analysis found significant differences in leaf area [F(3,35) = 30.23, p = 7.94e-10] and green-magenta value [F(3,35) = 3.227, p = 0.0341] likely attributable to changes in condition. Thus, both the control and waterlogged treatment groups produced comparable leaf area and green-magenta values (Fig. 5F). In comparison, the intermittent drought and drought groups displayed progressive loss of overall leaf area as water quantity declined (Fig. 5E). Additionally, the range of leaf area and green-magenta values was smaller in the reduced watering conditions compared to the control and waterlogged conditions, likely reflecting reduced growth coupled to the production of stress-related pigments such as anthocyanin (Fig. 5E, F). These observations suggest that, under the growth conditions used, drought, rather than root system waterlogging, may be more likely to result in changes in plant health and yield outcomes, as only these conditions led to large-scale, visible changes relative to the control. Regarding lettuce's potential in a cut-and-come-again cultivation context for spaceflight, the reduced sensitivity to root system waterlogging relative to drought has important connotations. Thus, root system waterlogging is thought to be a major potential stress associated with space-based plant cultivation due to the effect of microgravity on the dynamics of water movement (Poulet et al., 2016). However, our SOAPP analysis suggests underwatering may be a more significant issue to address in a spaceflight-oriented cut-and-come-again scenario. Consistent with these ideas, lettuce is known to be compatible with non-aerated, non-circulating hydroponics systems on Earth (Kratky, 2004) whereas even a brief water deficit quickly stunts leaf growth and reduces overall yield (Li et al., 2023).
Case Study 4: Applying SOAPP for Automated Keystone Correction and Image Standardization Using the AIRI Bio-Imaging Spectrum Calibration Sticker in Tomato Imaging
One other challenge inherent in crew photography is the difficulty in setting a uniform distance and angle from the subject to standardize subsequent morphological measurements. In particular, off-axis camera alignments lead to keystoning of images, distorting size measurements. Although cameras permanently mounted in growth facilities can alleviate this issue by having a known, fixed position, this solution limits the scope of image data collection. Cameras with internal position and attitude detectors provide one solution, however, SOAPP can automatically extract scale and keystone corrections from images that incorporate a simple reference sticker. The following demonstrates these in-built corrections in an analysis of tomato plant morphology. A tomato plant from line 1 of the Solanum lycopersicum (NCEBR-1) × Solanum pimpinellifolium L. (LA2093) recombinant inbred line (RIL) population was grown in a controlled environment chamber under a 12:12 h (light:dark) photoperiod at 28 °C day and 20 °C night temperatures, with 475 ppm CO2 and 70% relative humidity. Following harvest and washing, the plant was imaged against a neutral white background under mixed warm-white LED and fluorescent lighting. The imaging background included ArUco markers (IDs 6 and 7, from OpenCV's ArUco “DICT_4X4_50” dictionary), placed in a square pattern with a 1:3 identity ratio to enable automated keystone correction (Fig. 6A).
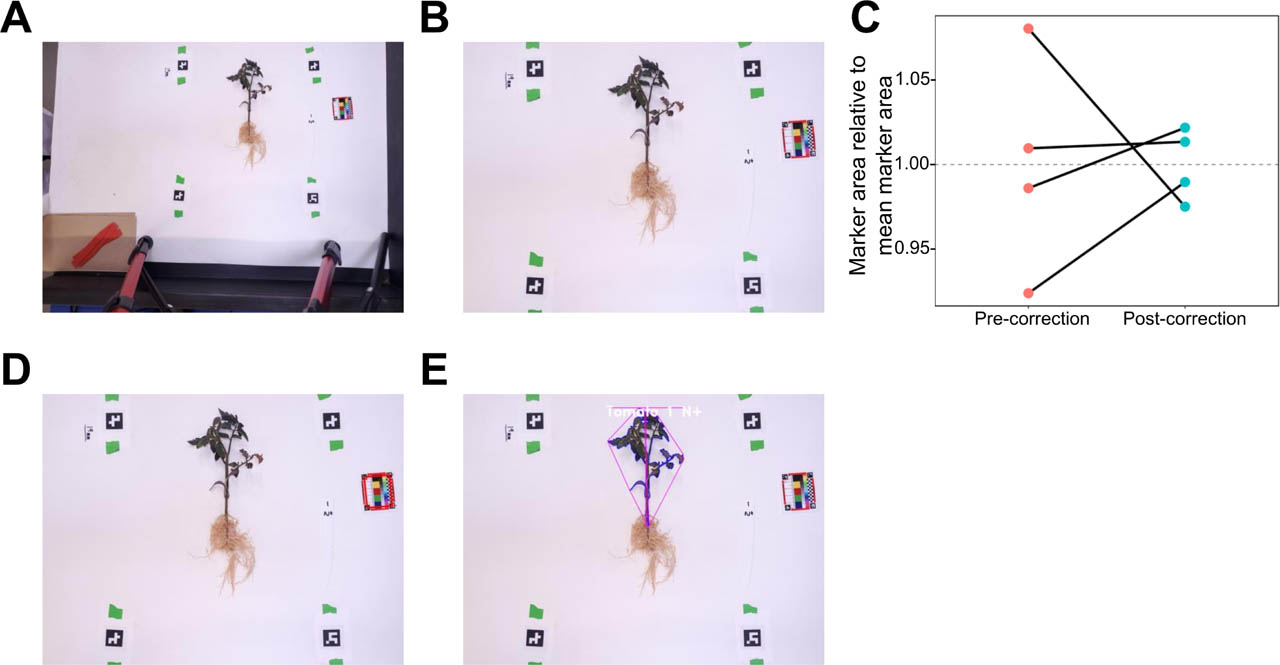
Figure 6.
Demonstration of marker-based frame correction and astrobotany sticker. (A) Original image of tomato plant on white background with markers in a perfect square orientation with 3:1 marker identity. (B) Post-marker-based keystone corrected image using the correction method “SQUARE” and an inset value of 300 pixels, maintaining the original image resolution. (C) Marker size relative to the mean size of four markers before and after correction. (D) Corrected image with Astrobotany sticker positively recognized for automated use as a scale and color standard. (E) SOAPP-analyzed, corrected image.
Keystone correction was performed using the SOAPP preprocessing module “Marker Frame Adjust,” with the “SQUARE” correction method and a 300-pixel inset. This centered the subject within a corrected image frame, preserving the corner markers (Fig. 6B). The correction resulted in a reduction in marker area variability with the relative range of mean marker size decreasing from 15.69% to 4.663%, a 70.29% reduction in this measure of image skew. Changes in individual marker area relative to the image-wide mean are shown in Figure 6C.
An AIRI Bio-Imaging Spectrum Calibration sticker was included in the image and automatically detected (Fig. 6D), providing standardized post-correction scale and color references. Image scale was computed using the SOAPP “Astrobotany Sticker - Scale” module with the “STICKER” correction method, yielding a post-correction resolution of 7637.356 pixels per meter. Color reference values were extracted using the “Astrobotany Sticker - Color Reference” module, producing standardized RGB values of 173.03 (R), 142.83 (G), and 114.19 (B). These standards were used automatically by SOAPP to generate scaled linear and area measurements in the morphological results file, and to apply color correction in the colorimetric results file. The final phenotypic analysis image is shown in Figure 6E.
Discussion
SOAPP is a user-friendly, open-source plant phenomics application that addresses several key challenges in extracting quantitative data from plant images. Its web-based interface and Docker deployment options ensure easy accessibility without complex software installations, aligning with the goal of democratizing plant phenomics for diverse users. SOAPP can also handle non-standardized imaging conditions from handheld cameras or mobile devices by implementing tools like automated scale detection using ArUco markers and image plane correction. These capabilities enhance measurement accuracy and reproducibility.
SOAPP integrates open-source libraries from PlantCV and OpenCV to provide a comprehensive yet modular suite of analysis functions through an intuitive graphical interface. Users can create customized pipelines by selecting preprocessing modules, masking algorithms, region selection tools, and phenotypic trait quantification methods, ensuring flexibility across diverse plant species, imaging conditions, and research objectives. Moreover, SOAPP's implementation of structured data outputs like JSON and CSV with auto-scaled measurements facilitates integration with existing data analysis tools and pipelines.
While SOAPP represents an advancement in accessible plant phenomics solutions, its current implementation has some limitations. These include reliance on PlantCV's thresholding algorithms for masking, which may struggle with isolating plants from complex backgrounds or robustly segmenting overlapping plants. This approach also restricts analysis options to PlantCV's core functions for shape, color, and watershed segmentation analysis. Additionally, SOAPP currently lacks 3D analysis capabilities and may face scalability constraints for very large datasets or images approaching 100 megapixels in size.
To address these limitations and broaden SOAPP's applications beyond its initial spaceflight focus, future work will integrate advanced masking techniques such as machine learning-based semantic segmentation and expand the analysis modules to quantify diverse phenotypic traits. Enabling 3D reconstruction and analysis from multi-view imaging would provide comprehensive phenotyping of plant structure and architecture. Optimizing the codebase, leveraging parallelization, and enabling distributed computing could improve scalability for high-throughput applications. Developing interfaces for integration with other plant science data pipelines and visualization tools, and creating application-specific modules tailored to fields like agriculture, ecology, and plant breeding, would further enhance SOAPP's utility and adoption. SOAPP's open source, modular design means that the plant phenomics community can contribute to its continued development to help address these limitations and drive future directions.
As a web application, SOAPP can be deployed on a public server for open use or locally for users within an institution or group. SOAPP is available for download as a Docker image from hub.docker.com/r/lvbauer/soapp and as source code from https://github.com/lvbauer/soapp. A tutorial for using SOAPP is provided in its Github repository: https://github.com/lvbauer/soapp-tutorial.
Acknowledgements
This work has been supported by NASA (80NSSC19K0126 and 80NSSC21K0577) and fellowships and funding to LB from the Wisconsin Space Grant Consortium, the University of Wisconsin–Madison, the North Carolina State University Genetics & Genomics Scholars Program, US Department of Education Graduate Assistance in Areas of National Need (GAANN) P200A240029, National Science Foundation (NSF) PGRP 2533400, and the North Carolina State University's Institute of Connected Sensor-Systems (ICONS) project “Intrinsic polarization transceivers for on-plant polarimetric sensing.” Support from the North Dakota Space Grant Consortium to GC through the Summer 2023 NASA Internship program is gratefully acknowledged. This support enabled the internship at NASA's Kennedy Space Center with the Space Crop Production team, during which contributions relevant to this research were made by GC.