
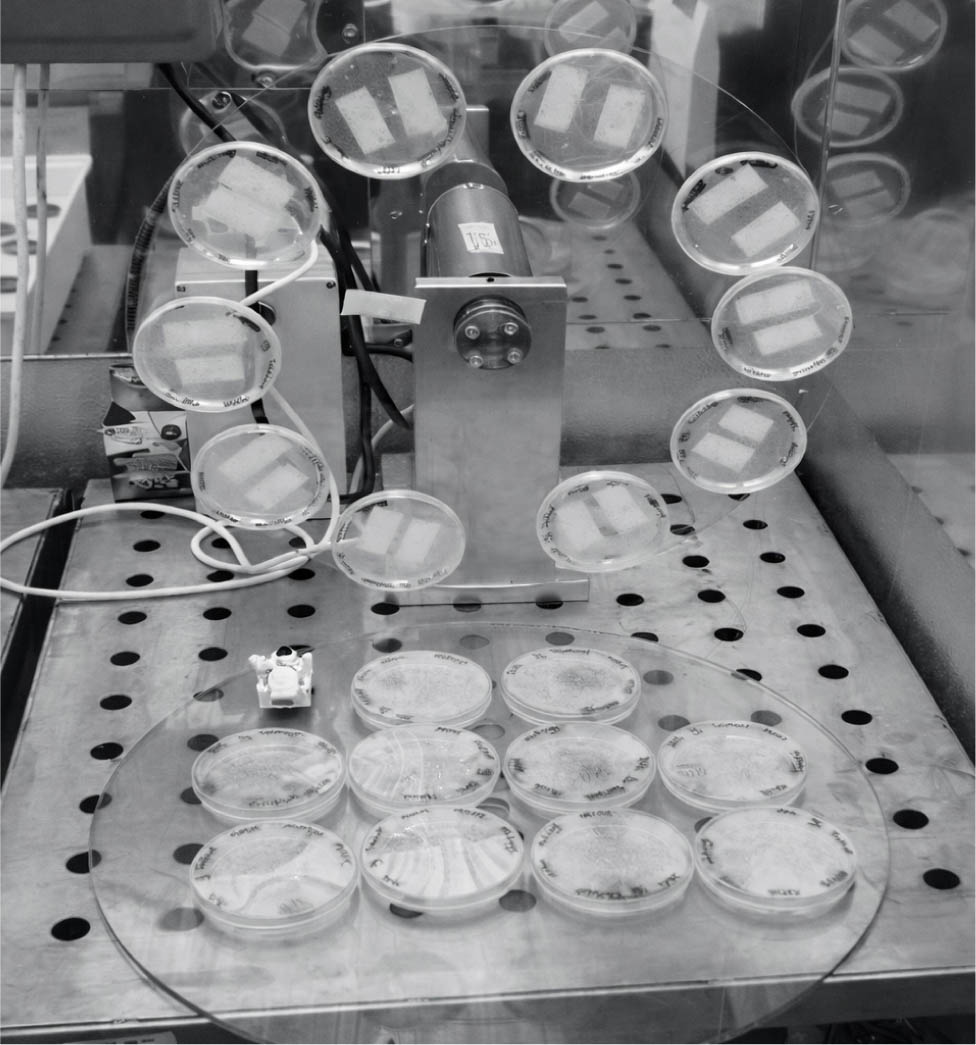
Figure 1.
Two-dimensional clinostat system positioned with a controlled environment chamber (EGC M-48, Environmental Growth Chamber, Chagrin Falls, OH, USA). M. truncatula seeds were placed at the center of each petri dish containing Murashge and Skoog (MS) medium and mounted on the rotating clinostat plate to simulate microgravity conditions, while identical controls were maintained within the same chamber (foreground) under identical environmental conditions.
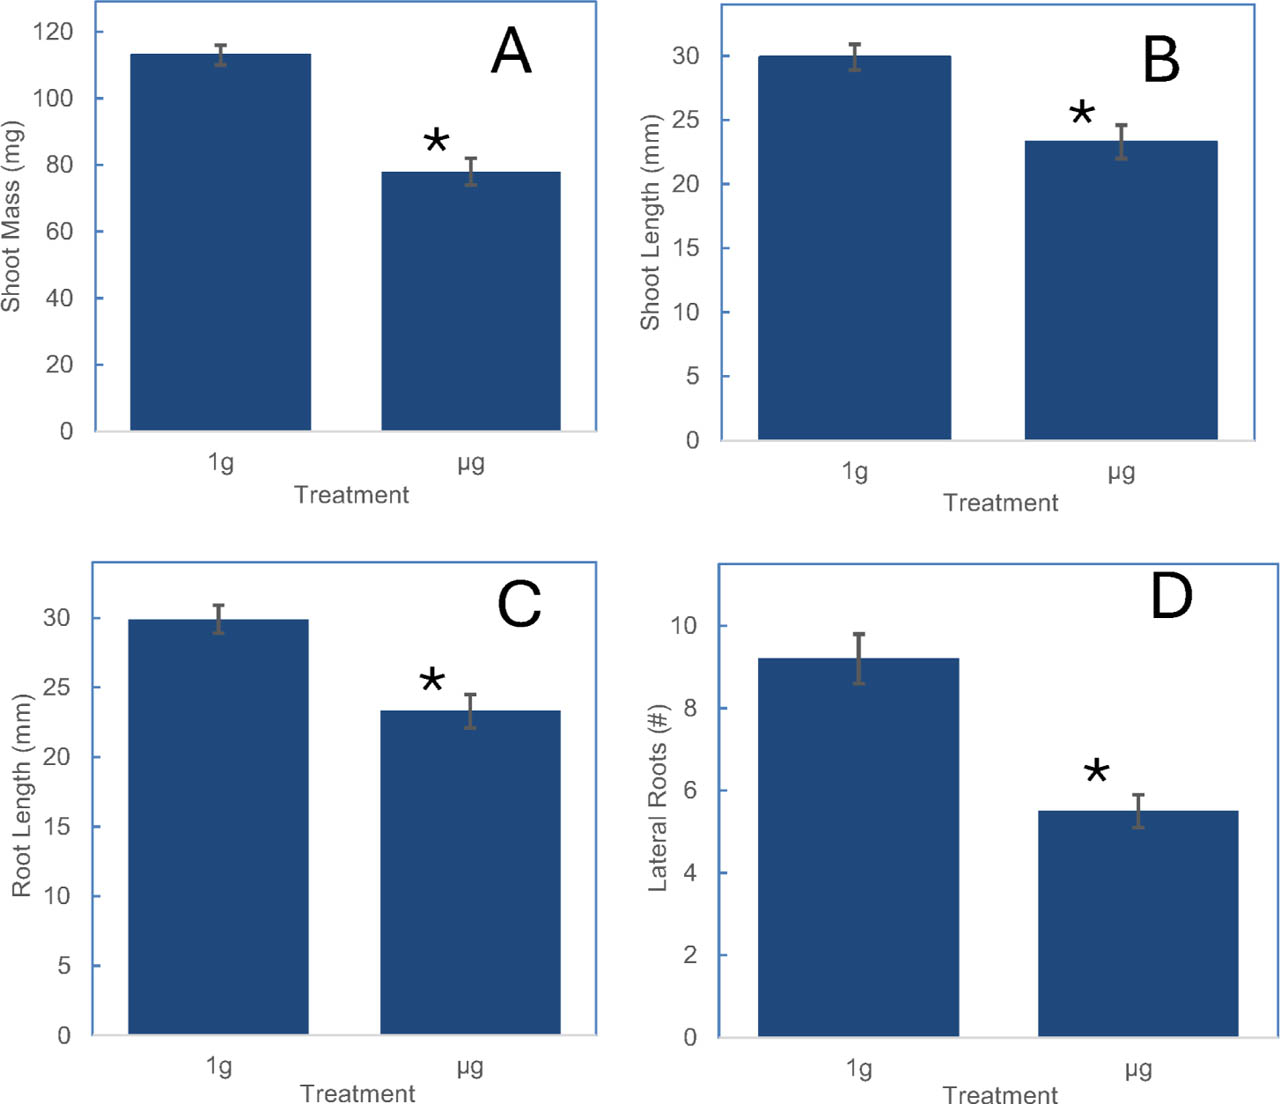
Figure 2.
Effects of simulated microgravity on growth of M. truncatula growth parameters after 14 days. The data represent (A) shoot fresh mass, (B) shoot length, (C) primary root length, and (D) number of lateral roots under stationary 1g or clinorotation (simulated μg) conditions. Data represent the mean of three independent experiments (10 seedlings per experiment). Error bars indicate standard deviation. Asterisks denote statistically significant differences (p ≤ 0.001) between 1g and simulated μg treatments.
Table 1.
RAW264.7 metabolic activity expressed as percentage of 0.1% ethanol control following exposure to Medicago truncatula extracts under static and clinostat conditions.
| Static | Clinostat | ||||
|---|---|---|---|---|---|
| Ethanol controls | |||||
| Dose (%) | % Control | SD | Dose (%) | % Control | SD |
| 0.1 | 100 | 3.7 | 0.1 | 100 | 3.8 |
| M. truncatula extracts | |||||
| Static | Clinostat | ||||
| Dose (ng)* | % Control | SD | Dose (ng) | % Control | SD |
| 4.9 | 58 | 1.4 | 5.4 | 56.6 | 1.2 |
| 9.8 | 53.2 | 3.5 | 10.7 | 54.3 | 2.6 |
| 14.7 | 52.3 | 2.6 | 16.5 | 51.8 | 7.2 |
| 19 | 51.8 | 4.4 | 21.4 | 40.2 | 1.6 |
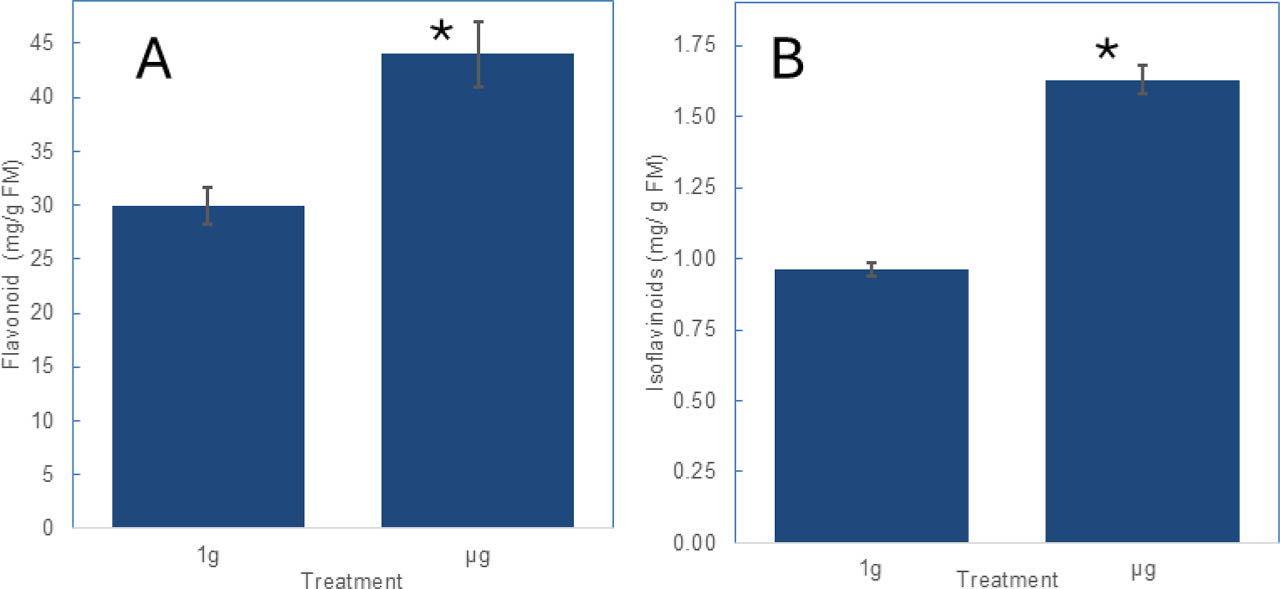
Figure 3.
Effects of simulated microgravity on M. truncatula secondary metabolite concentrations after 14 days. The data represents (A) total flavonoid concentration (mg g−1 fresh mass) as quercetin equivalents and (B) total isoflavonoid concentration (mg g−1 fresh mass) as genistein equivalents. Data represent the mean of three independent experiments (10 seedlings per experiment). Error bars indicate standard deviation. Asterisks denote statistically significant differences (p ≤ 0.05) between 1g and simulated μg treatments.
Table 2.
Summary of metabolic effects of Medicago truncatula ethanol extracts on bone-relevant cell models.
| Cell Line | Cell type/function | End point assessed | Observed effectx |
|---|---|---|---|
| MC3T3-E1 | osteoblast-like | Cell Proliferation (cell counts) | No detectable effect |
| MC3T3-E1 | osteoblast-like | Alkaline phosphatase activity | No detectable effect |
| RAW264.7 | osteoclast precursory | Cell Proliferation (cell counts) | ↓40–60 % relative to EtOH control |
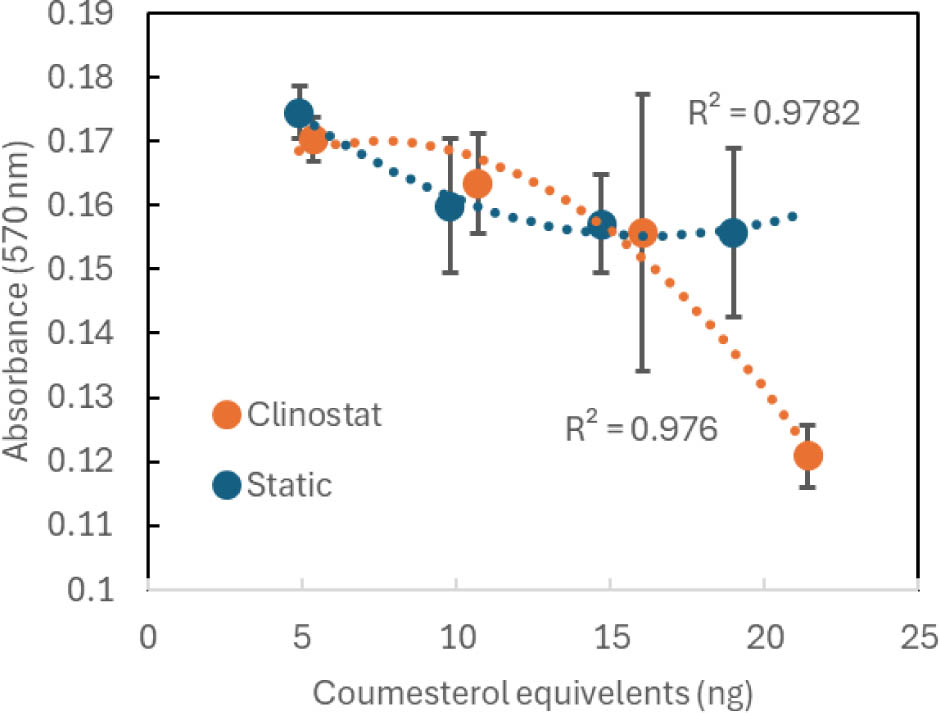
Figure 4.
RAW264.7 activity in response to the 0.1% ethanol extracts from 14-day-old M. truncatula seedlings that have been grown under static or 2-D clinostat conditions.
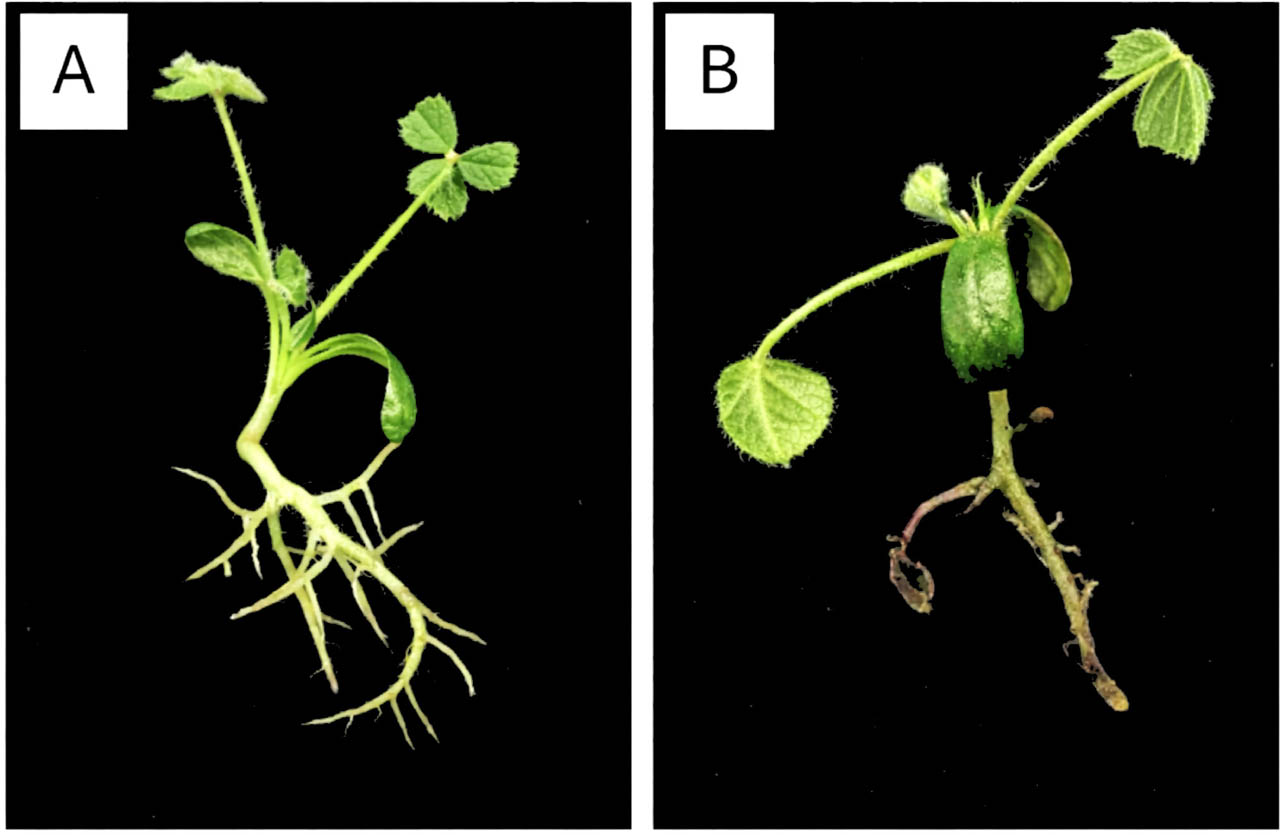
Figure S1.
Representative morphology of M. truncatula seedlings grown for 14 days under (A) stationary 1g conditions and (B) 2-D clinostat-modeled simulated microgravity. Seedlings grown under microgravity exhibited reduced shoot length, primary root length, lateral root development and overall biomass reduction relative to 1g controls.
Table S1.
MC3T3-E1 metabolic activity expressed as percent of 0.1% ethanol control following exposure to Medicago truncatula extracts under static and clinostat conditions.
| Treatment | |||||
|---|---|---|---|---|---|
| Static | Clinostat | ||||
| Ethanol controls | |||||
| Dose (%) | % Control | SD | Dose (%) | % Control | SD |
| 0.1 | 100 | 7.8 | 0.1 | 100 | 8.3 |
| M. truncatula extracts | |||||
| Static | Clinostat | ||||
| Dose (ng)* | % Control | SD | Dose (ng) | % Control | SD |
| 4.9 | 86.1 | 4.2 | 5.4 | 97.8 | 2.5 |
| 9.8 | 94.4 | 8.3 | 10.7 | 97.2 | 2.8 |
| 14.7 | 97.2 | 6.9 | 16.5 | 96.7 | 8.9 |
| 19 | 95.8 | 8.3 | 21.4 | 95.8 | 8.3 |
Table S2.
Alkaline phosphatase (ALP) metabolic activity expressed as percent of 0.1% ethanol control following exposure to Medicago truncatula extracts under static and clinostat conditions.
| Treatment | |||||
|---|---|---|---|---|---|
| Static | Clinostat | ||||
| Ethanol controls | |||||
| Dose (%) | % Control | SD | Dose (%) | % Control | SD |
| 0.1 | 100 | 7.2 | 0.1 | 100 | 7.3 |
| M. truncatula extracts | |||||
| Static | Clinostat | ||||
| Dose (ng)* | % Control | SD | Dose (ng) | % Control | SD |
| 4.9 | 96.4 | 7.5 | 5.4 | 96.8 | 7.6 |
| 9.8 | 98.2 | 7.4 | 10.7 | 96.8 | 7.4 |
| 14.7 | 96.8 | 7.5 | 16.5 | 98.2 | 7.5 |
| 19 | 97.3 | 7.4 | 21.4 | 95.5 | 7.3 |