
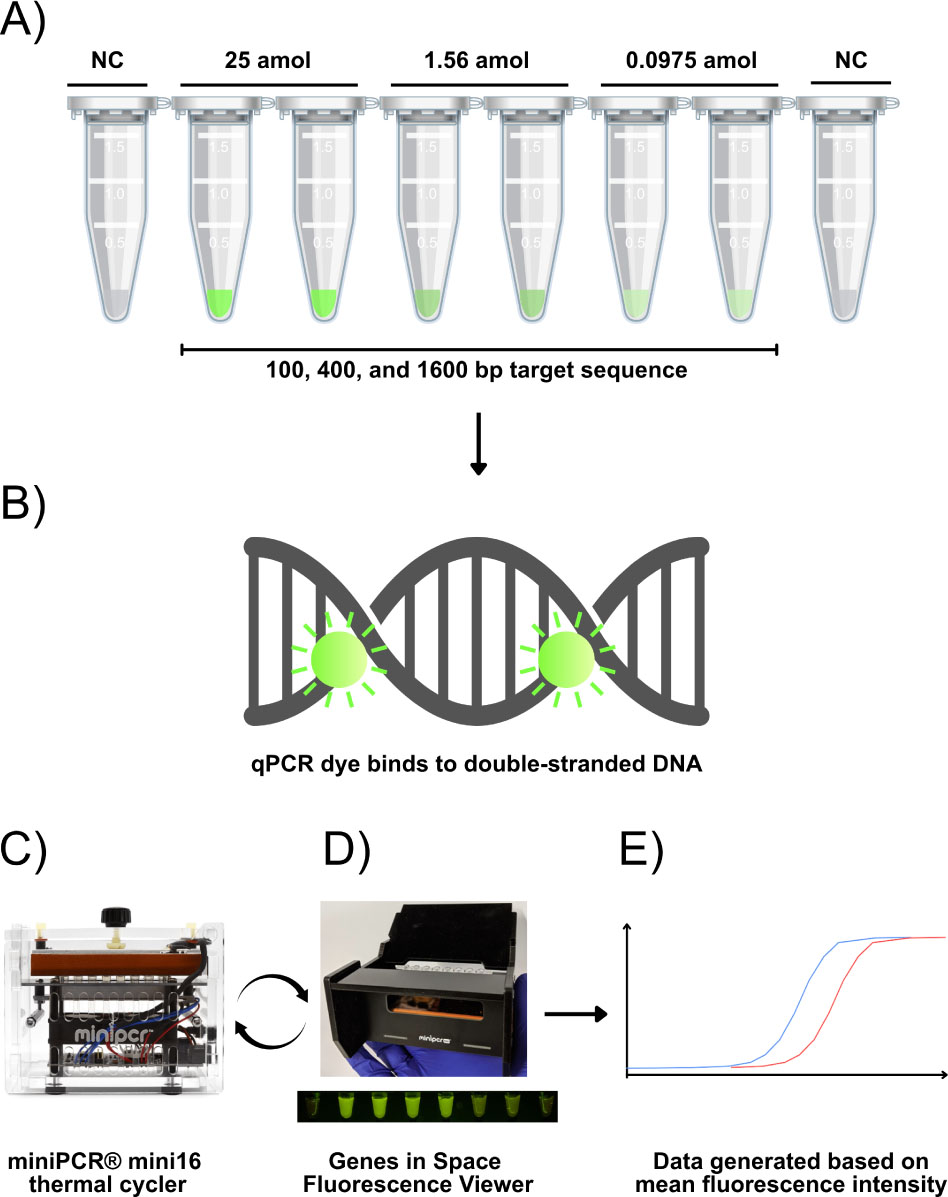
Figure 1.
Diagram of fluoPCR workflow. A) Samples with 100-, 400-, or 1600-bp target sequences at amounts of 25, 1.56, or 0.0975 amol were combined with B) qPCR reagents and C) were amplified with the miniPCR® thermal cycler, and D) were periodically transferred to the GIS Viewer for image capture at regular intervals during amplification cycles. E) The images were later analyzed to measure fluorescence.
Table 1.
Parameters for PCR amplification of the target sequences.
| Step | Time (s) | Temperature (°C) |
|---|---|---|
| 1. Initial Denaturation | 60 | 94 |
| 2. Denaturation | 8 | 94 |
| 3. Annealing | 8 | 55 |
| 4. Extension | 8 | 72 |
| 5. Transfer to GIS Viewer and Image Capture | ||
| Every two PCR cycles (starting at cycle 2 for the 100- and 400-bp targets and cycle 18 for the 1600-bp target) | ||
| 6. Reinsert in miniPCR and repeat steps 2-5 | 36 cycles | |
| 7. Final Extension | 300 | 72 |
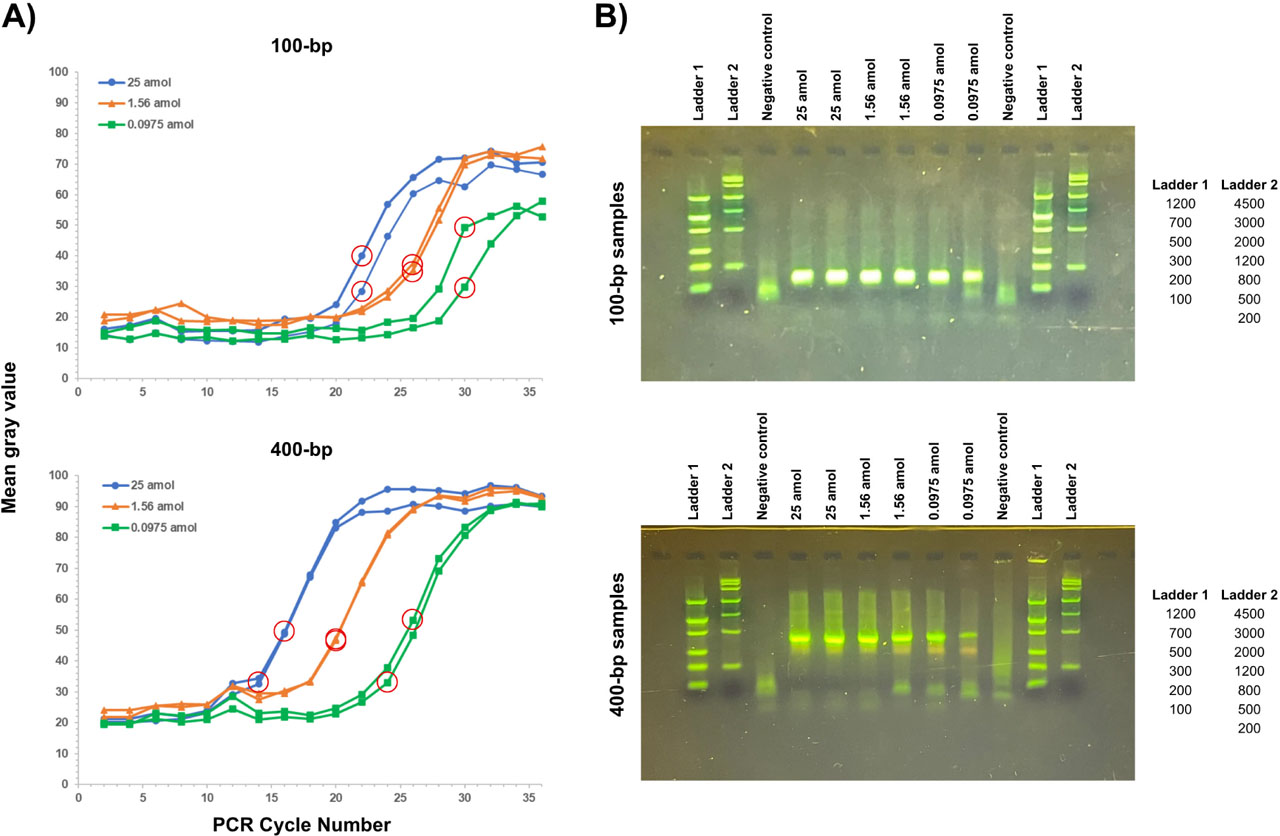
Figure 2.
A) Changes in fluorescence intensity of spaceflight samples during fluoPCR cycles. Target sequences of 100-bp (top) or 400-bp (bottom) at starting amounts of 25 (blue circles), 1.56 (orange triangles), or 0.0975 amol (green squares) were PCR-amplified in duplicate. Fluorescence intensity (mean gray value) was calculated every two PCR cycles. The calculated Ct values (red circles) for the 100-bp target were 20 for both 25 amol duplicates, 22 and 24 for the 1.56 amol duplicates, and 28 for both 0.0975 amol duplicates; for the 400-bp target, 16 for both 25 amol duplicates, 20 for both 1.56 amol duplicates, and 26 for both 0.0975 amol duplicates. B) Ground-based gel electrophoresis of fluoPCR-processed spaceflight 100- and 400-bp samples to confirm target sequence amplification. After sample return, the resulting fluoPCR products after 36 cycles (100-bp on the top, 400-bp on the bottom) were electrophoresed at 135 V for 10–20 min on a 2% agarose gel stained with GelGreen®. Two DNA ladders were included for molecular weight estimation, and gel images were captured under blue illumination.
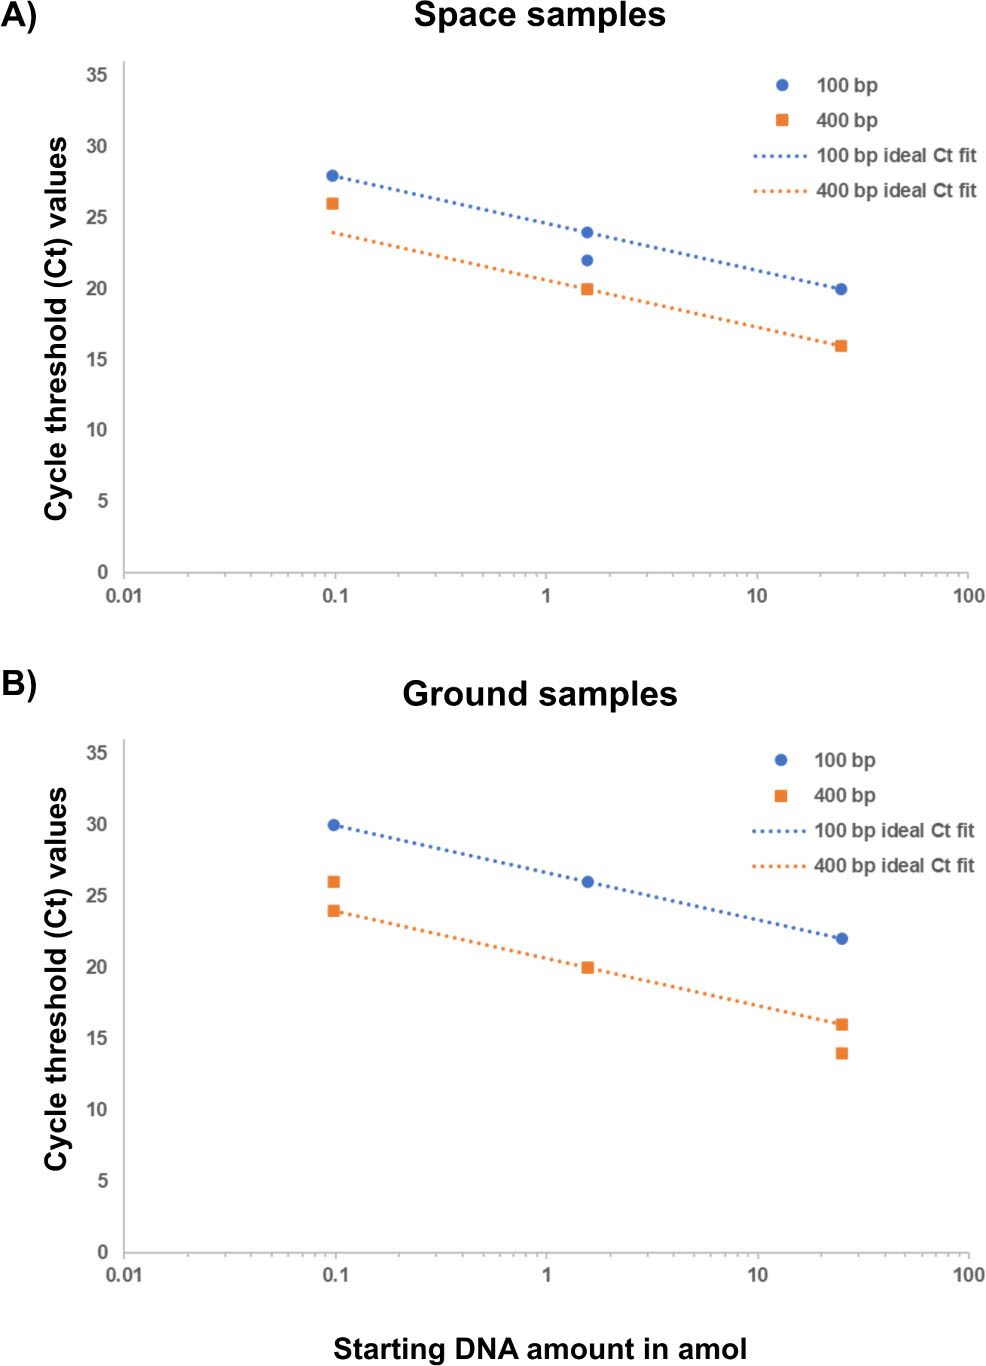
Figure 3.
Comparison of cycle threshold (Ct) values between A) spaceflight and B) ground control samples. Ct values were calculated for each duplicate sample (100-bp in blue circles and 400-bp in orange squares). Some duplicate samples overlap and appear as a single point. Trendlines were fit onto the plot to represent the expected 4-cycle difference in Ct between adjacent 100- or 400-bp samples, assuming perfect PCR efficiency.
Supplementary Table 1:
Assay qPCR reagents and volumes per sample tube.
| Reagent | Volume | Notes |
|---|---|---|
| 2X qPCR Master Mix | 15 μl | |
| Primers (fluoPCR test primer F and fluoPCR test primer R) | 7.5 μl | F: 5′CTGAAGTCTTACGAGGAAGAGTTGG3′ |
| R: 5′TCAGGAGAGCGTTCACCGACAAAC3′ | ||
| DNA volume | 7.5 μl | DNA replaced by water in the negative control |
| Total Volume | 30 μl |
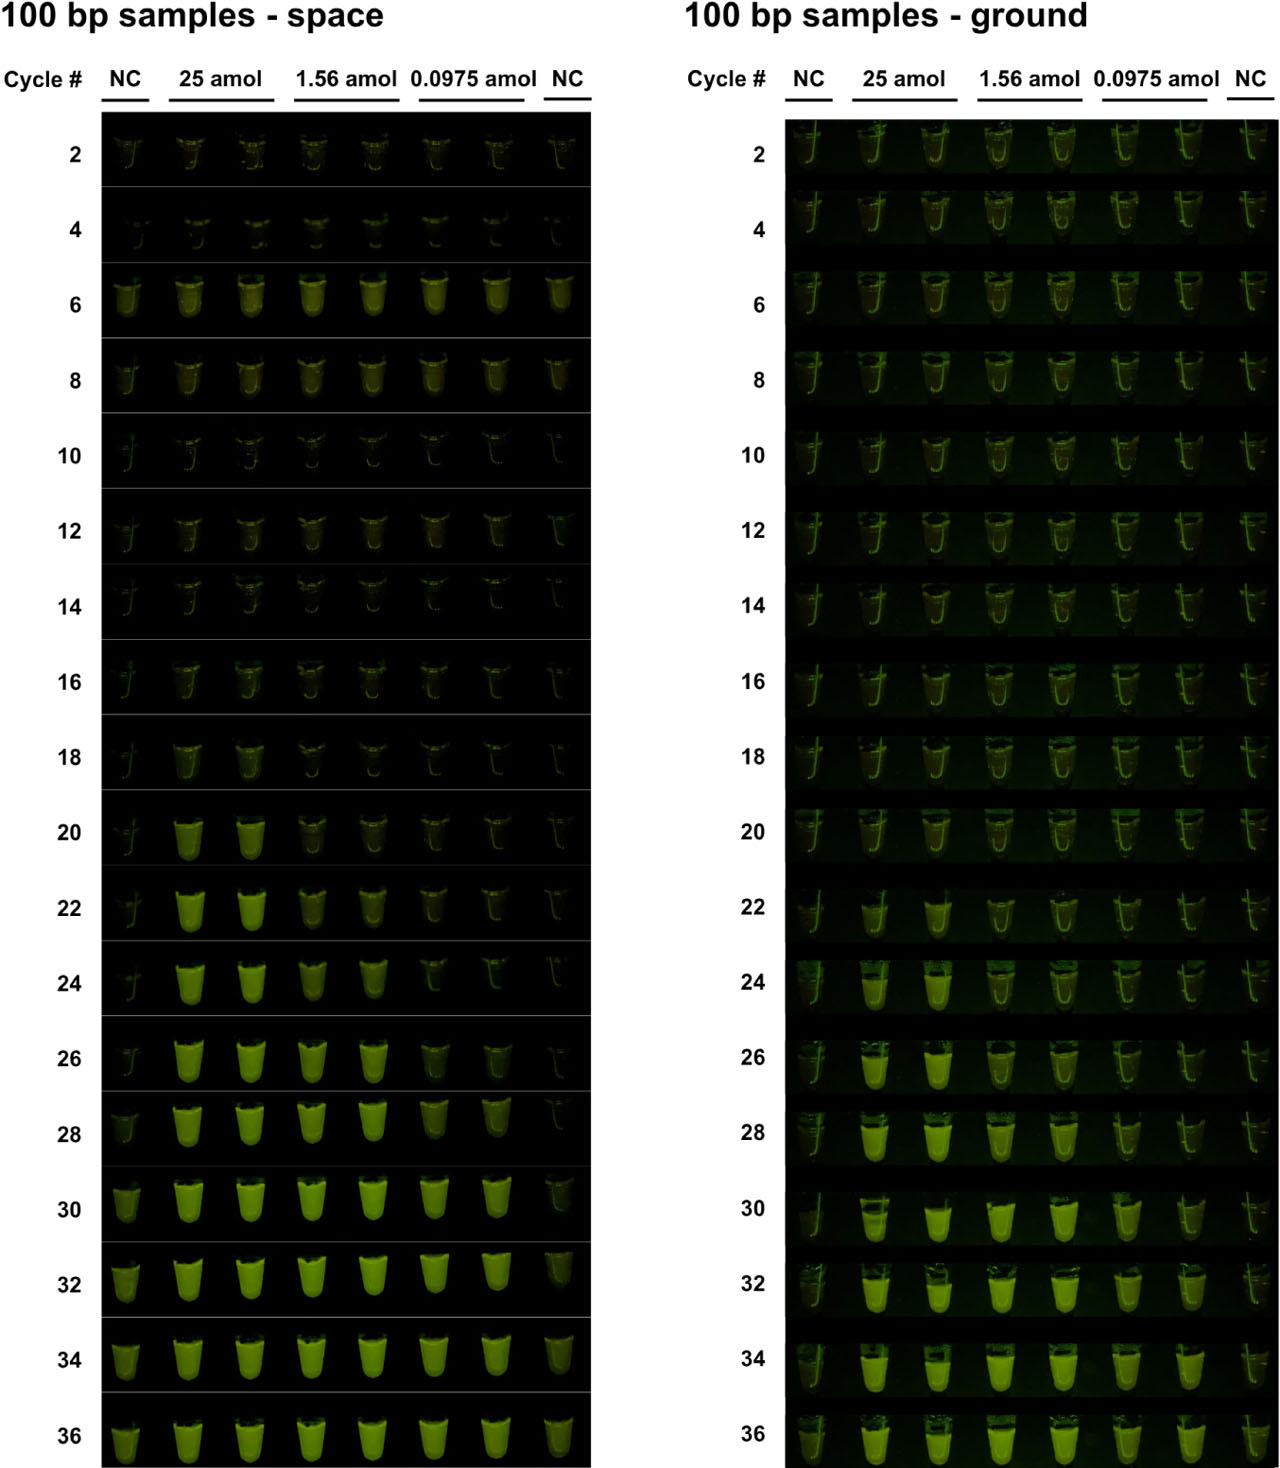
Figure S1.
Images of spaceflight and ground control samples for the 100-bp target sequence every two PCR cycles. Images of the amplified DNA (target sequences of 100-bp at starting amounts of 25, 1.56, and 0.0975 amol, plus negative control) were captured every two PCR cycles (starting at cycle 2 through cycle 36) in the GIS Viewer.
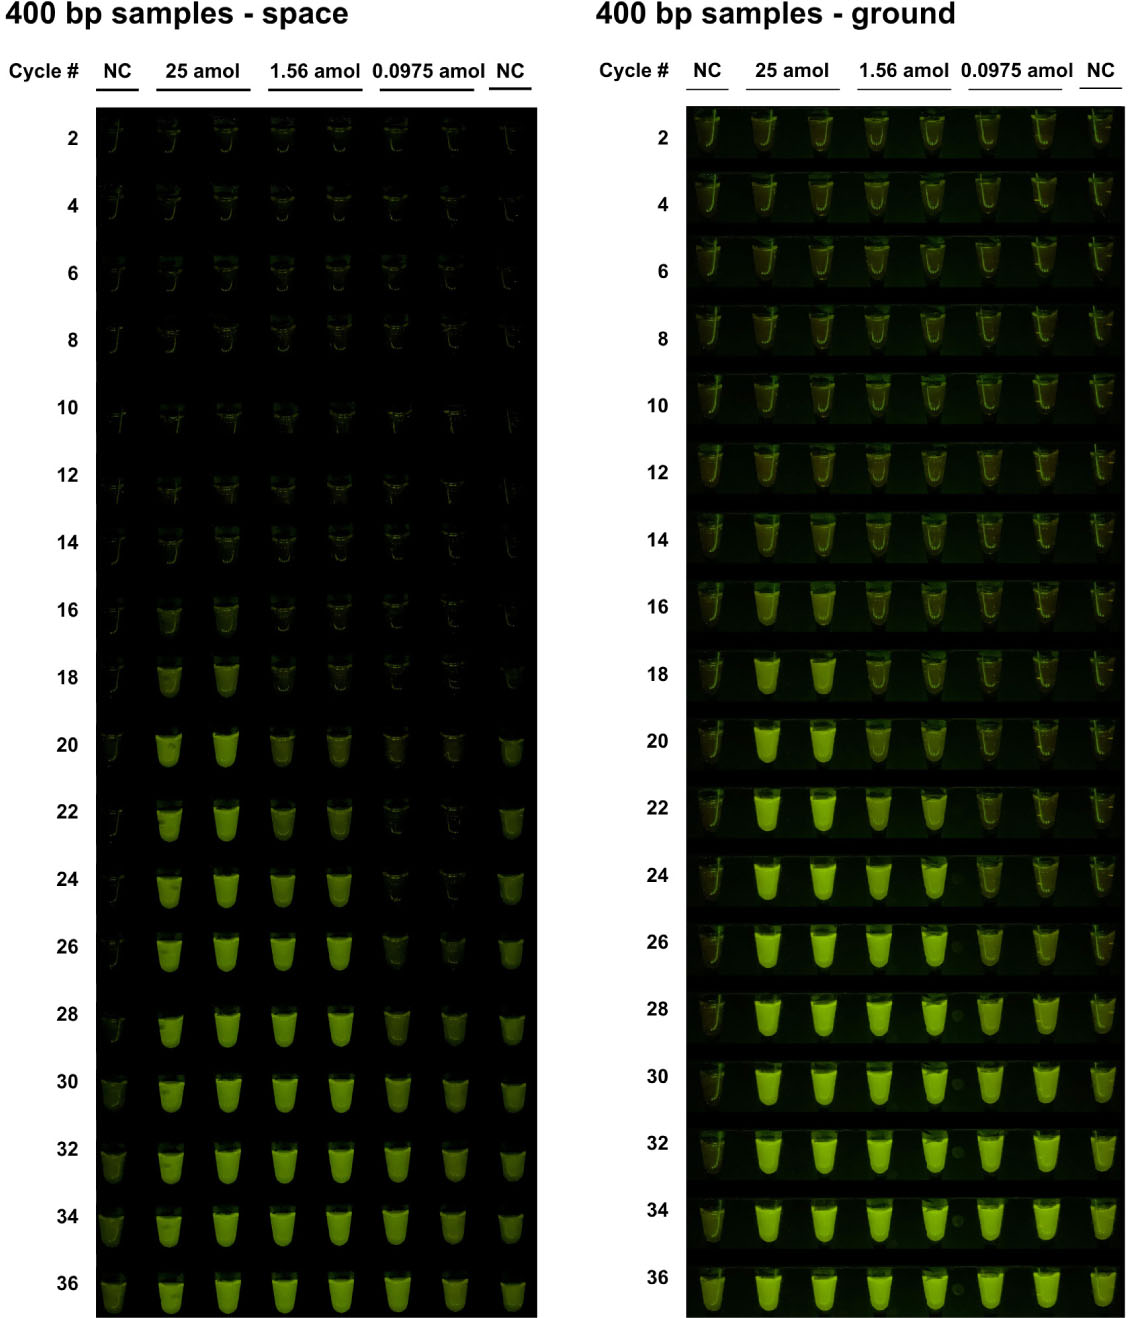
Figure S2.
Images of spaceflight and ground control samples for the 400-bp target sequence every two PCR cycles. Images of the amplified DNA (target sequences of 400-bp at starting amounts of 25, 1.56, and 0.0975 amol, plus negative control) were captured every two PCR cycles (starting at cycle 2 through cycle 36) in the GIS Viewer.
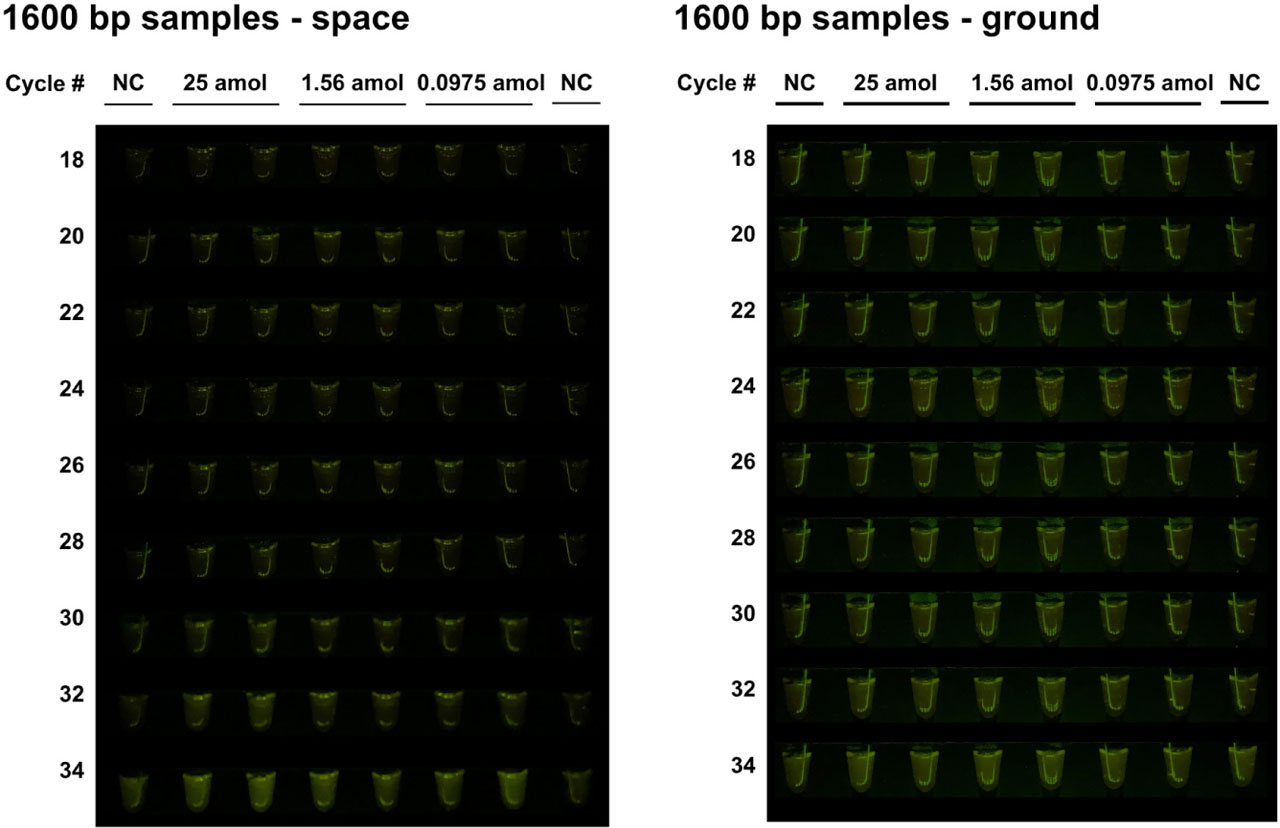
Figure S3.
Images of spaceflight and ground control samples for the 1600-bp target sequence every two PCR cycles. Images of the amplified DNA (target sequences of 1600-bp at starting amounts of 25, 1.56, and 0.0975 amol, plus negative control) were captured every two PCR cycles (starting at cycle 18 through cycle 34) in the GIS Viewer.
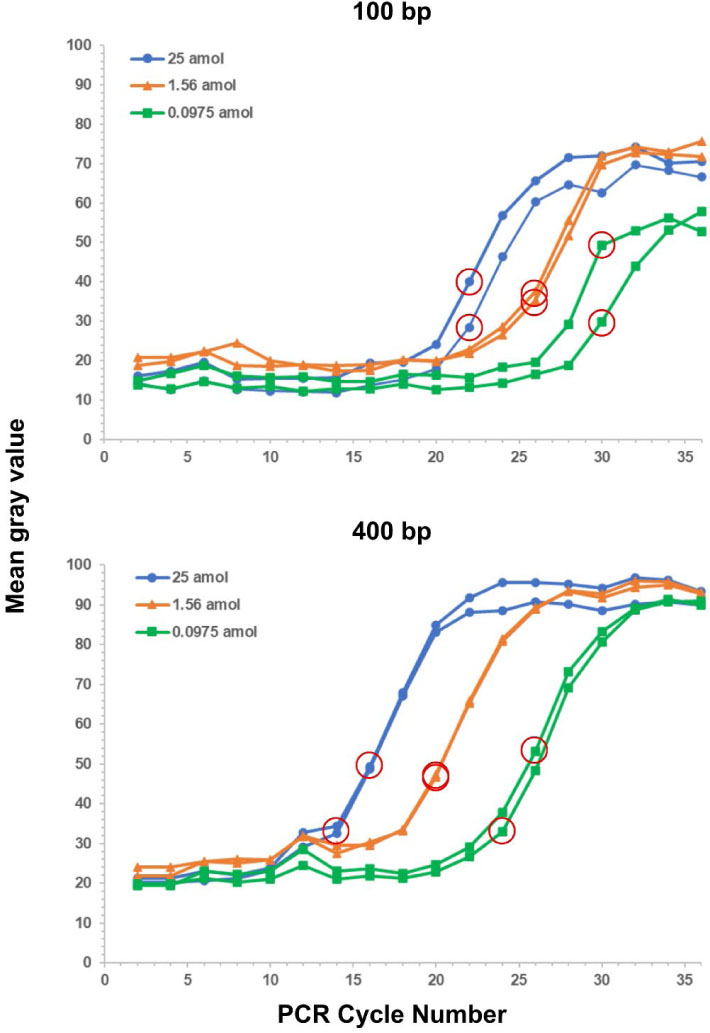
Figure S4.
Changes in fluorescence intensity of ground samples during fluoPCR. Target sequences of 100-bp (top) and 400-bp (bottom) at starting amounts of 25 (blue circles), 1.56 (orange triangles), and 0.0975 amol (green squares) were PCR-amplified in duplicate per condition. Fluorescence intensity (mean gray value) was calculated every two PCR cycles. The Ct values per curve (red circles) for the 100-bp target were 22 for both 25 amol duplicates, 26 for both 1.56 amol duplicates, and 30 for both 0.0975 amol duplicates; for the 400-bp target, Ct values were 16 and 14 for the 25 amol duplicates, 20 for both 1.56 amol duplicates, and 26 and 24 for the 0.0975 amol duplicates.
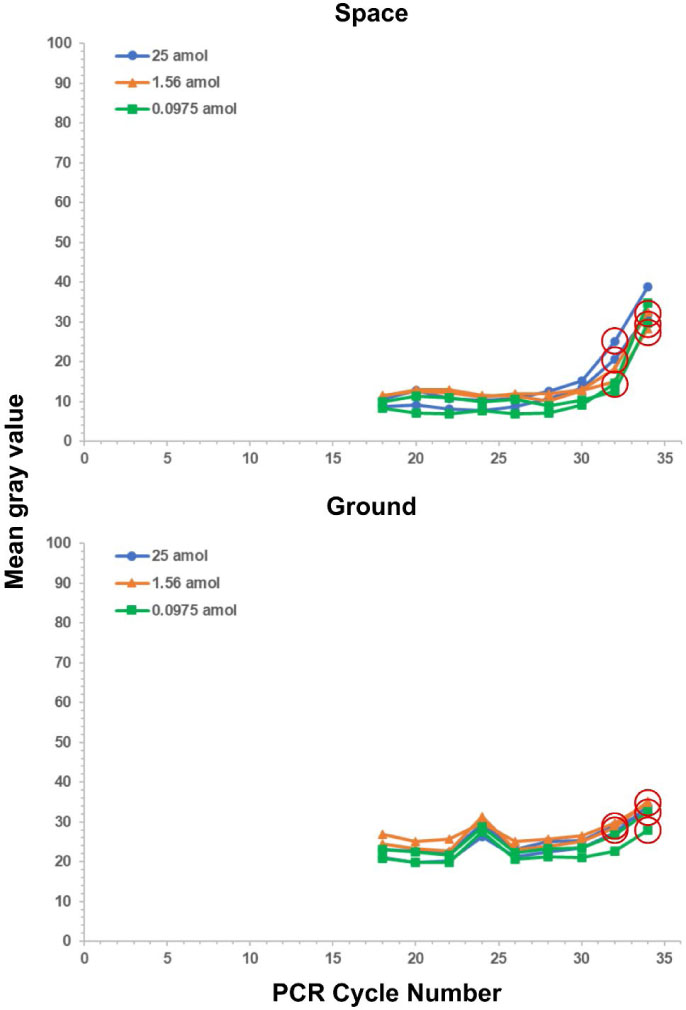
Figure S5.
Changes in fluorescence intensity of 1600-bp samples during fluoPCR. Target sequences of 1600-bp at starting amounts of 25 (blue circles), 1.56 (orange triangles), and 0.0975 amol (green squares) were PCR-amplified in duplicate per condition, with space (top) and ground (bottom). Fluorescence intensity (mean gray value) was calculated every two PCR cycles. The Ct values per curve are circled in red.
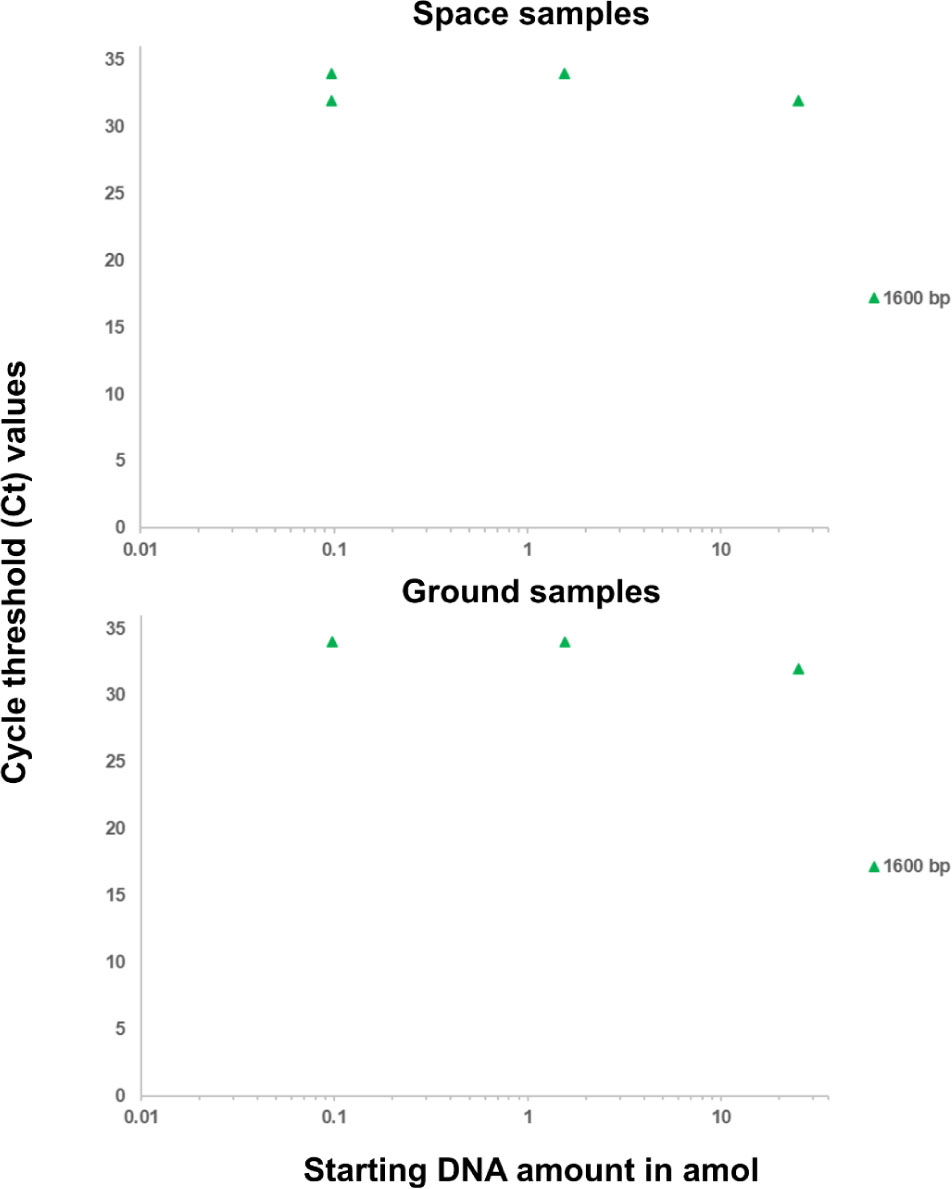
Figure S6.
Comparison of cycle threshold (Ct) values between spaceflight (top) and ground control (bottom) samples for the 1600-bp target. Ct values were calculated for each duplicate sample. Some duplicate samples overlap and appear as a single point.
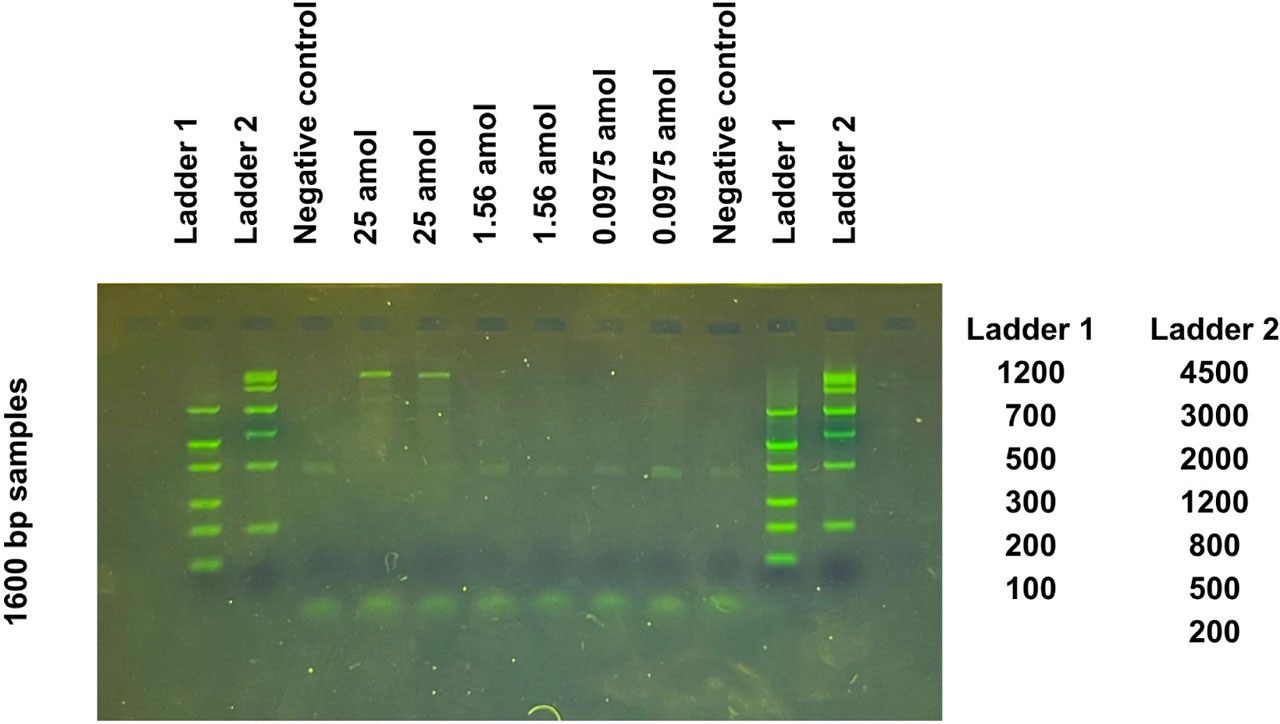
Figure S7.
Ground-based gel electrophoresis of fluoPCR-processed spaceflight 1600-bp samples failed to confirm target sequence amplification. After sample return, the resulting fluoPCR products after 36 cycles were electrophoresed at 135 V for 10–20 min on a 2% agarose gel stained with GelGreen®. Two DNA ladders were included for molecular weight estimation, and gel images were captured under blue illumination.
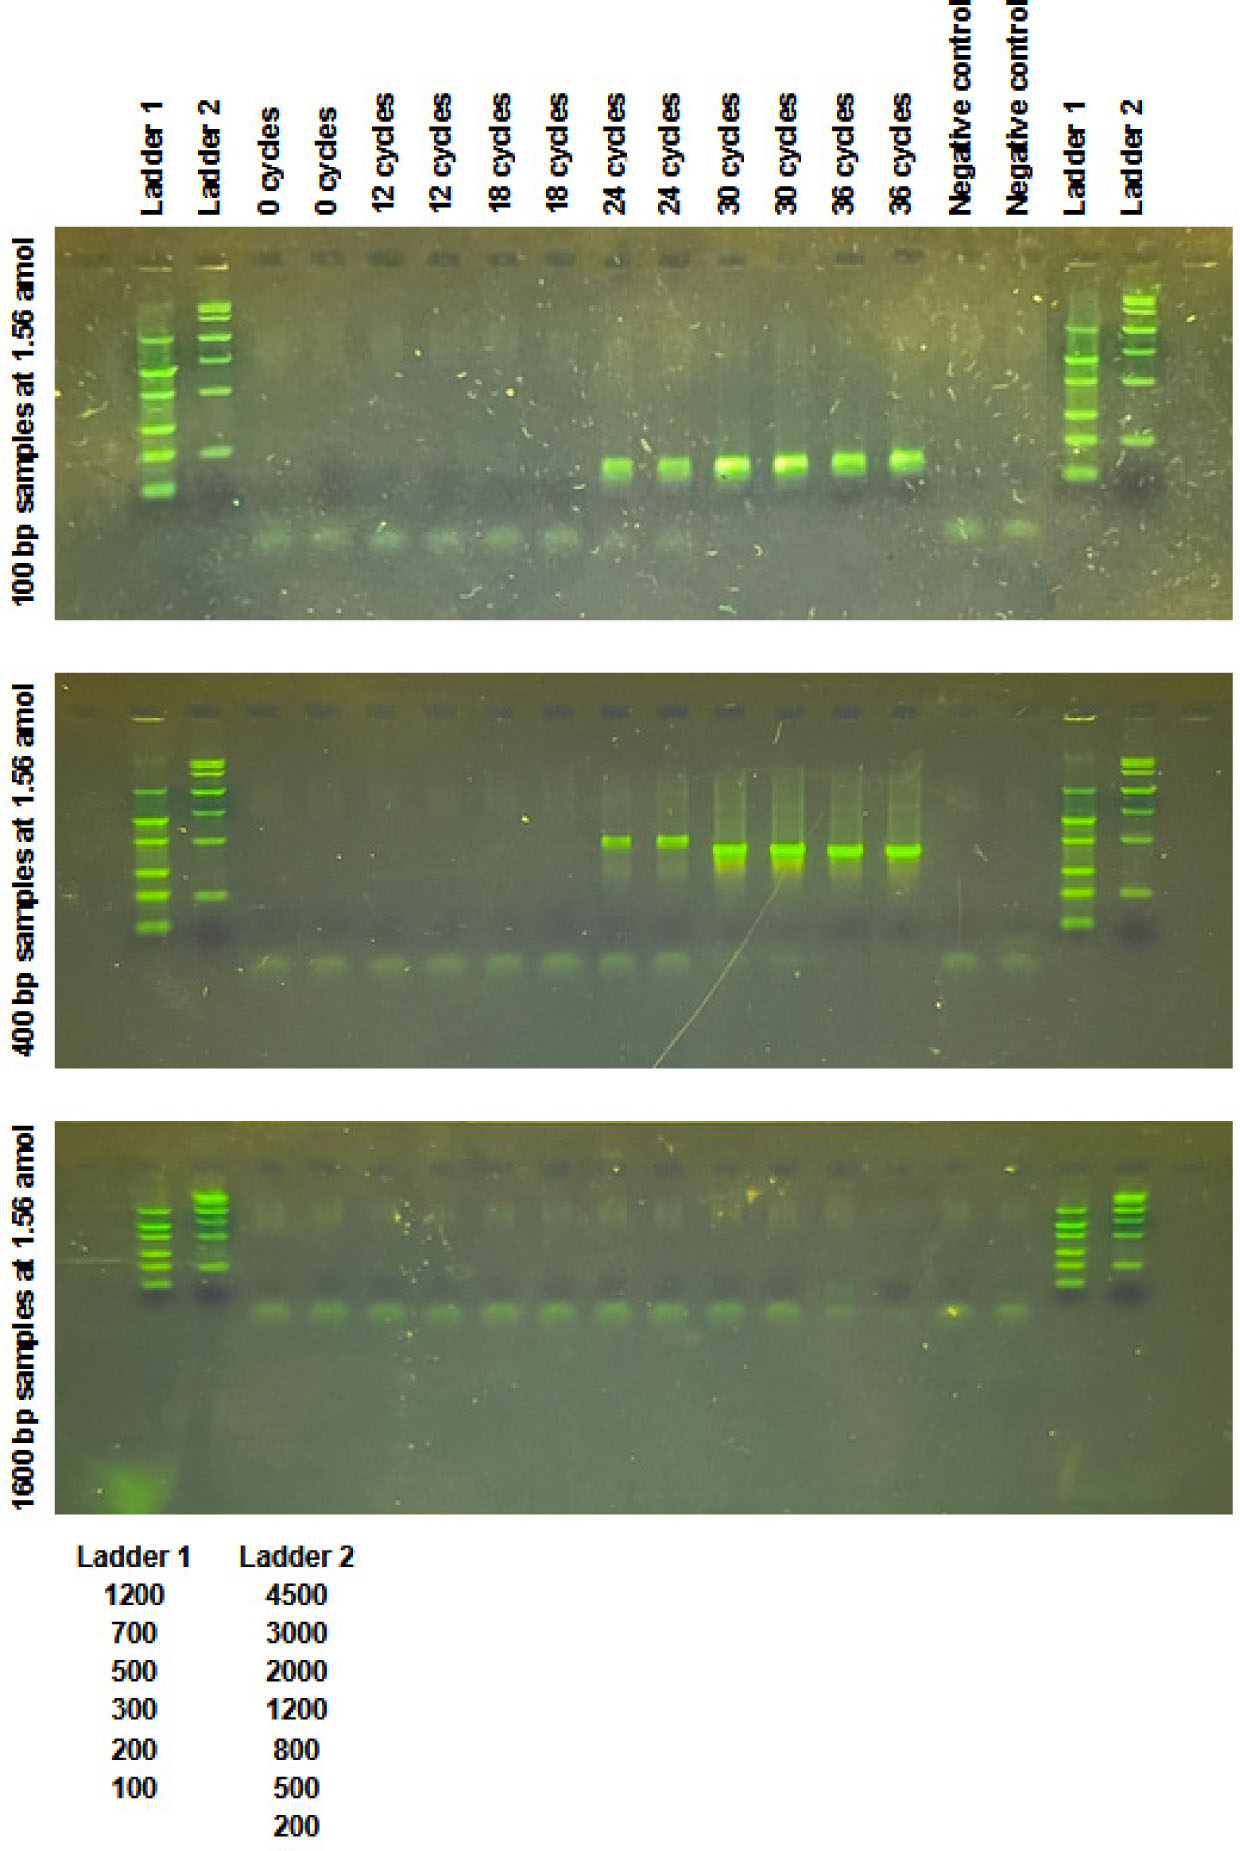
Figure S8.
Gel electrophoresis confirmation of fluoPCR-amplified ground samples during PCR progression. 100-, 400-, and 1600-bp samples at 1.56 amol, along with a negative control containing no template DNA, were amplified in duplicate. Samples were collected for gel electrophoresis at 6-cycle intervals, beginning at cycle 12 and continuing through cycle 36 (negative controls were only analyzed after 36 cycles). Gel electrophoresis was performed at 135 V for 10–20 minutes on a 2% agarose gel stained with GelGreen® and containing two DNA ladders for molecular weight estimation. Gel images were captured under blue illumination.
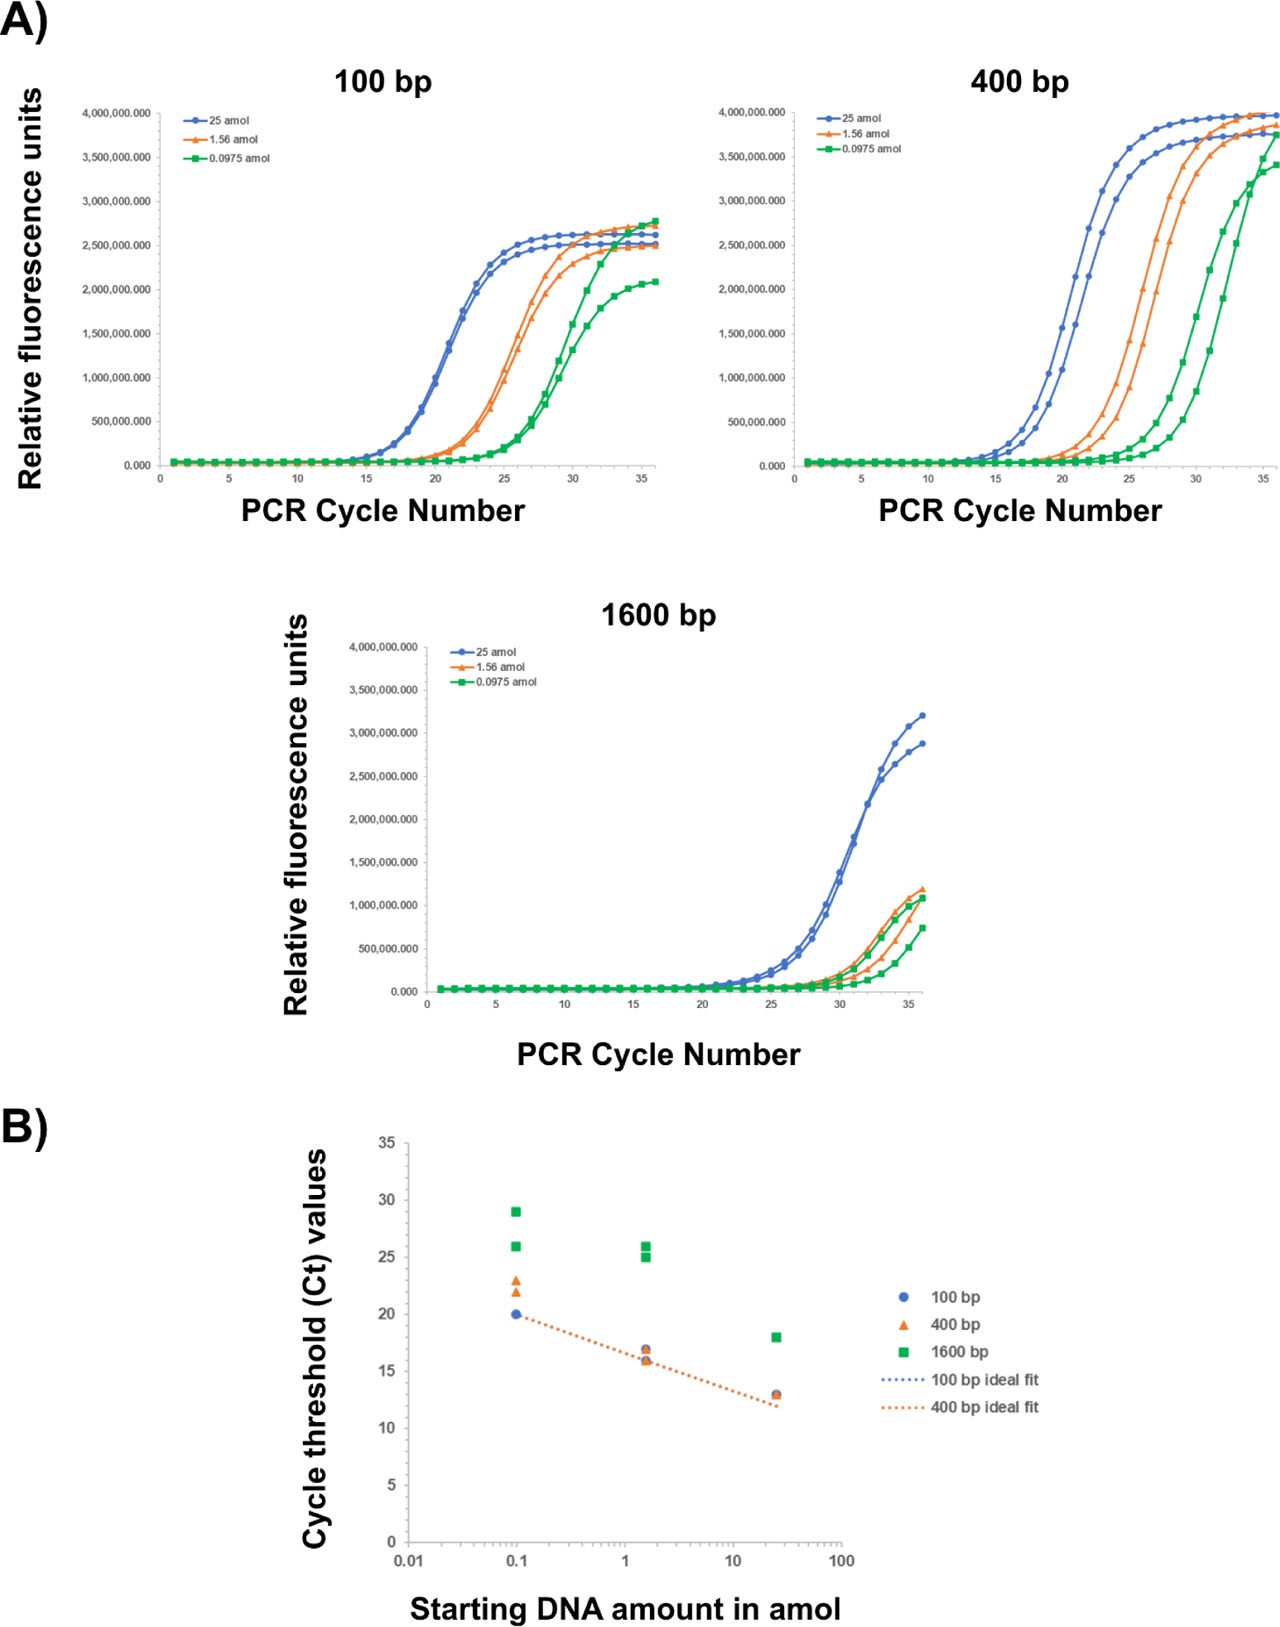
Figure S9.
Changes in fluorescence intensity of samples during traditional qPCR.
A) Target sequences of 100-bp (left), 400-bp (right), or 1600-bp (bottom) were amplified in a QuantStudio™ 3 Real-Time PCR at starting amounts of 25 (blue circles), 1.56 (orange triangles), and 0.0975 amol (green squares) in duplicate per condition. The fluorescent output (relative fluorescence units) was plotted as a function of PCR cycle number. B) Cycle threshold (Ct) values were calculated for each duplicate sample. Trendlines were fit onto the plot to represent the expected 4-cycle difference in Ct between adjacent 100- or 400-bp samples, assuming perfect PCR efficiency. The trendlines and some duplicate samples overlap and appear as a single point or line.
Supplementary Table 2:
Comparison of standard deviation between duplicates from the 100- and 400-bp samples from the fluoPCR and qPCR runs. Standard deviations were calculated with √[ Σ(xi − x̄)2 / (n−1) ] for each set of conditions.
| Standard deviation of spaceflight fluoPCR samples between duplicates | ||
| amol | Std dev for 100-bp | Std dev for 400-bp |
| 25 | 0.00 | 0.00 |
| 1.56 | 1.41 | 0.00 |
| 0.0975 | 0.00 | 0.00 |
| Standard deviation of ground fluoPCR samples between duplicates | ||
| amol | Std dev for 100-bp | Std dev for 400-bp |
| 25 | 0.00 | 1.41 |
| 1.56 | 0.00 | 0.00 |
| 0.0975 | 0.00 | 1.41 |
| Standard deviation of ground qPCR samples between duplicates | ||
| amol | Std dev for 100-bp | Std dev for 400-bp |
| 25 | 0.00 | 0.00 |
| 1.56 | 0.71 | 0.71 |
| 0.0975 | 0.00 | 0.71 |