
Introduction
Nucleic Acid Testing (NAT), a set of techniques for detecting and analyzing specific DNA and RNA sequences, is crucial for biotechnology applications ranging from genetic research to real-time diagnostics. The capacity to detect, identify, and analyze genetic material contributes to a more sustainable human presence in space (Castro-Wallace, 2017). During spaceflight, NAT can help assess changes in the genomes and gene expression profiles of humans and other organisms exposed to increased radiation (Thirsk, 2009; Furukawa, 2020; Luxton, 2020). NAT can also be used to monitor space dwellings to detect microorganisms or other biological hazards.
On Earth, a gold-standard NAT method is the polymerase chain reaction (PCR). PCR can detect and amplify a specific target sequence from a complex DNA sample, quickly producing billions of copies. These copies, or amplicons, can be detected by optical methods (Garibyan, 2013). In 2016, PCR was first validated aboard the ISS during the Genes-in-Space-1 investigation, establishing the feasibility of genetic research and diagnostics in space (Boguraev, 2017).
However, detection of PCR amplicons is typically binary (presence or absence of the target sequence) rather than quantitative. Quantitative PCR (qPCR) is a common advanced NAT method that combines PCR with a fluorescent dye, which is analyzed optically to directly quantify the amount of amplified DNA (Garibyan, 2013; Adams, 2020). qPCR has become the standard method for quantitative genetic analyses. While qPCR has previously been performed on the ISS (Parra, 2017), the current workflow requires complex machinery and analytical expertise to run and interpret the results.
Here, we present an initial characterization of fluoPCR, a simpler alternative to qPCR, for use on the ISS and other resource-limited habitats. The fluoPCR workflow components have all been previously validated on-orbit: the miniaturized miniPCR® thermal cycler to amplify target DNA sequences (Boguraev, 2017; Montague, 2018; Rubinfien, 2020), the Genes in Space Fluorescence Viewer (GIS Viewer) to image sample fluorescence (Misquitta, 2024; Kocalar, 2024), and in silico data analysis of the fluorescent output (Misquitta, 2024; Kocalar, 2024). Our investigation aimed to characterize fluoPCR’s detection capabilities across a range of DNA target sequences and determine whether the resulting outputs recapitulate qPCR features. Validation of the fluoPCR assay can help expand capabilities for onboard diagnostics, environmental monitoring, and genetics research, while reducing payload and operational requirements for ISS and other spacecraft.
Materials and Methods
Target Design and Assembly
A 400-base pair (bp) sequence in the 5677 bp pMaI-c5x plasmid (New England Biolabs) was used as the target sequence. To obtain the 100- and 1600-bp targets, Golden Gate Assembly was used to insert a 100- or 1600-bp sequence compatible with the amplification primers into new plasmid backbones to create the 2626 bp GIS1 plasmid and the 4299 bp GIS2 plasmid. Both cloned plasmids were confirmed to contain the target sequences via high-throughput sequencing.
PCR Amplification
The reactions contained qPCR Master Mix with the DNA-binding dye EvaGreen®, plasmids with the target sequences, and corresponding primers (Table S1). Each target sequence was tested at three starting amounts: 0.0975 amol, 1.56 amol, and 25.0 amol, plus a negative control lacking DNA. (Figure 1A). Each sample was only tested in duplicate due to limited spaceflight resources.
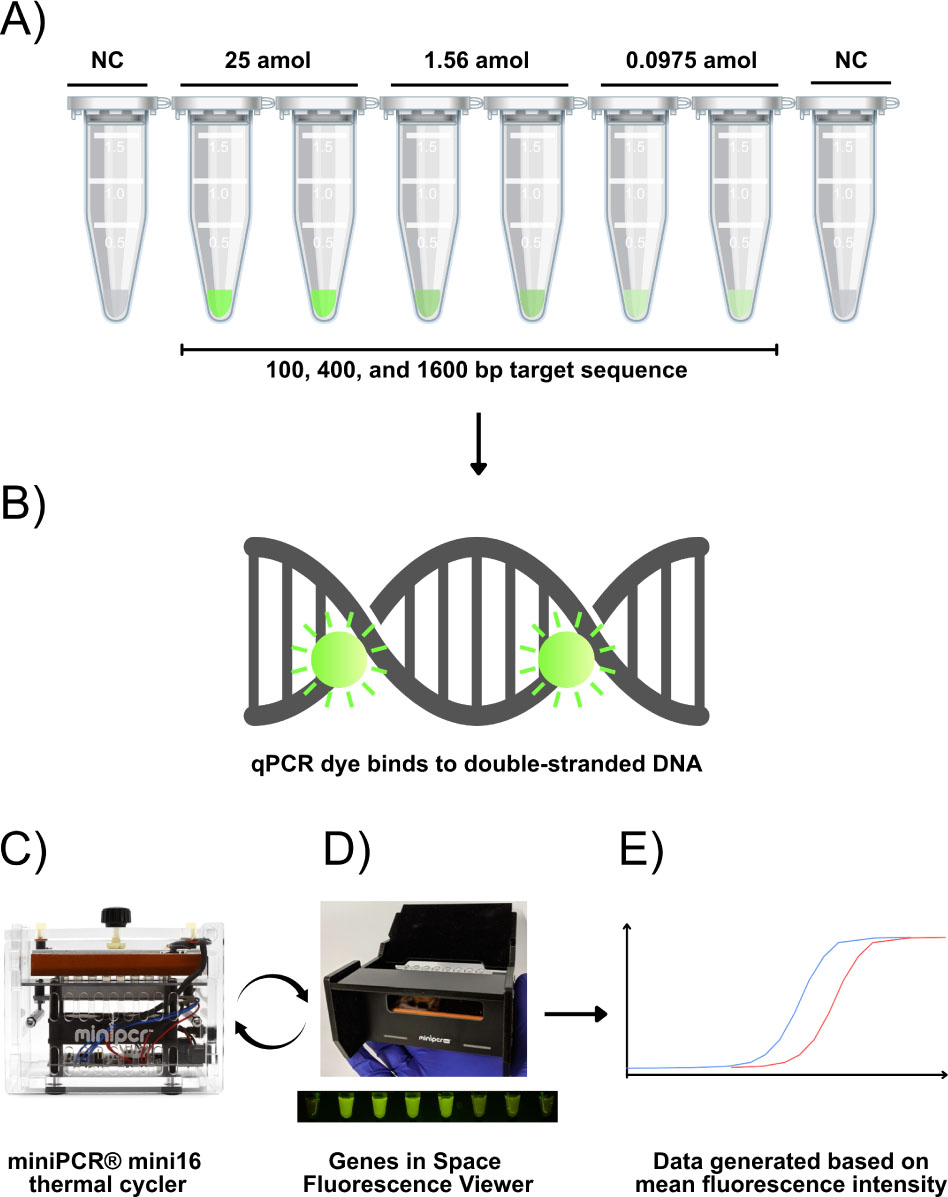
Figure 1.
Diagram of fluoPCR workflow. A) Samples with 100-, 400-, or 1600-bp target sequences at amounts of 25, 1.56, or 0.0975 amol were combined with B) qPCR reagents and C) were amplified with the miniPCR® thermal cycler, and D) were periodically transferred to the GIS Viewer for image capture at regular intervals during amplification cycles. E) The images were later analyzed to measure fluorescence.
The samples were amplified in the miniPCRⓇ mini16 thermal cycler according to the parameters in Table 1. The run was monitored via the connected miniPCRⓇ application on a Windows computer. Every two PCR cycles (starting at cycle 2 for the 100- and 400-bp targets and cycle 18 for the 1600-bp target), the PCR program was paused during the extension step. The samples were transferred to the GIS Viewer for light excitation at 470 nm and image capture of the resulting 530 nm fluorescence from the dye binding to amplified DNA. After image capture, the samples were returned to the miniPCR® thermal cycler to resume PCR. This was repeated through a total of 36 PCR cycles (34 for the 1600-bp samples).
Table 1.
Parameters for PCR amplification of the target sequences.
| Step | Time (s) | Temperature (°C) |
|---|---|---|
| 1. Initial Denaturation | 60 | 94 |
| 2. Denaturation | 8 | 94 |
| 3. Annealing | 8 | 55 |
| 4. Extension | 8 | 72 |
| 5. Transfer to GIS Viewer and Image Capture | ||
| Every two PCR cycles (starting at cycle 2 for the 100- and 400-bp targets and cycle 18 for the 1600-bp target) | ||
| 6. Reinsert in miniPCR and repeat steps 2-5 | 36 cycles | |
| 7. Final Extension | 300 | 72 |
This protocol was performed both aboard the ISS and on Earth. Samples were prepared one week before launch and stored at −80 °C until assay execution. All captured spaceflight images were transmitted to Earth for data analysis. Assay execution with Earth samples took place within 30 days of the spaceflight samples. Finished PCR products were also returned to Earth for validation via gel electrophoresis to confirm amplicon size.
A replicate of the sample conditions was also amplified on a QuantStudio™ 3 Real-Time PCR System (ThermoFisher) on Earth using the same PCR parameters in Table 1.
Image Capture and Analysis
Image capture was performed via the Yamera application (AppMadang) installed on an iPad Pro® attached to the GIS Viewer set at 72 °C. The Yamera application was set to the following camera settings: aspect ratio 4:3; focus locked at 0.1; shutter between 1/36 and 1/40; ISO at 700 ± 10; tint at −150; and color temperature at 4179 ± 5.
Analysis of the captured images was done with ImageJ (National Institutes of Health). Images were converted to an 8-bit form, and for each sample tube, a mean gray value corresponding to fluorescence intensity was obtained (Stark, 2019). The mean gray values were plotted against the corresponding PCR cycle number (Figure 2A, S4, S5).
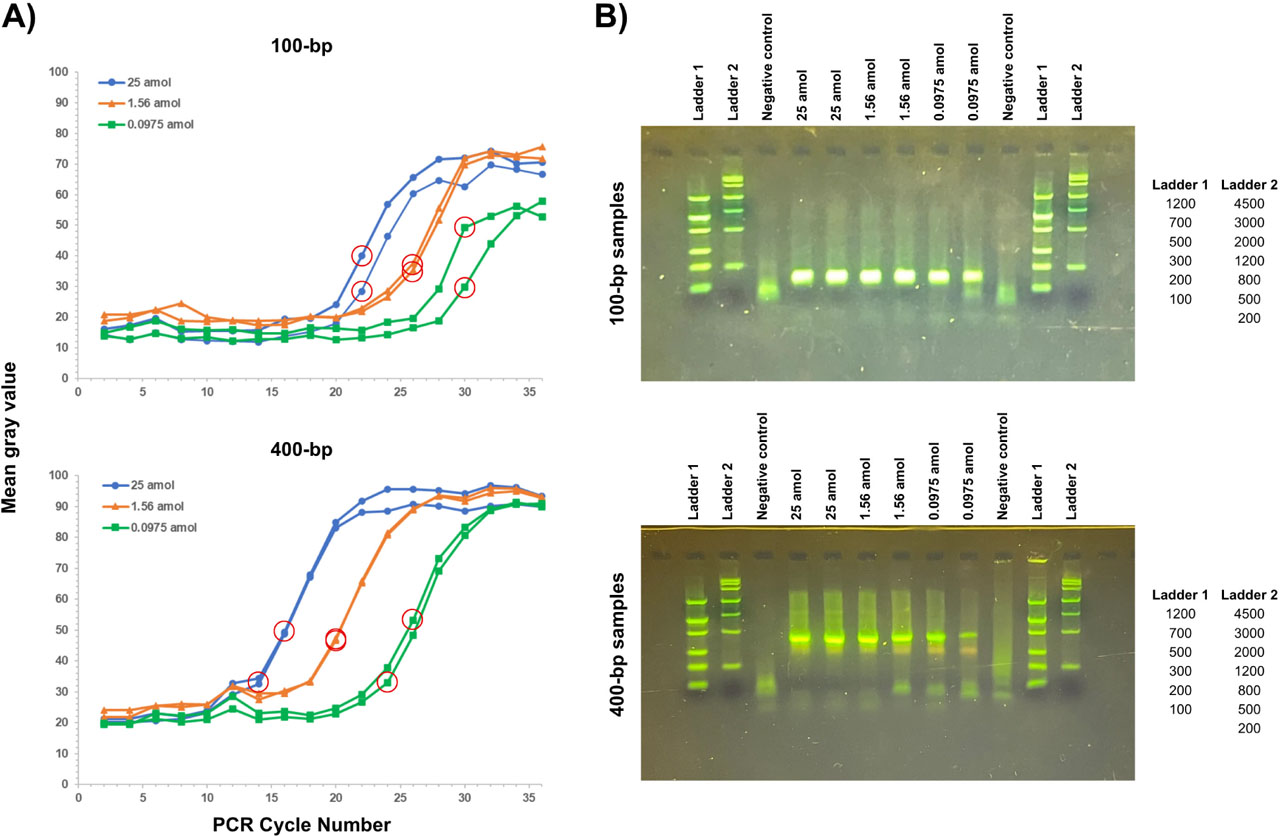
Figure 2.
A) Changes in fluorescence intensity of spaceflight samples during fluoPCR cycles. Target sequences of 100-bp (top) or 400-bp (bottom) at starting amounts of 25 (blue circles), 1.56 (orange triangles), or 0.0975 amol (green squares) were PCR-amplified in duplicate. Fluorescence intensity (mean gray value) was calculated every two PCR cycles. The calculated Ct values (red circles) for the 100-bp target were 20 for both 25 amol duplicates, 22 and 24 for the 1.56 amol duplicates, and 28 for both 0.0975 amol duplicates; for the 400-bp target, 16 for both 25 amol duplicates, 20 for both 1.56 amol duplicates, and 26 for both 0.0975 amol duplicates. B) Ground-based gel electrophoresis of fluoPCR-processed spaceflight 100- and 400-bp samples to confirm target sequence amplification. After sample return, the resulting fluoPCR products after 36 cycles (100-bp on the top, 400-bp on the bottom) were electrophoresed at 135 V for 10–20 min on a 2% agarose gel stained with GelGreen®. Two DNA ladders were included for molecular weight estimation, and gel images were captured under blue illumination.
Cycle Threshold (Ct) Calculation
The cycle threshold (Ct) values of all individual experimental samples were calculated with reference to standard Ct calculations (Ruiz-Villalba, 2021). A fluorescence threshold for each individual sample was determined by taking the mean of its baseline outputs (cycles 2–10 for the 100- and 400-bp target sequences, and cycles 18–22 for the 1600-bp target sequence) and adding a value of ten times its standard deviation. The Ct value was then determined as the PCR cycle number at which the output exceeded its fluorescence threshold, and this value was plotted against the sample starting amount (Figures 3, S6). Trendlines were fitted onto the plots to represent the expected 4-cycle difference in Ct between samples in the 16-fold dilution series, assuming 100% PCR efficiency (Figures 3, S9B). Note: Some baseline cycles (cycles 6, 8, and 12 of the space 100-bp samples) were excluded from analysis due to improper image capture.
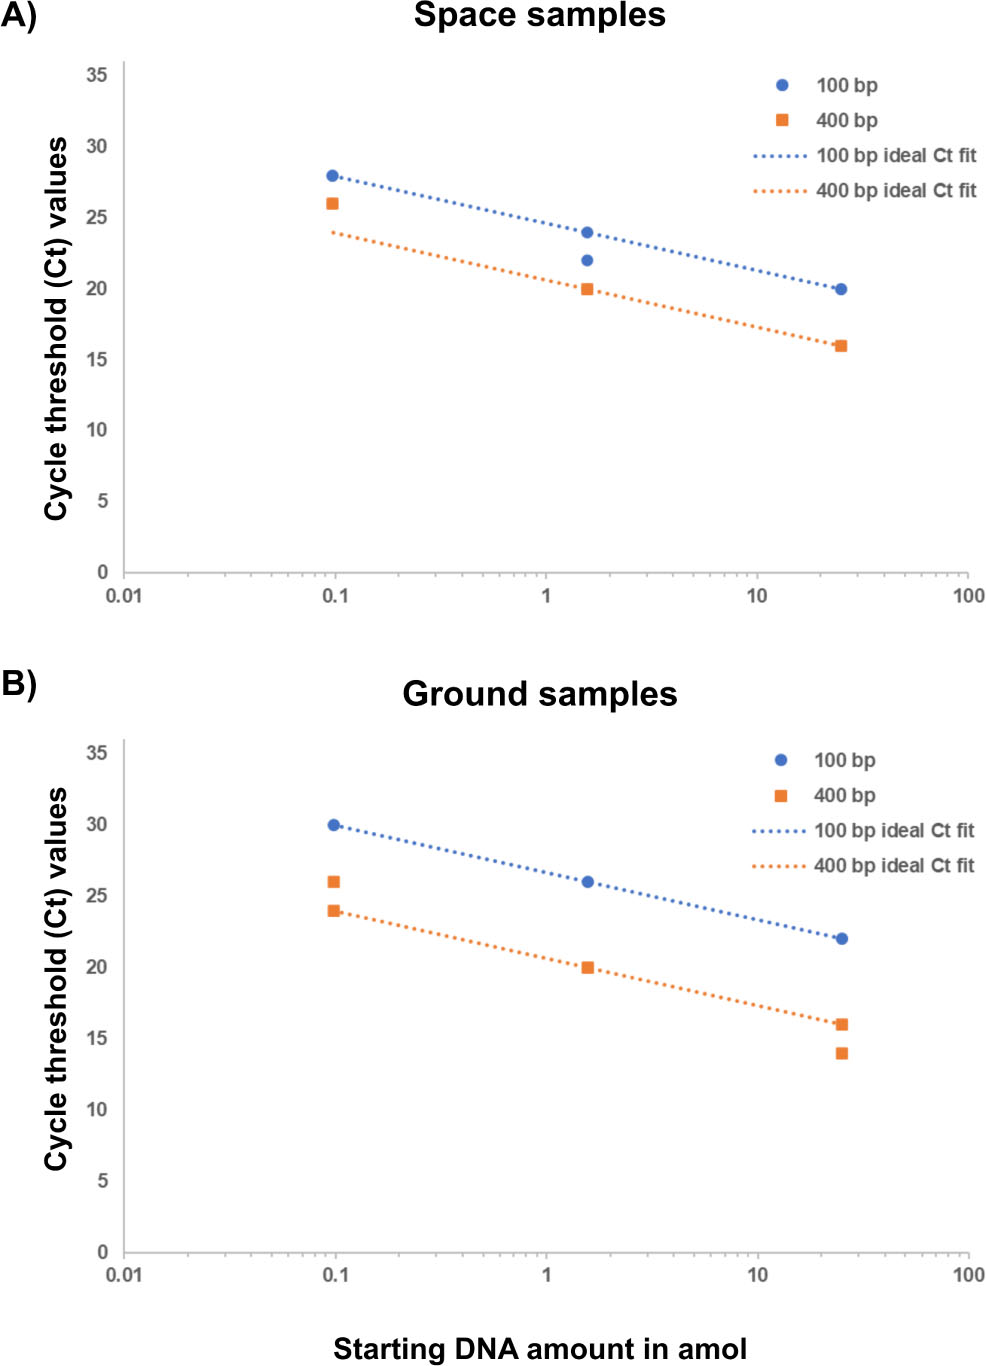
Figure 3.
Comparison of cycle threshold (Ct) values between A) spaceflight and B) ground control samples. Ct values were calculated for each duplicate sample (100-bp in blue circles and 400-bp in orange squares). Some duplicate samples overlap and appear as a single point. Trendlines were fit onto the plot to represent the expected 4-cycle difference in Ct between adjacent 100- or 400-bp samples, assuming perfect PCR efficiency.
Results
To characterize the fluoPCR assay across a range of DNA target sizes, we tested two target DNA sequences: 100-base pairs (bp) and 400-bp each at three starting amounts: 0.0975 amol, 1.56 amol, and 25.0 amol (Figure 1A).
When the fluorescence intensity outputs from fluoPCR results were plotted as a function of cycle number, they resembled sigmoidal curves typical of qPCR for both 100- and 400-bp sequences at all 3 starting amounts (Figures 2A). The images also accurately captured changes in fluorescence intensity across cycles (Figures S1, S2). Additionally, in line with typical qPCR results, the fluoPCR cycle threshold (Ct) values (the cycle at which the output exceeds baseline fluorescence) increased as the amount of starting target DNA assayed decreased for the 100-bp target tested in duplicate: Ct of 20 for both 25 amol duplicates, Ct of 22 and Ct of 24 for each of the 1.56 amol duplicates, and Ct of 28 for both 0.0975 amol duplicates (Figure 3A). This was also observed for the 400-bp target: Ct of 16 for both 25 amol duplicates, Ct of 20 for both 1.56 amol duplicates, and Ct of 26 for both 0.0975 amol duplicates (Figure 3A). For both the 100- and 400-bp sequences, ground-based gel electrophoresis of downmassed endpoint spaceflight samples confirmed that the majority of the DNA represented unique amplicons matching the expected sizes of each target DNA, with little or no spurious amplification, strongly suggesting that the fluorescence increases resulted from the accumulation of the expected amplicons (Figure 2B). The intensity of the gel bands increased with the number of PCR cycles (Figure S8).
Ground control fluoPCR samples yielded results comparable to those of the spaceflight samples, resembling qPCR curves for both the 100- and 400-bp samples (Figure S4). The ground samples also yielded inversely proportional relationships between initial target amounts and Ct values: the 100-bp ground samples had a Ct of 22 for both 25 amol duplicates, Ct of 26 for both 1.56 amol duplicates, and Ct of 30 for both 0.0975 amol duplicates, while the 400-bp ground samples had a Ct of 16 or Ct of 14 for each 25 amol duplicate, Ct of 20 for both 1.56 amol duplicates, and Ct of 24 or Ct of 26 for each 0.0975 amol duplicate (Figure 3B).
The same set of samples was assayed using standard qPCR for comparison (Figure S9). As expected, qPCR yielded inversely proportional relationships between target amounts and Ct values: the 100-bp ground samples had a Ct of 13 for both 25 amol duplicates, Ct of 16 or 17 for each 1.56 amol duplicate, and Ct of 20 for both 0.0975 amol duplicates, while the 400-bp ground samples had a Ct of 13 for both 25 amol duplicates, Ct of either 17 or 16 for 1.56 amol, and Ct of 22 or Ct of 23 for each 0.0975 amol duplicate (Figure S9).
A third target sequence of 1600-bp, significantly longer than typical qPCR target sequences, served to test the limits of our assay parameters. Despite attempting to optimize its amplification by running the PCR protocol continuously for an initial 18 cycles without interruptions for image capture, the 1600-bp samples displayed consistently low fluorescence (Figure S3), lacked the typical sigmoidal qPCR curve (Figures S5, S9A), yielded uninformative Ct values (≥32, Figures S6, S9B), and did not yield consistent results by gel electrophoresis (Figures S7, S8).
Discussion
We performed an initial evaluation of the fluoPCR assay as a low-complexity alternative for qPCR under microgravity conditions. This technical demonstration evaluated whether fluoPCR could quantitatively resolve serial decreases in target DNA concentrations across different amplicon lengths, reproducing the core diagnostic behavior of qPCR.
The validation tested three target DNA sequences, with successful amplification of the 100-bp and 400-bp sequences and unsuccessful amplification of the 1600-bp sequence. Our results demonstrate that 100-bp and 400-bp target sequences could be specifically amplified and quantitatively detected with fluoPCR in space and on the ground. Gel electrophoresis analysis confirmed that the progressive increase in the fluoPCR signal correlated with cumulative amplification of the 100- and 400-bp targets under all conditions. For both amplicon sizes, we obtained qPCR-like fluorescence traces consistent with exponential amplification and recapitulating features of standard qPCR curves generated from the same samples. The resulting Ct values were inversely proportional to the starting amounts of target DNA.
A specific feature of qPCR is that, under ideal conditions, each cycle doubles the amount of amplicon DNA, such that a twofold difference in starting concentrations between two samples corresponds to a one-cycle difference in their Ct values (Ruiz-Villalba, 2021). The starting amounts of the target DNA sequences used in our experiments were 25, 1.56, and 0.0975 amol, corresponding to a 16-fold dilution series, designed to yield 4-cycle differences in Ct between adjacent samples. We found that this 4-cycle relationship largely held for 100-bp samples amplified in space, with Ct values falling on or near the trendline, consistent with the ideal 4-cycle relationship. The highest target amount (25 amol) yielded Ct values of 20 for both duplicates, followed by Ct of 22 or 24 for each replicate of the intermediate target amount (1.56 amol), and Ct of 28 for both duplicates of the lowest target amount (0.0975 amol). Ground-tested equivalents had consistent Ct values of 22, 26, and 30, respectively, maintaining the expected 4-cycle separation.
Similarly, for the 400-bp samples, we obtained consistent Ct values of 16, 20, and 26 for space-amplified high-, intermediate-, and low-amount samples. The slight deviation from the ideal 4-cycle relationship could be due to a limiting biochemical step during amplification of a larger target or procedural inefficiencies during fluoPCR. Ground controls yielded Ct values of 14 or 16 for the high starting amount of 400-bp target, a consistent Ct value of 20 for intermediate amounts, and Ct values of 24 or 26 for the low target amount.
Overall, our fluoPCR results from the 100-bp and 400-bp samples satisfactorily recapitulate key features of exponential PCR amplification at both target sequence lengths. It is important to note that even standard qPCR does not always yield ideal exponential amplification (Ruiz-Villalba, 2021). The same samples run on standard qPCR also yielded Ct values that deviated only slightly from the expected 4-cycle spacing: 13, 16, or 17, and 20 for the 100-bp target; 13, 16, or 17, and 22 or 23 for the 400-bp target. When comparing the precision and robustness of fluoPCR against qPCR, samples showed little to no deviation in Ct values between duplicates. Overall, qPCR showed less variability, likely due to its continuous sampling compared with fluoPCR’s two-cycle sampling interval (Table S2).
A 1600-bp target exceeded the dynamic range of the current fluoPCR conditions. It produced weak signals that did not recapitulate qPCR hallmarks, unsurprisingly for a target outside the typical qPCR amplicon size range (Debode, 2017; Van Holm, 2021). These results inform expected assay outputs when fluoPCR fails to reliably amplify a target. While DNA sequences this large are unlikely to be desirable targets for fluoPCR or other qPCR-like assays, optimizing cycling parameters may help expand the useful size range of fluoPCR targets in the future.
Given its ability to yield quantifiable outputs consistent with qPCR principles for specific target sequences within the typical qPCR range, we propose that the fluoPCR assay could serve as a versatile alternative to qPCR for genetic investigations or real-time diagnostics in space. All equipment needed for fluoPCR, including the miniPCR® thermal cycler and the GIS Fluorescence Viewer, has been previously validated aboard the ISS (Boguraev, 2017; Misquitta, 2024) and is more versatile than traditional qPCR hardware for portable Earth-based applications. While the sample images captured in the GIS Viewer were transmitted to Earth for analysis, fluoPCR data could be analyzed aboard the ISS using open-source image analysis software on the onboard computers, tablets, or smartphones.
When comparing ground and space samples, some differences were observed, including slightly different Ct values for the same sample condition. We attribute these differences to the small number of replicates due to limited spaceflight resources, limited crew training time on the workflow, user-to-user variation, and subtle hardware differences between the space and ground experiments (Harris, 2016). Higher resolution could also be achieved by collecting optical data every cycle rather than every two cycles. Despite these limitations, the overall relative trends described previously are consistent with expected qPCR behavior across two unique sample sets. This suggests that the initial fluoPCR assay is relatively robust to equipment, user variability, and target DNA sequence, and that further optimization and characterization to address current limitations are likely to enhance its performance.
The fluoPCR assay could enhance future space missions by enabling the detection and quantification of specific nucleic acids entirely aboard the ISS and other space habitats, without the need to return samples to Earth for analysis. The current validation of fluoPCR as a surrogate for qPCR aboard spacecraft makes it a suitable platform for the real-time, onboard diagnostic detection of nucleic acid targets, such as water contaminants, genomic markers of astronaut health, or DNA mutations resulting from space exposure.
Conclusions
This investigation provides initial validation of the fluoPCR workflow as a portable, versatile alternative to qPCR aboard the ISS. As part of the fluoPCR validation, various target DNA sequences and amounts were amplified using the miniPCR thermal cycler, imaged with the GIS Viewer, and quantified based on fluorescence output. Changes in sample fluorescence were calculated using image-processing tools, which were then used to generate standard qPCR outputs, including a fluorescence amplification plot and a Ct value. Successful amplification of 100-bp and 400-bp target sequences yielded results consistent with standard qPCR, whereas a 1600-bp target sequence was confirmed to be outside the informative dynamic range for fluoPCR, also consistent with standard qPCR. Further workflow optimization may include enhanced user training, increased timepoints and replicates to improve robustness, and additional characterization and optimization of the dynamic range.
The fluoPCR workflow could facilitate biological research and molecular diagnostics aboard the ISS, independent of Earth-based laboratories. The assay can be used in various applications, including the investigation of genetic mutations induced by spaceflight conditions and nucleic acid-based detection of microorganisms for diagnostic purposes.
Acknowledgments
We thank Melissa Boyer from The Boeing Company for flight integration support, and NASA Astronauts Frank Roberts, Stephen Bowen, and Woody Hoburg for completing this experiment aboard the ISS. This work was supported in part by New England Biolabs and the ISS National Laboratory.
Notes
[1] Financial disclosure Author Disclosure Statement
A.H., E.A.S., and S.K. are employed by miniPCR bio, manufacturers of the hardware (miniPCR® thermal cycler to amplify target DNA sequences, and the Genes in Space Fluorescence Viewer to visualize results) used in this work. The remaining authors declare no competing financial interests.
Notes
Supplementary Data
Supplementary Table 1:
Assay qPCR reagents and volumes per sample tube.
| Reagent | Volume | Notes |
|---|---|---|
| 2X qPCR Master Mix | 15 μl | |
| Primers (fluoPCR test primer F and fluoPCR test primer R) | 7.5 μl | F: 5′CTGAAGTCTTACGAGGAAGAGTTGG3′ |
| R: 5′TCAGGAGAGCGTTCACCGACAAAC3′ | ||
| DNA volume | 7.5 μl | DNA replaced by water in the negative control |
| Total Volume | 30 μl |
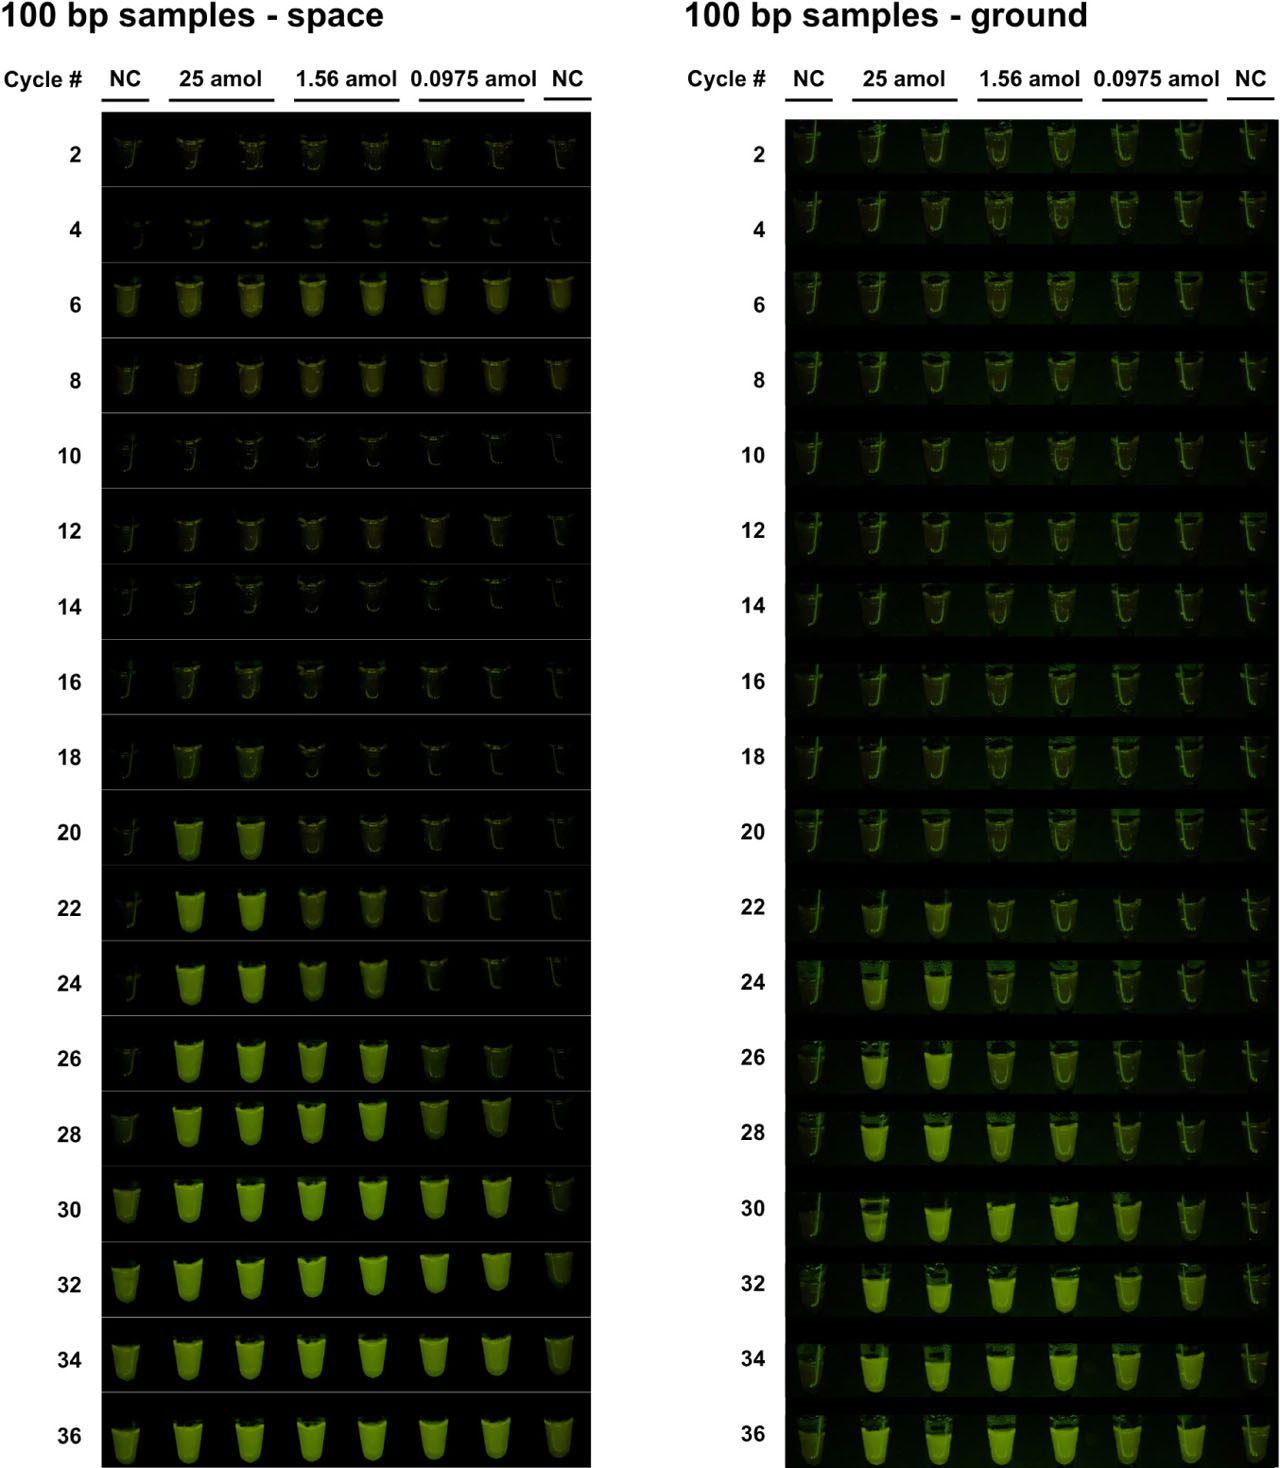
Figure S1.
Images of spaceflight and ground control samples for the 100-bp target sequence every two PCR cycles. Images of the amplified DNA (target sequences of 100-bp at starting amounts of 25, 1.56, and 0.0975 amol, plus negative control) were captured every two PCR cycles (starting at cycle 2 through cycle 36) in the GIS Viewer.
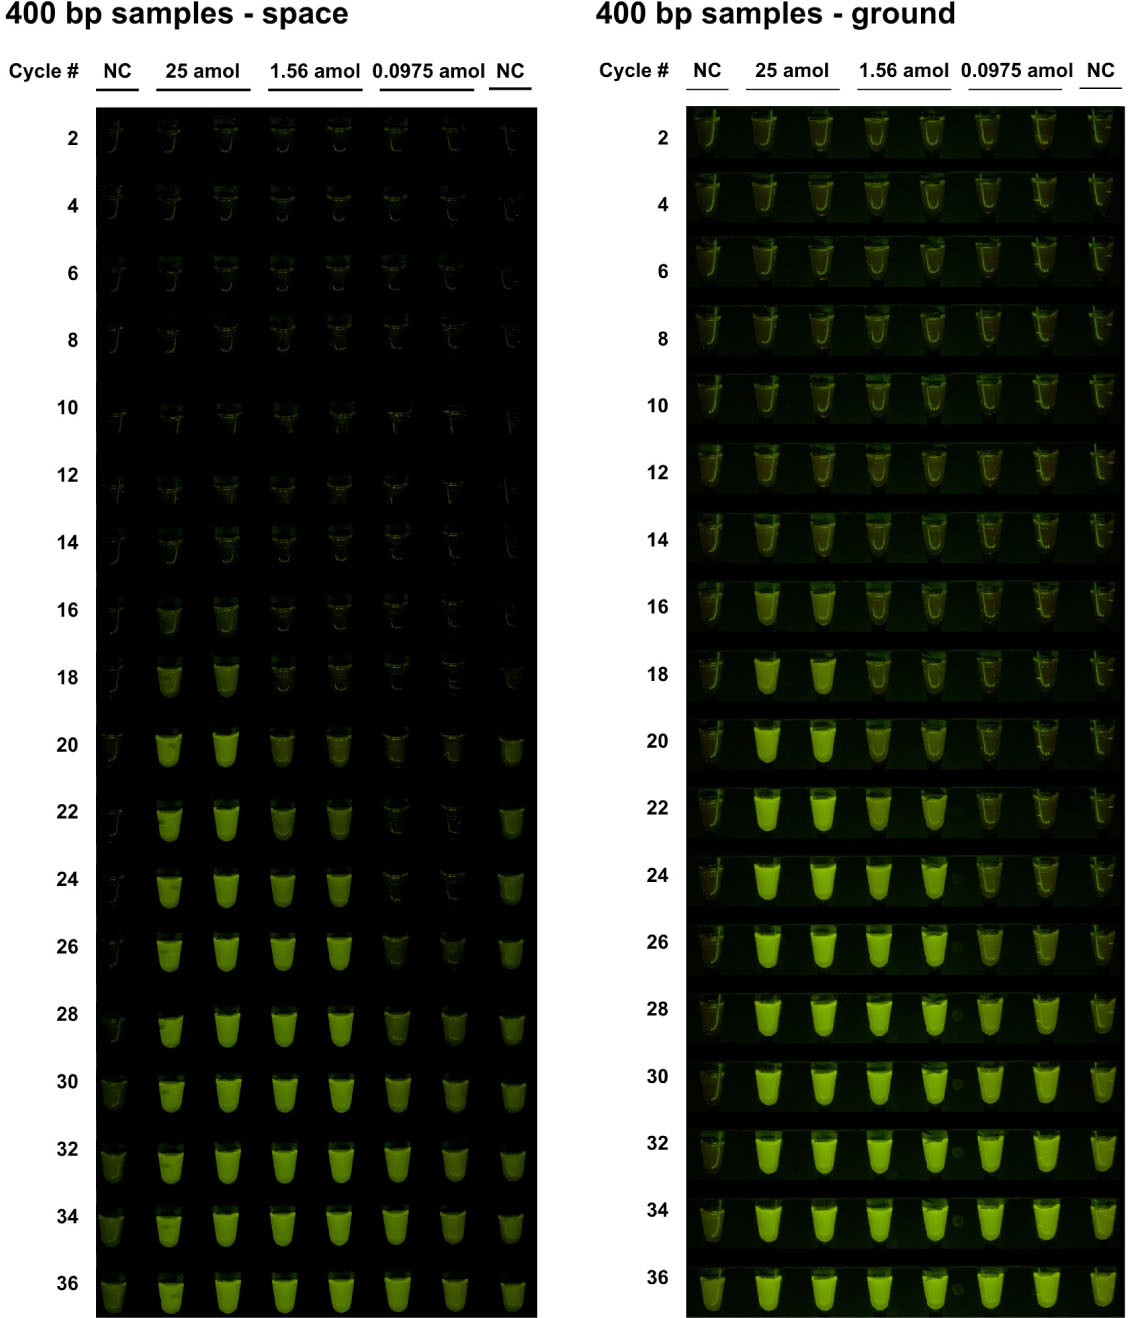
Figure S2.
Images of spaceflight and ground control samples for the 400-bp target sequence every two PCR cycles. Images of the amplified DNA (target sequences of 400-bp at starting amounts of 25, 1.56, and 0.0975 amol, plus negative control) were captured every two PCR cycles (starting at cycle 2 through cycle 36) in the GIS Viewer.
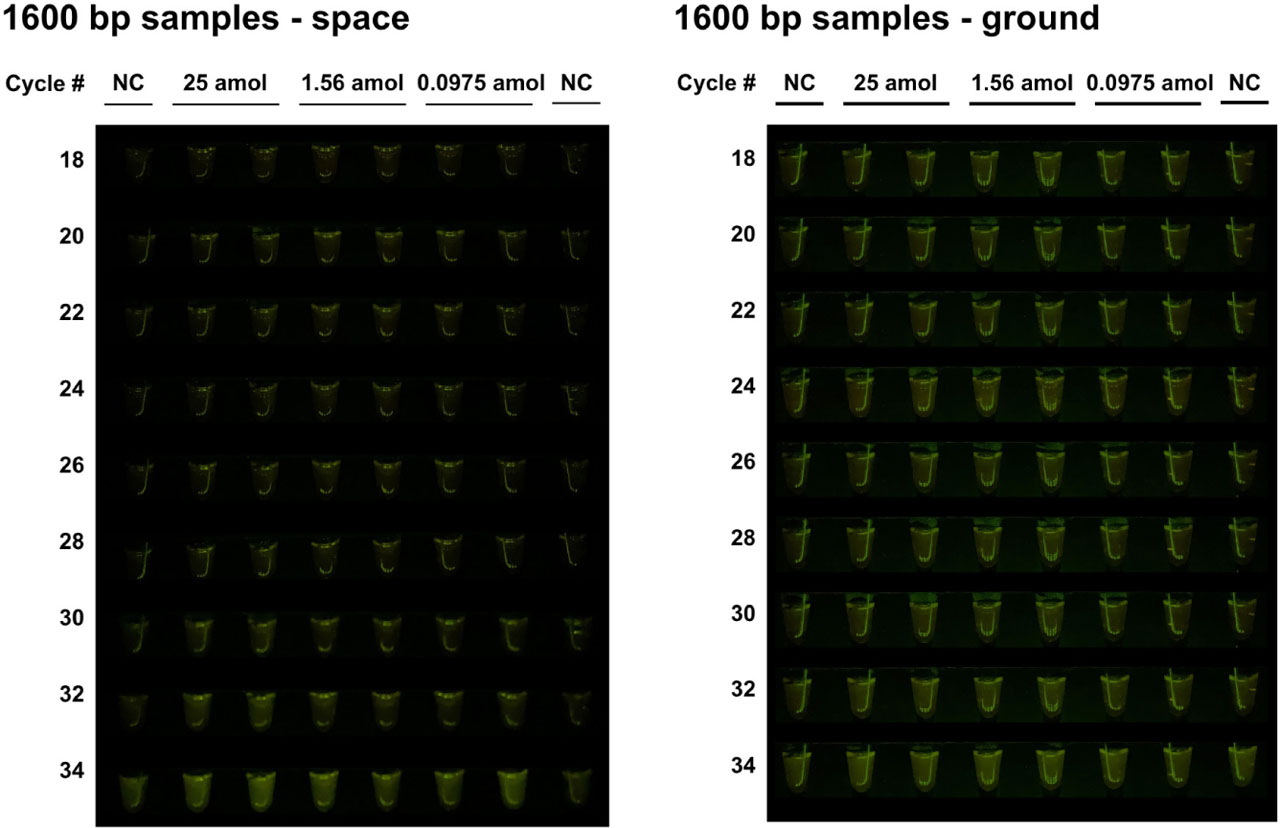
Figure S3.
Images of spaceflight and ground control samples for the 1600-bp target sequence every two PCR cycles. Images of the amplified DNA (target sequences of 1600-bp at starting amounts of 25, 1.56, and 0.0975 amol, plus negative control) were captured every two PCR cycles (starting at cycle 18 through cycle 34) in the GIS Viewer.
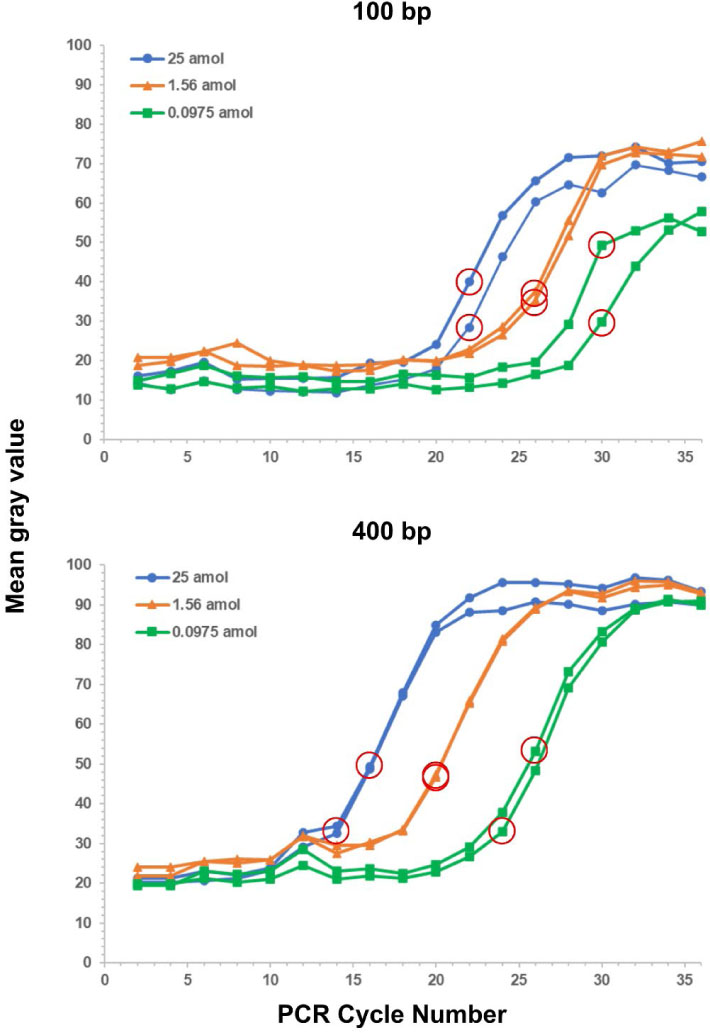
Figure S4.
Changes in fluorescence intensity of ground samples during fluoPCR. Target sequences of 100-bp (top) and 400-bp (bottom) at starting amounts of 25 (blue circles), 1.56 (orange triangles), and 0.0975 amol (green squares) were PCR-amplified in duplicate per condition. Fluorescence intensity (mean gray value) was calculated every two PCR cycles. The Ct values per curve (red circles) for the 100-bp target were 22 for both 25 amol duplicates, 26 for both 1.56 amol duplicates, and 30 for both 0.0975 amol duplicates; for the 400-bp target, Ct values were 16 and 14 for the 25 amol duplicates, 20 for both 1.56 amol duplicates, and 26 and 24 for the 0.0975 amol duplicates.
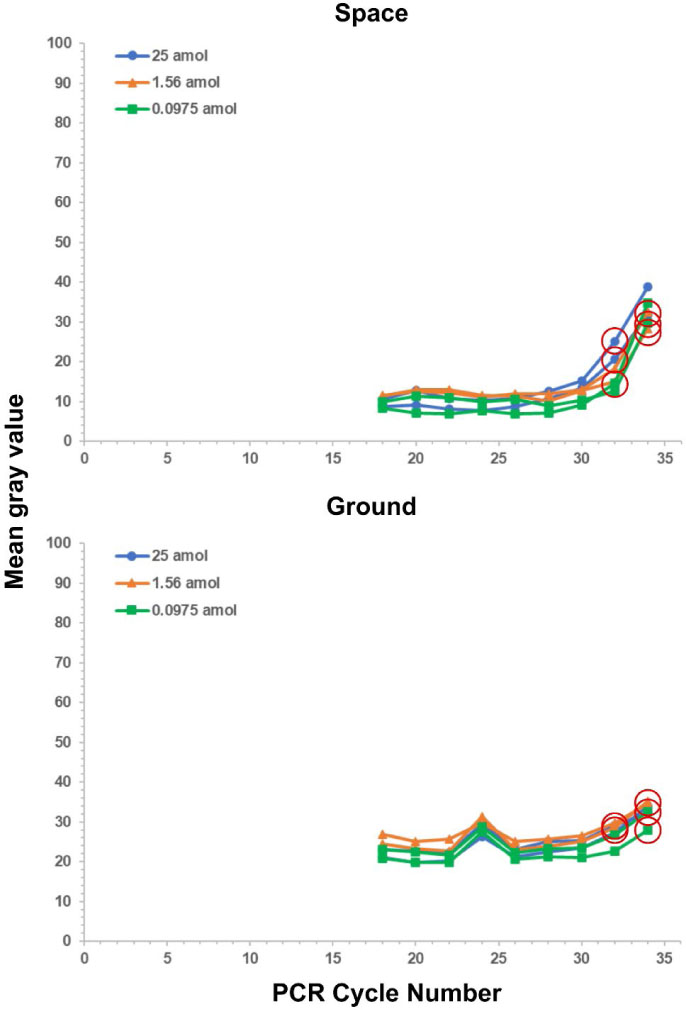
Figure S5.
Changes in fluorescence intensity of 1600-bp samples during fluoPCR. Target sequences of 1600-bp at starting amounts of 25 (blue circles), 1.56 (orange triangles), and 0.0975 amol (green squares) were PCR-amplified in duplicate per condition, with space (top) and ground (bottom). Fluorescence intensity (mean gray value) was calculated every two PCR cycles. The Ct values per curve are circled in red.
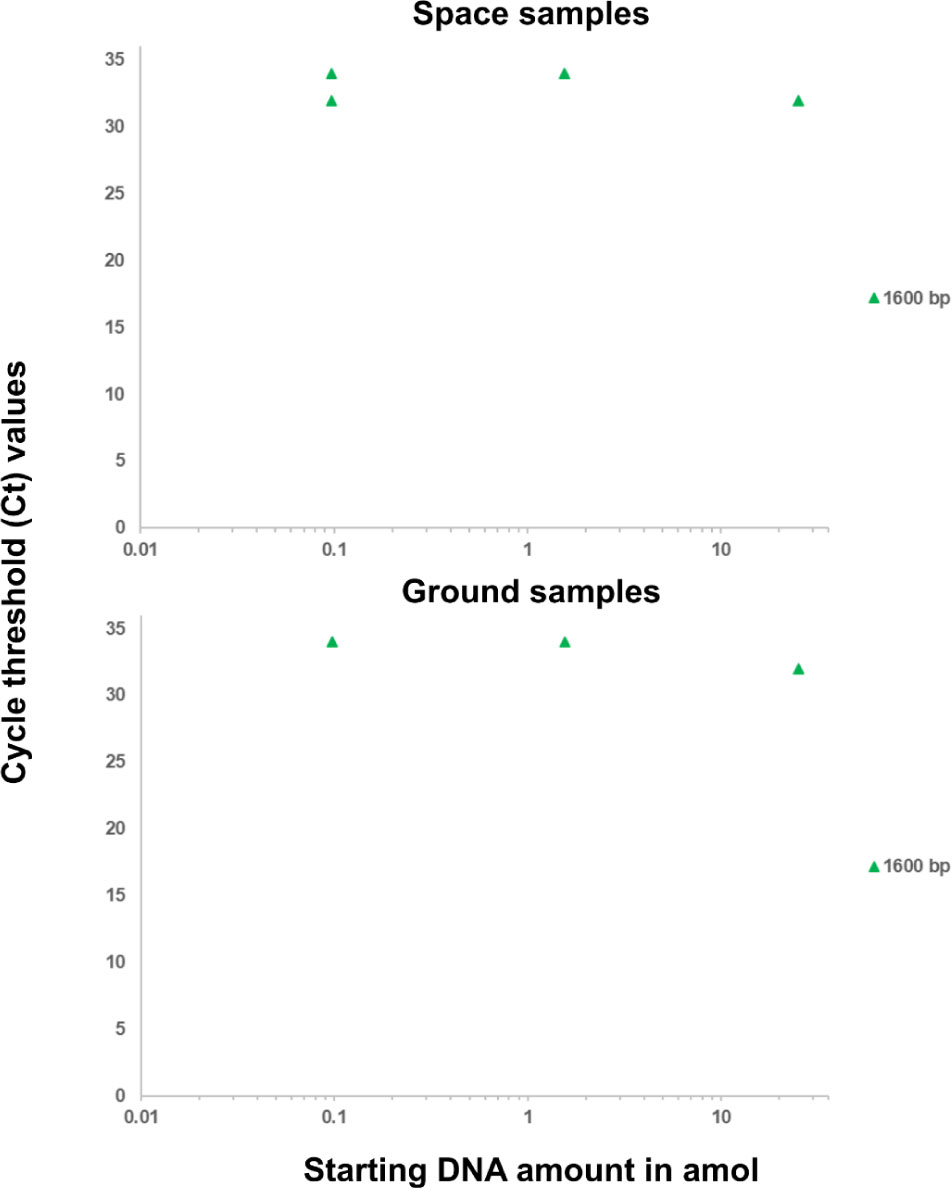
Figure S6.
Comparison of cycle threshold (Ct) values between spaceflight (top) and ground control (bottom) samples for the 1600-bp target. Ct values were calculated for each duplicate sample. Some duplicate samples overlap and appear as a single point.
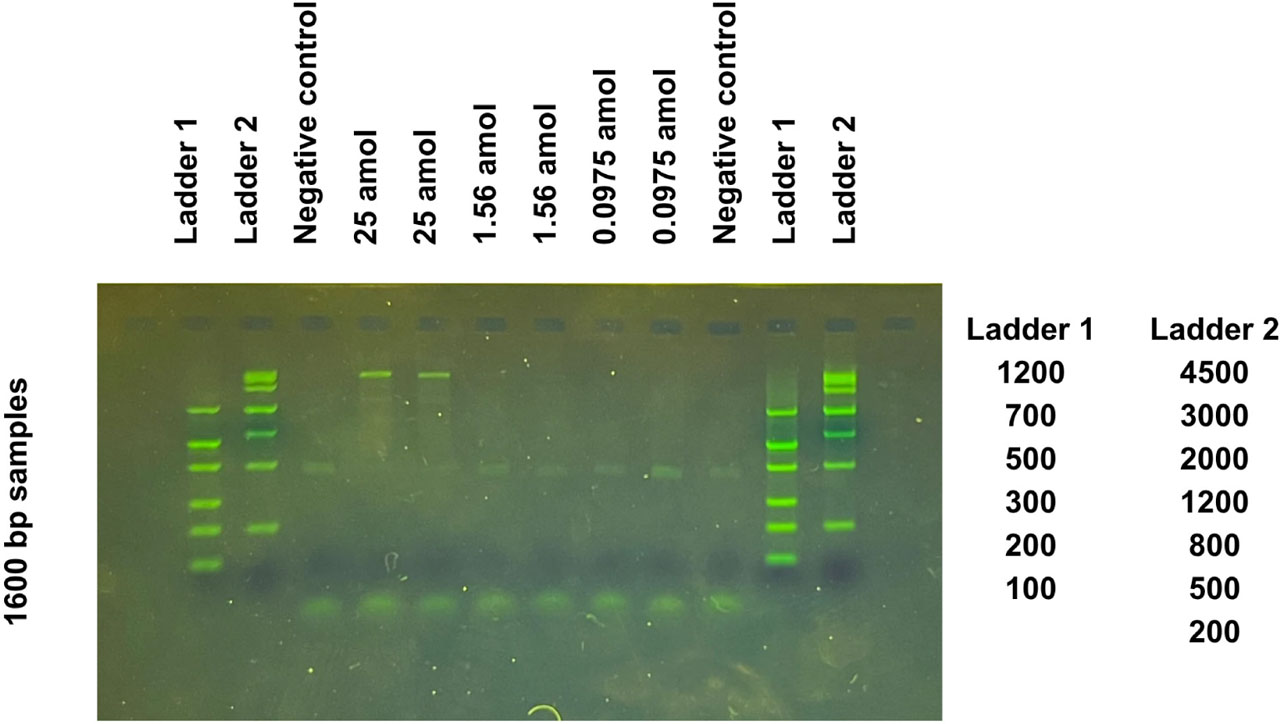
Figure S7.
Ground-based gel electrophoresis of fluoPCR-processed spaceflight 1600-bp samples failed to confirm target sequence amplification. After sample return, the resulting fluoPCR products after 36 cycles were electrophoresed at 135 V for 10–20 min on a 2% agarose gel stained with GelGreen®. Two DNA ladders were included for molecular weight estimation, and gel images were captured under blue illumination.
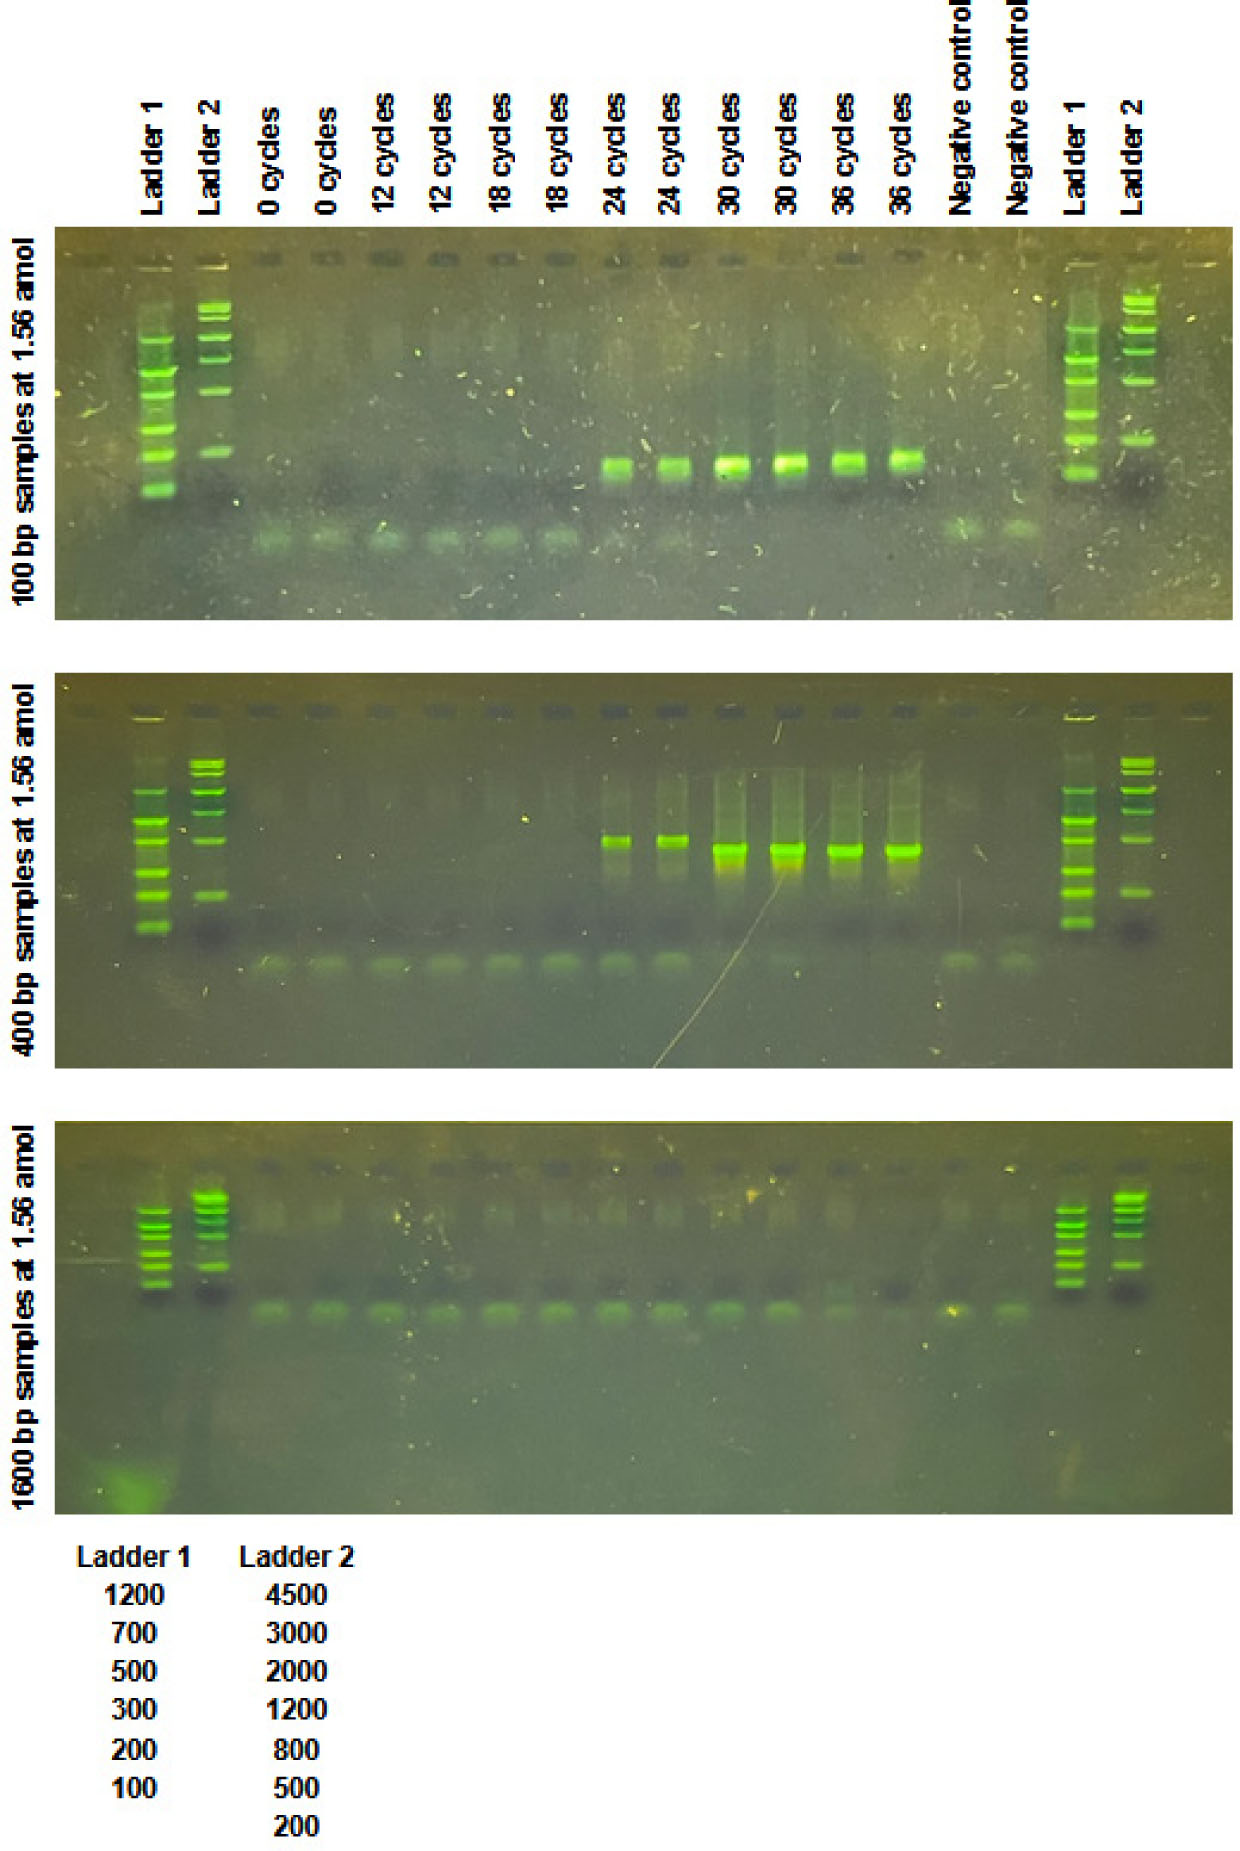
Figure S8.
Gel electrophoresis confirmation of fluoPCR-amplified ground samples during PCR progression. 100-, 400-, and 1600-bp samples at 1.56 amol, along with a negative control containing no template DNA, were amplified in duplicate. Samples were collected for gel electrophoresis at 6-cycle intervals, beginning at cycle 12 and continuing through cycle 36 (negative controls were only analyzed after 36 cycles). Gel electrophoresis was performed at 135 V for 10–20 minutes on a 2% agarose gel stained with GelGreen® and containing two DNA ladders for molecular weight estimation. Gel images were captured under blue illumination.
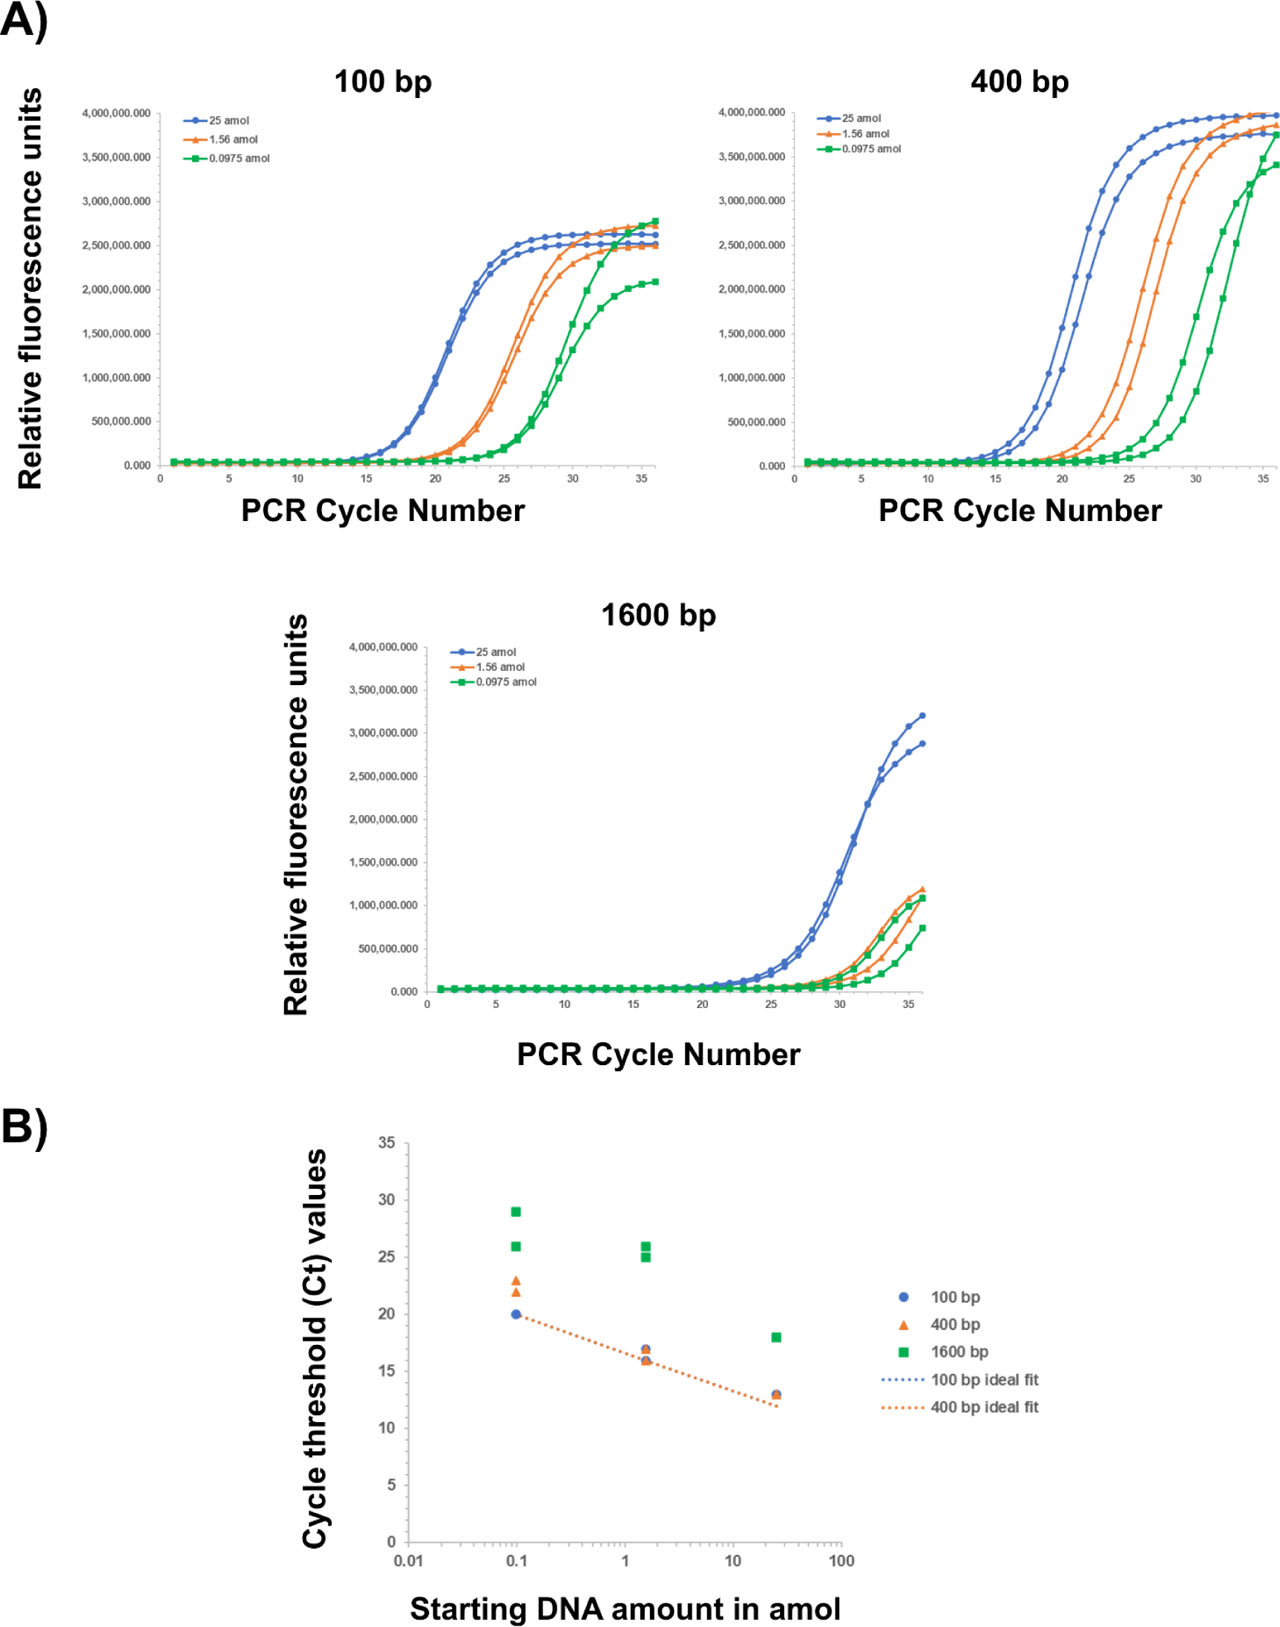
Figure S9.
Changes in fluorescence intensity of samples during traditional qPCR.
A) Target sequences of 100-bp (left), 400-bp (right), or 1600-bp (bottom) were amplified in a QuantStudio™ 3 Real-Time PCR at starting amounts of 25 (blue circles), 1.56 (orange triangles), and 0.0975 amol (green squares) in duplicate per condition. The fluorescent output (relative fluorescence units) was plotted as a function of PCR cycle number. B) Cycle threshold (Ct) values were calculated for each duplicate sample. Trendlines were fit onto the plot to represent the expected 4-cycle difference in Ct between adjacent 100- or 400-bp samples, assuming perfect PCR efficiency. The trendlines and some duplicate samples overlap and appear as a single point or line.
Supplementary Table 2:
Comparison of standard deviation between duplicates from the 100- and 400-bp samples from the fluoPCR and qPCR runs. Standard deviations were calculated with √[ Σ(xi − x̄)2 / (n−1) ] for each set of conditions.
| Standard deviation of spaceflight fluoPCR samples between duplicates | ||
| amol | Std dev for 100-bp | Std dev for 400-bp |
| 25 | 0.00 | 0.00 |
| 1.56 | 1.41 | 0.00 |
| 0.0975 | 0.00 | 0.00 |
| Standard deviation of ground fluoPCR samples between duplicates | ||
| amol | Std dev for 100-bp | Std dev for 400-bp |
| 25 | 0.00 | 1.41 |
| 1.56 | 0.00 | 0.00 |
| 0.0975 | 0.00 | 1.41 |
| Standard deviation of ground qPCR samples between duplicates | ||
| amol | Std dev for 100-bp | Std dev for 400-bp |
| 25 | 0.00 | 0.00 |
| 1.56 | 0.71 | 0.71 |
| 0.0975 | 0.00 | 0.71 |