
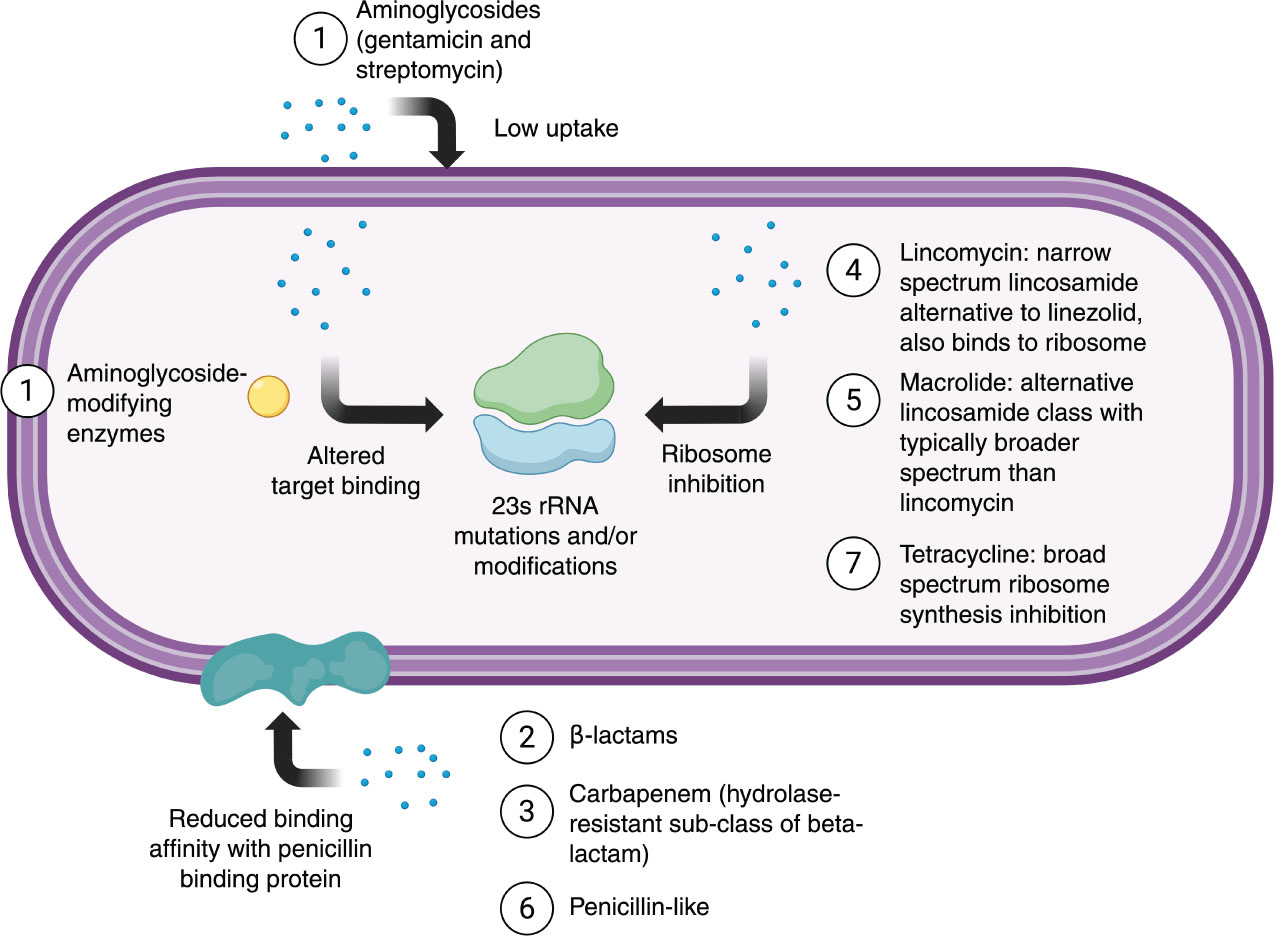
Figure 1.
Mechanisms of resistance for antibiotics included in literature review. Antibiotics are numbered based on order in table.1. Adapted from Arias & Murray 2012.
Table 1.
Antibiotic literature review results. Antibiotics are organized alphabetically within their respective classes. Stability in solution and in agar at 4 °C is given, then resistance in Enterococcus and Staphylococcus is briefly described.
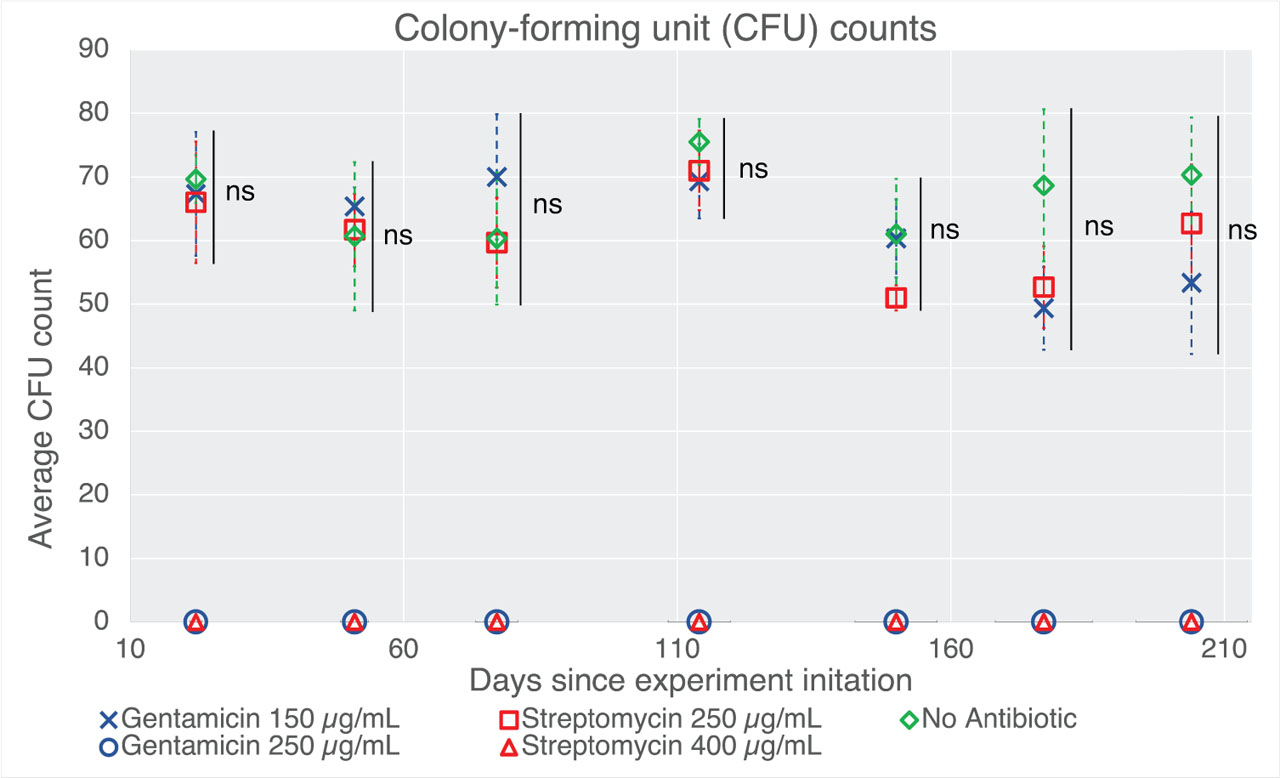
Figure 2.
Average colony-forming unit (CFU) counts for contact slides containing no antibiotic, low-concentration and high-concentration gentamicin, and low-concentration and high-concentration streptomycin over 6.5 months. Colored bars indicate standard deviation. Asterisks denote level of statistical significancy from single-factor ANOVA tests performed on CFU counts for the contact slides containing no antibiotic and low-concentration gentamicin and streptomycin (no significance: ns; p < 0.05: *; p < 0.01: **; p < 0.001: ***; p < 0.0001: ****).
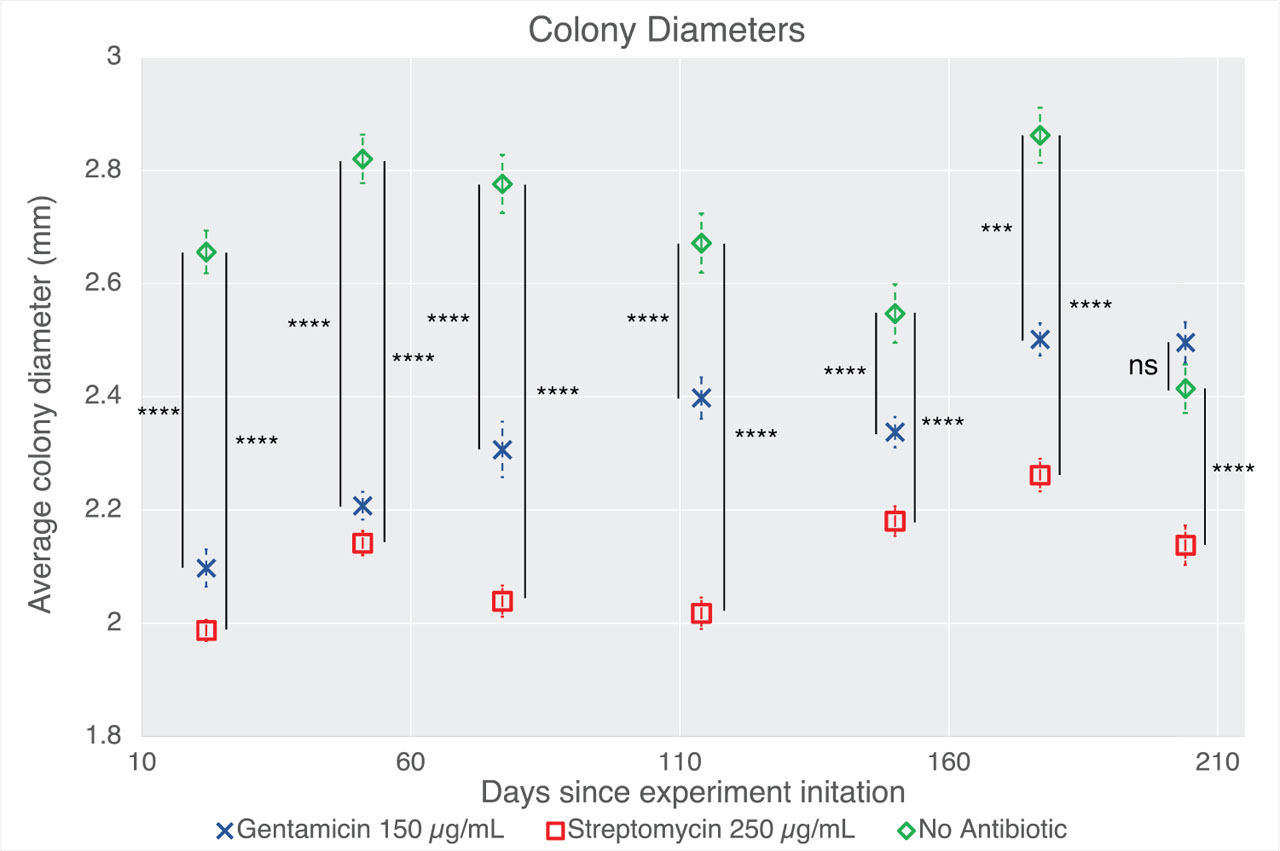
Figure 3.
Average colony diameter on contact slides containing no antibiotic, low-concentration gentamicin, and low-concentration streptomycin over 6.5 months. Colored bars indicate standard error of the mean. Asterisks denote adjusted level of statistical significance from post-hoc comparisons (no significance: ns; p < 0.05: *; p < 0.01: **; p < 0.001: ***; p < 0.0001: ****).