
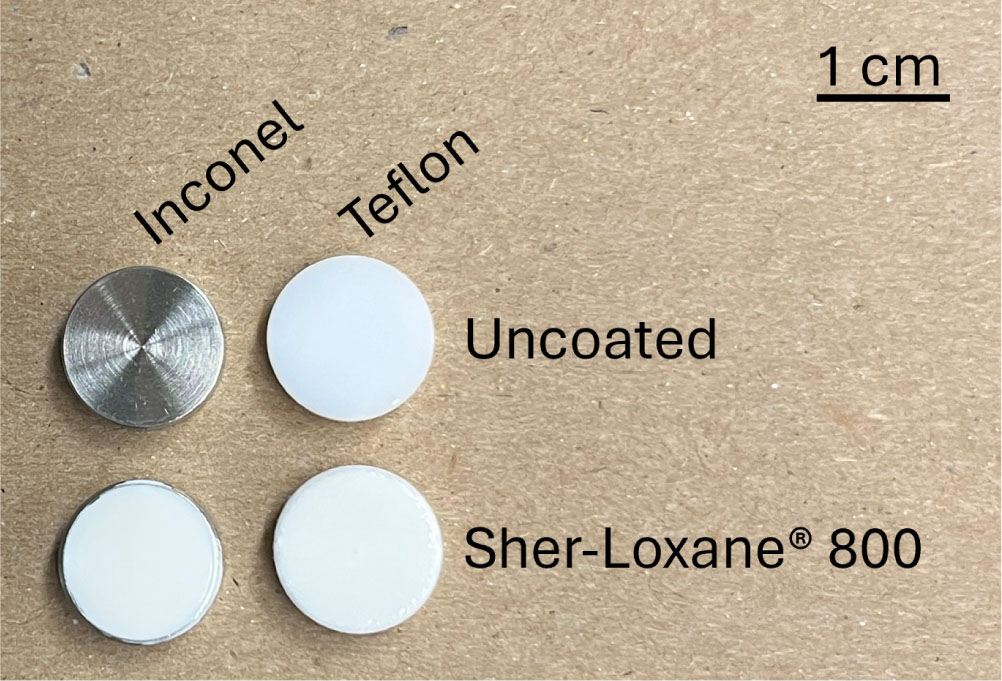
Figure 1.
Coupons for sampling biofilm accumulation in the CDC reactor.
Table 1.
Recipe for microbial ersatz MTN featuring final component concentrations.
| Component | Concentration | Component | Concentration | ||
|---|---|---|---|---|---|
| Propylene Glycol | 8.971 | μL/L | Benzyl Alcohol | 6.075 | μL/L |
| Ethanol | 44.946 | μL/L | Diethylphthalate | 2.01 | μL/L |
| Acetone | 25.799 | μL/L | Trimethyl Silanol | 0.635 | μL/L |
| 2-(2-butoxyethoxy) Ethanol | 2.356 | μL/L | Benzothiazole | 0.21 | μL/L |
| N, N-Dimethylformamide | 1.486 | μL/L | 2-Ethyl-1-Hexanol | 0.48 | μL/L |
| 2-Ethoxyethanol | 1.303 | μL/L | Decamethylcyclopentasiloxane | 1.03 | μL/L |
| 1-Methyl-2-Pyrrolidinone | 0.782 | μL/L | Dodecamethylcyclohexasiloxane | 10 | μL/L |
| 2-Propanol | 0.896 | μL/L | Octamethylcyclotetrasiloxane | 1.02 | μL/L |
| 1-Propanol | 0.876 | μL/L | Dimethoxydimethylsilane | 35.1 | μL/L |
| 4-Ethylmorpholine | 2.265 | μL/L | Calcium Sulfate | 1.885 | mg/L |
| Formic Acid | 27.489 | μL/L | Dimethyl Sulfone | 0.205 | mg/L |
| Lactic Acid | 8.55 | μL/L | Hexamethylcyclotrisiloxane | 1.02 | mg/L |
| Benzoic Acid | 3.015 | mg/L | Monobasic Potassium phosphate | 0.835 | mg/L |
| Caprolactam | 1.111 | mg/L | Magnesium chloride hexahydrate | 0.397 | mg/L |
| Urea | 1.899 | mg/L | Manganese chloride tetrahydrate | 0.319 | mg/L |
| Zinc (II) Acetate dihydrate | 1.425 | mg/L | Ferric chloride | 0.129 | mg/L |
| Nickel (II) Acetate tetrahydrate | 0.518 | mg/L | Boric acid | 0.268 | mg/L |
| Acetic Acid | 32.088 | μL/L | Cobalt chloride hexahydrate | 0.004 | mg/L |
| Ammonium Bicarbonate | 101.457 | mg/L | Sodium molybdate dihydrate | 0.016 | mg/L |
| Sodium Fluoride | 0.88 | mg/L | |||
| Potassium Iodide | 0.021 | mg/L | |||
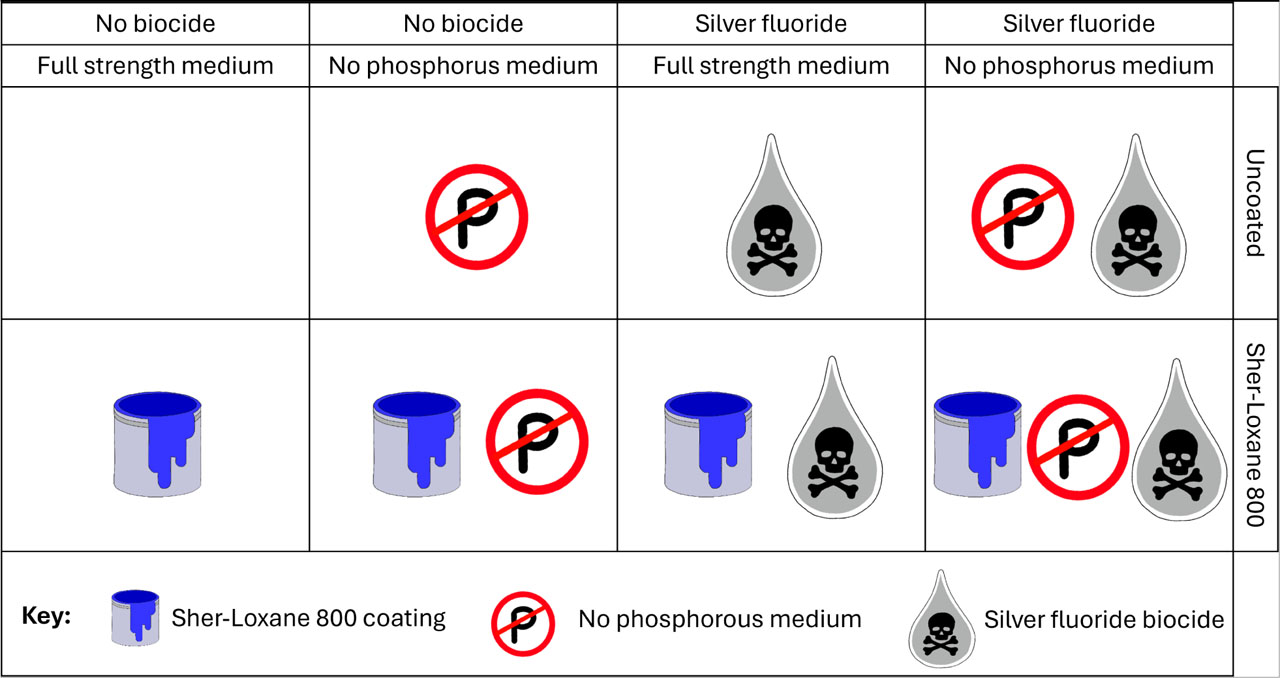
Figure 2.
Biofilm control methods used in each of the eight iterations of experiments. The empty section in the upper left represents the base condition of unmitigated biofilm growth. This layout is used throughout the results to present data for each experiment.
Table 2.
Selective agar used for microbial enumeration of planktonic and biofilm samples.
| Organism enumerated | Agar |
|---|---|
| B. contaminans | Pseudomonas isolation agar |
| C. mutabilis | Sabouraud dextrose agar, pH lowered to 3 |
| M. organophilum | Methylobacterium agar (Atlas, 2010) with amphotericin B (7.5 μg/mL) |
| R. insidiosa | R2A with chloramphenicol (20 μg/mL) and amphotericin B (7.5 μg/mL) |
| No isolation, general counts | R2A |
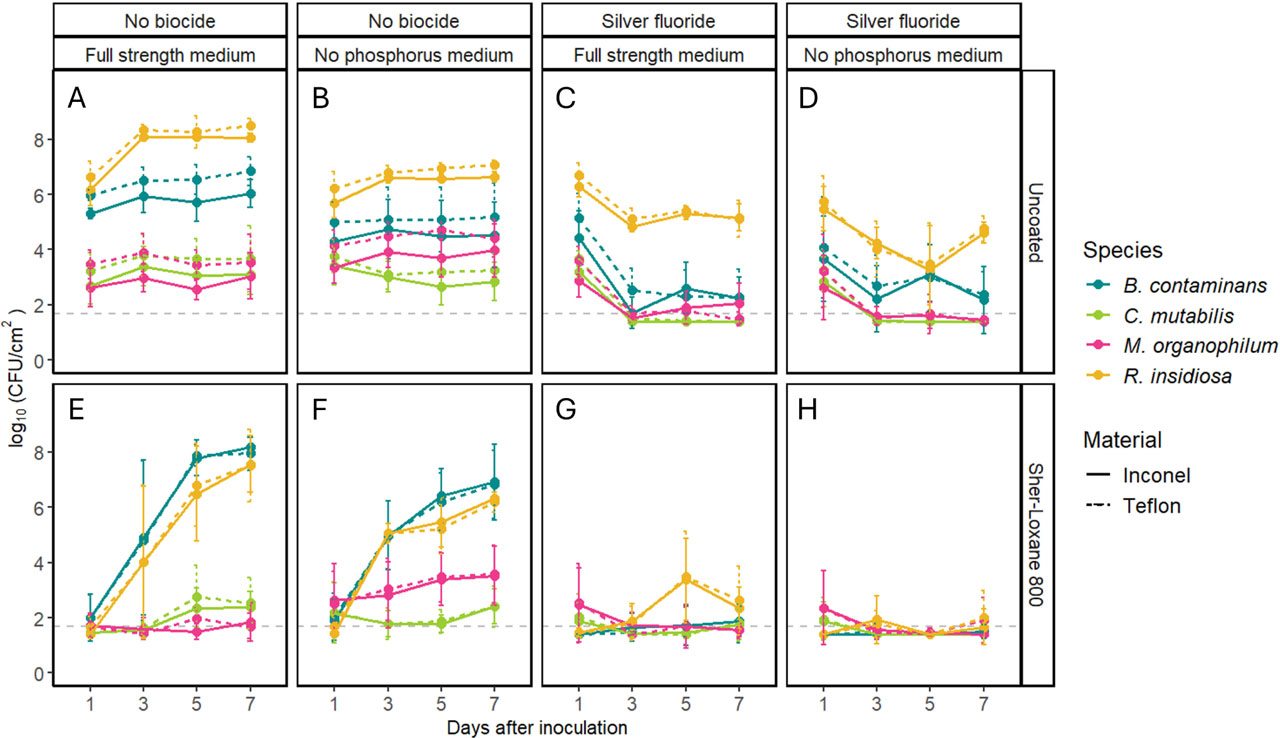
Figure 3.
Viable biofilm density for each of the eight iterations of biofilm control combinations. Continuous flow was initiated on Day 1 after the sample was taken. The grey dashed line represents the limit of detection, y=1.69. Error bars are standard deviation.
Table 3.
P-values for statistical significance of individual factors comparing viable cell densities of the accumulated biofilms. Bolded values represent those less than 0.05, indicating the factor had a significant impact on viable biofilm accumulation of the organism. Table key: No P: no phosphorus medium; FS: full strength medium; AgF: silver fluoride biocide; Inc: Inconel; Tef: Teflon; SL: Sher-Loxane 800 coating; and Unc: uncoated.
| Factor | B. contaminans | C. mutabilis | M. organophilum | R. insidiosa | R2A (whole biofilm) |
|---|---|---|---|---|---|
| Medium (No P < FS) | <0.00005 | 0.0556 | <0.00005 | <0.00005 | <0.00005 |
| Biocide (AgF < No biocide) | <0.00005 | <0.00005 | <0.00005 | <0.00005 | <0.00005 |
| Material (Inc < Tef) | 0.0269 | 0.0003 | 0.0002 | 0.0497 | 0.9930 |
| Coating (SL < Unc) | <0.00005 | <0.00005 | <0.00005 | <0.00005 | <0.00005 |
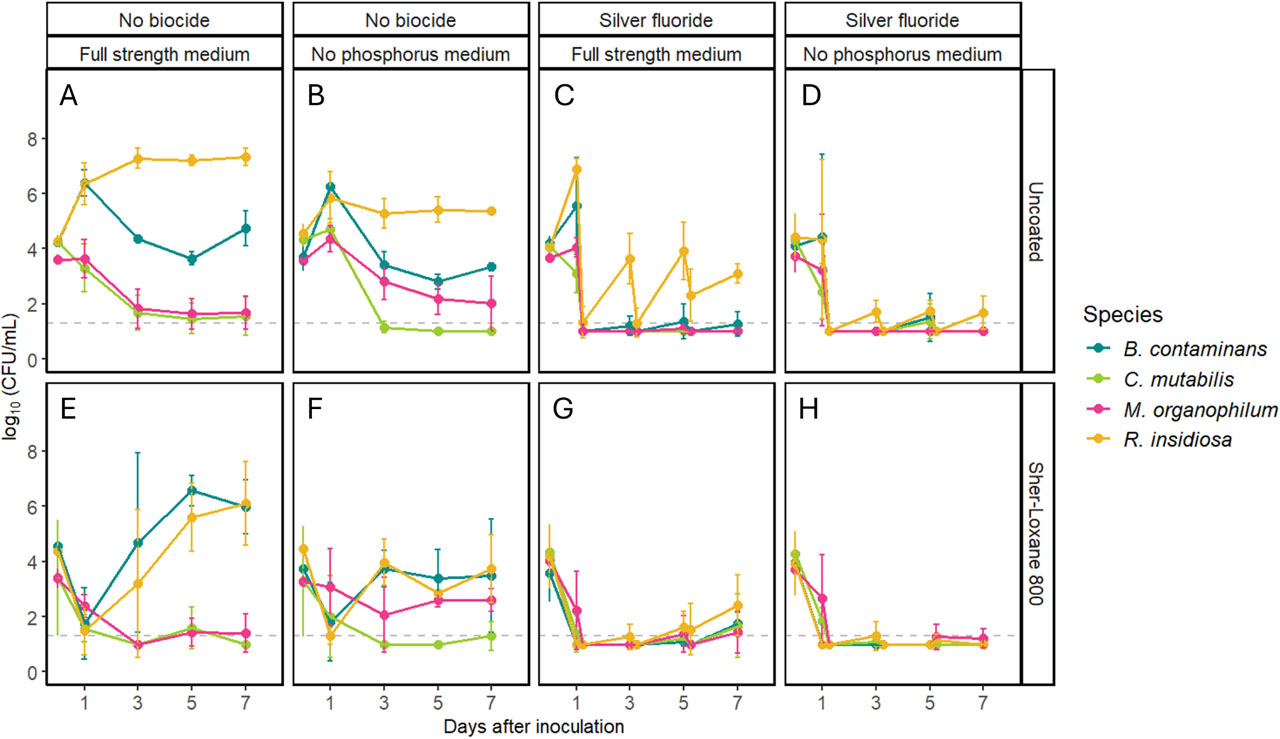
Figure 4.
Viable planktonic cell density for each of the eight iterations of biofilm control combinations. Continuous flow began on Day 1 after the sample was taken. The grey dashed line represents the limit of detection, y=1.3. Error bars represent standard deviation.
Table 4.
P-values for statistical significance of individual fixed factors comparing viable cell densities of the planktonic cells in the reactor fluid. Bolded values are less than 0.05, indicating the factor had a significant impact on the viable planktonic density of the organism. Table key: No P: no phosphorus medium; FS: full strength medium; AgF: silver fluoride biocide; SL: Sher-Loxane 800 coating; and Unc: uncoated.
| Factor | B. contaminans | C. mutabilis | M. organophilum | R. insidiosa | R2A counts (total planktonic) |
|---|---|---|---|---|---|
| Medium (No P < FS) | 0.0011 | 0.9320 | 0.0013 | 0.0003 | 0.0049 |
| Biocide (AgF < No biocide) | <0.00005 | 0.0110 | 0.0001 | <0.00005 | <0.00005 |
| Coating (SL < Unc) | 0.2827 | 0.0042 | 0.0464 | <0.00005 | 0.0009 |
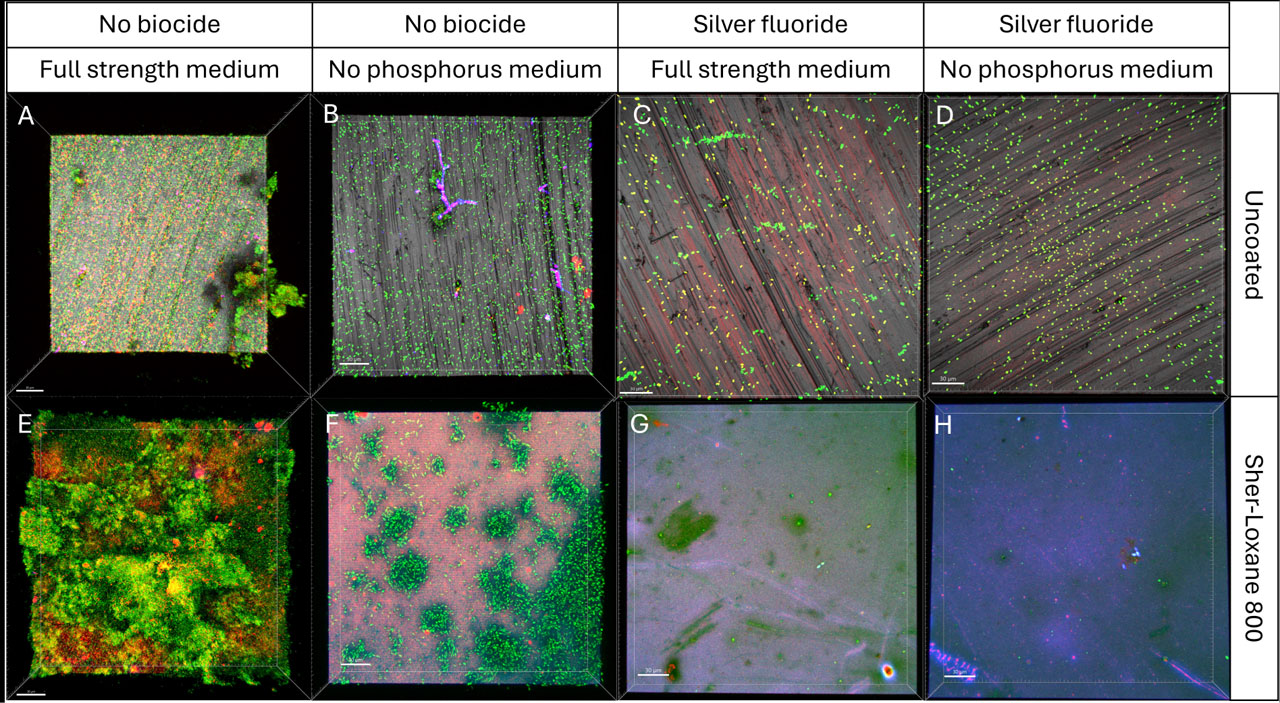
Figure 5.
Confocal images of biofilms accumulated on Inconel CDC coupons seven days after inoculation. Viable bacterial cells are in green, non-viable bacterial cells are in red, and fungal cells are in blue. The fluorescence of the coating can be seen in the three images on the lower right. The scale bar for each image is 30 μm.
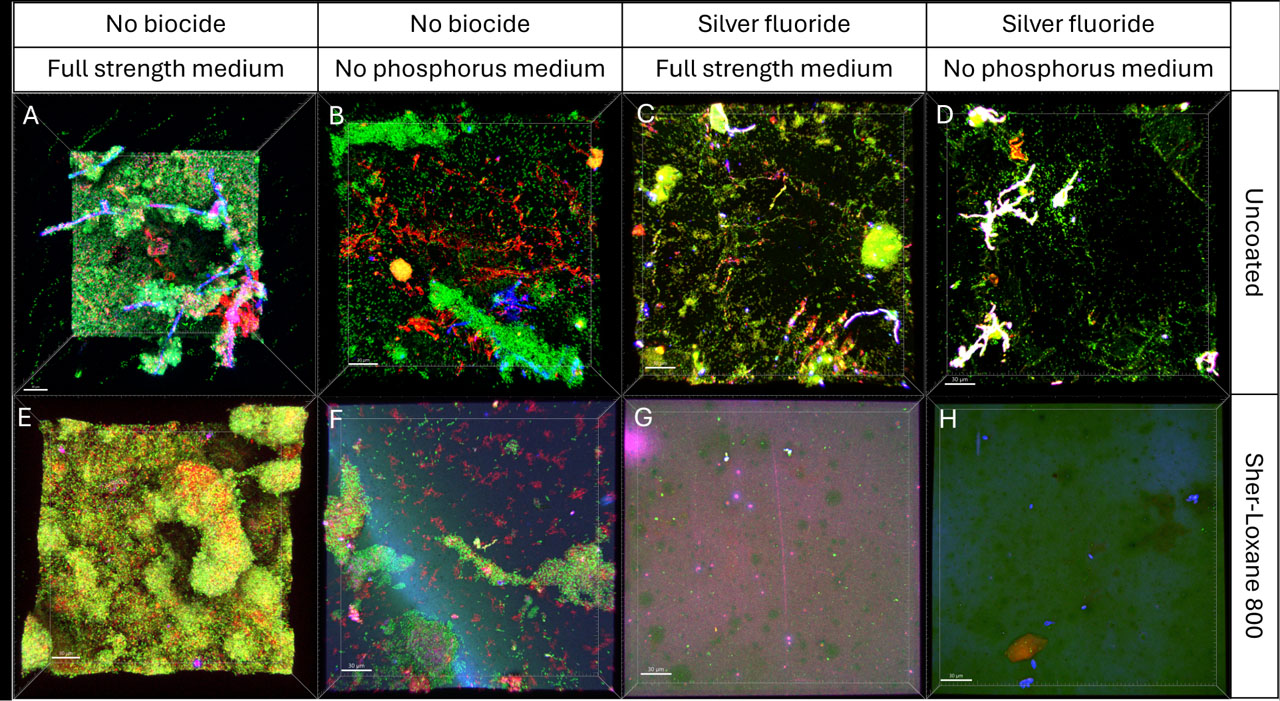
Figure 6.
Confocal images of biofilms accumulated on Teflon CDC coupons seven days after inoculation. Viable bacterial cells are in green, non-viable bacterial cells are in red, and fungal cells are in blue. The fluorescence of the coating can be seen in the three images on the lower right. The scale bar for each image is 30 μm.
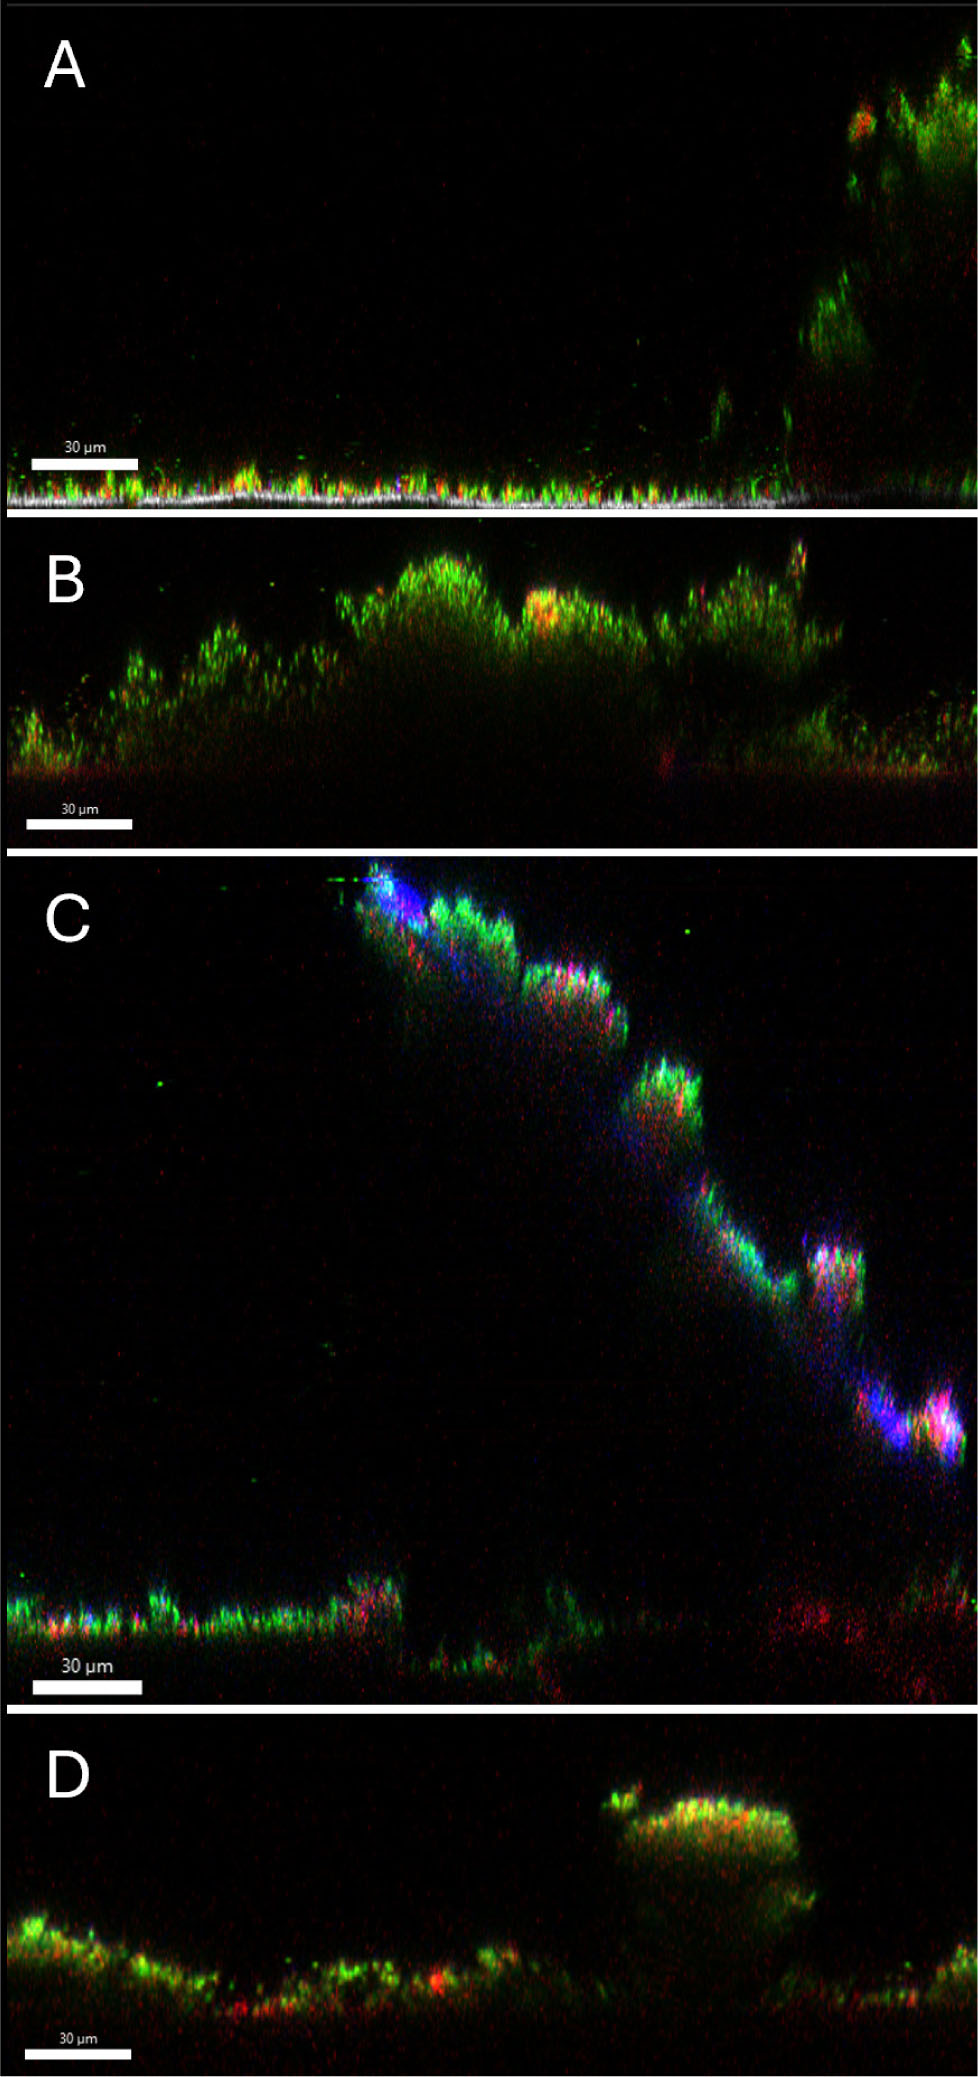
Figure 7.
Side views of tallest segments of biofilms on A) uncoated Inconel, B) coated Inconel, C) uncoated Teflon, and D) coated Teflon grown in full strength medium without biocide dosing. Scale bar in each image is 30 μm.