
Figure 1.
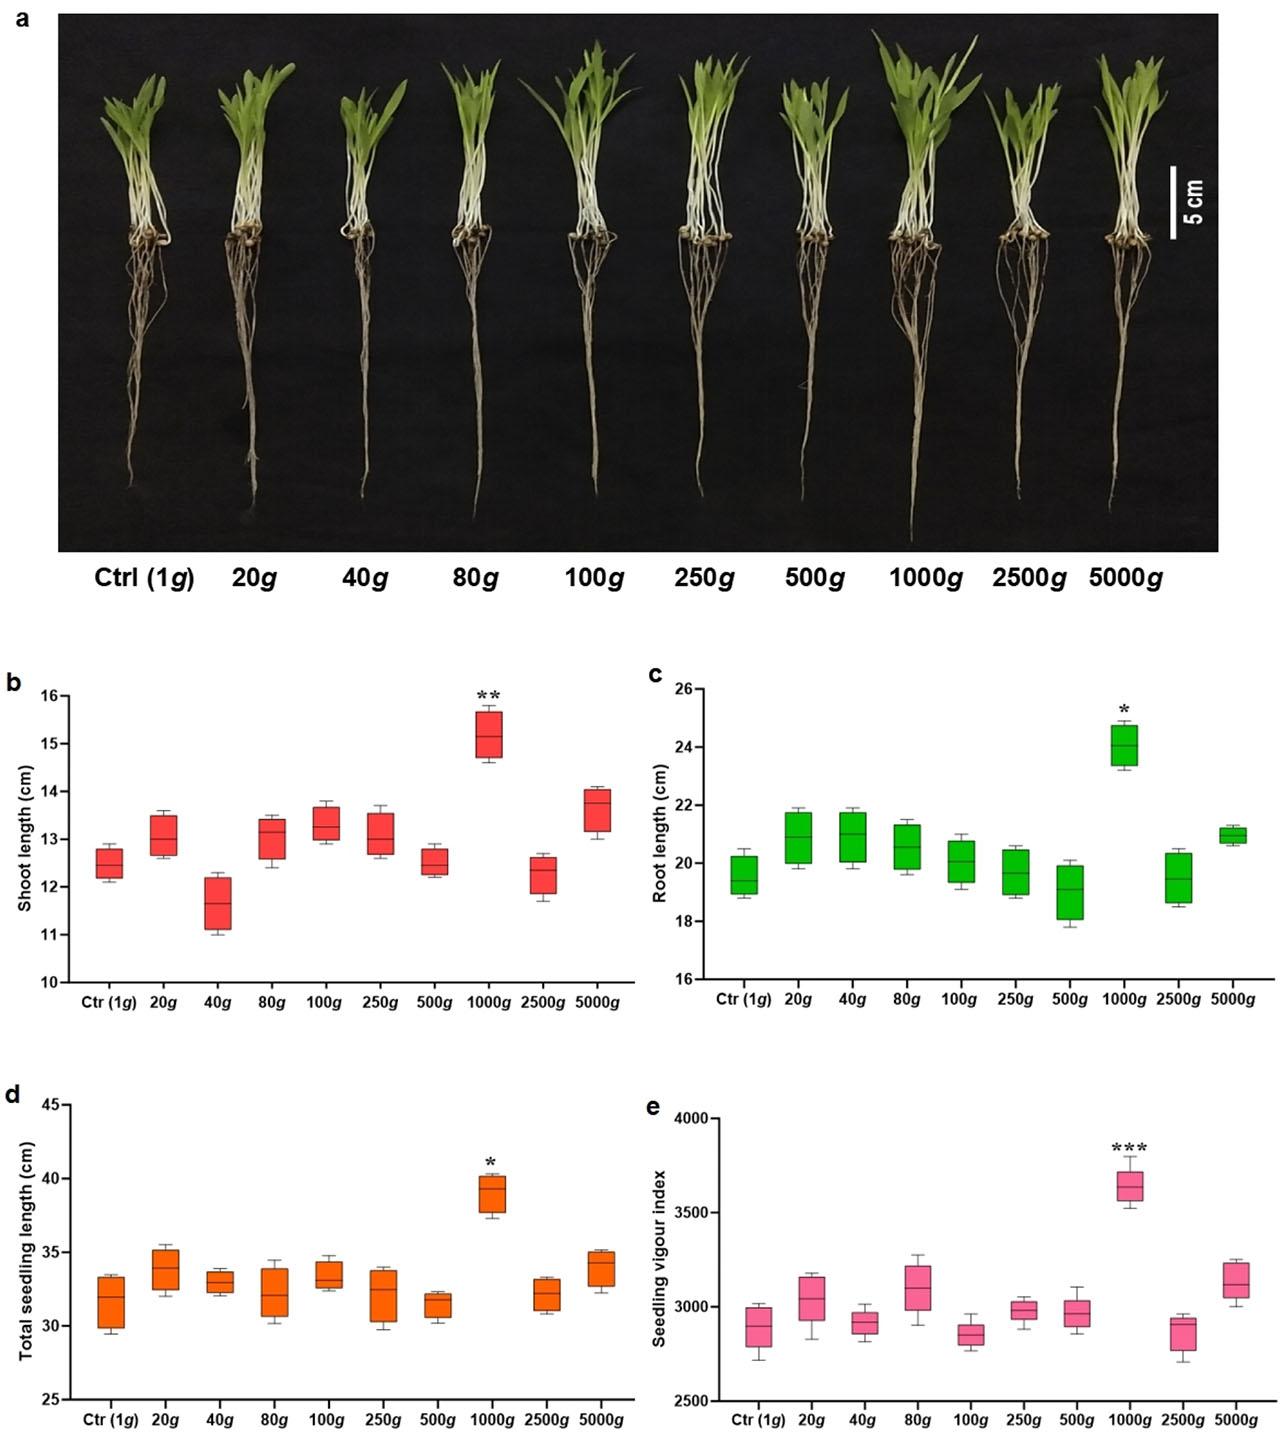
Figure 2.
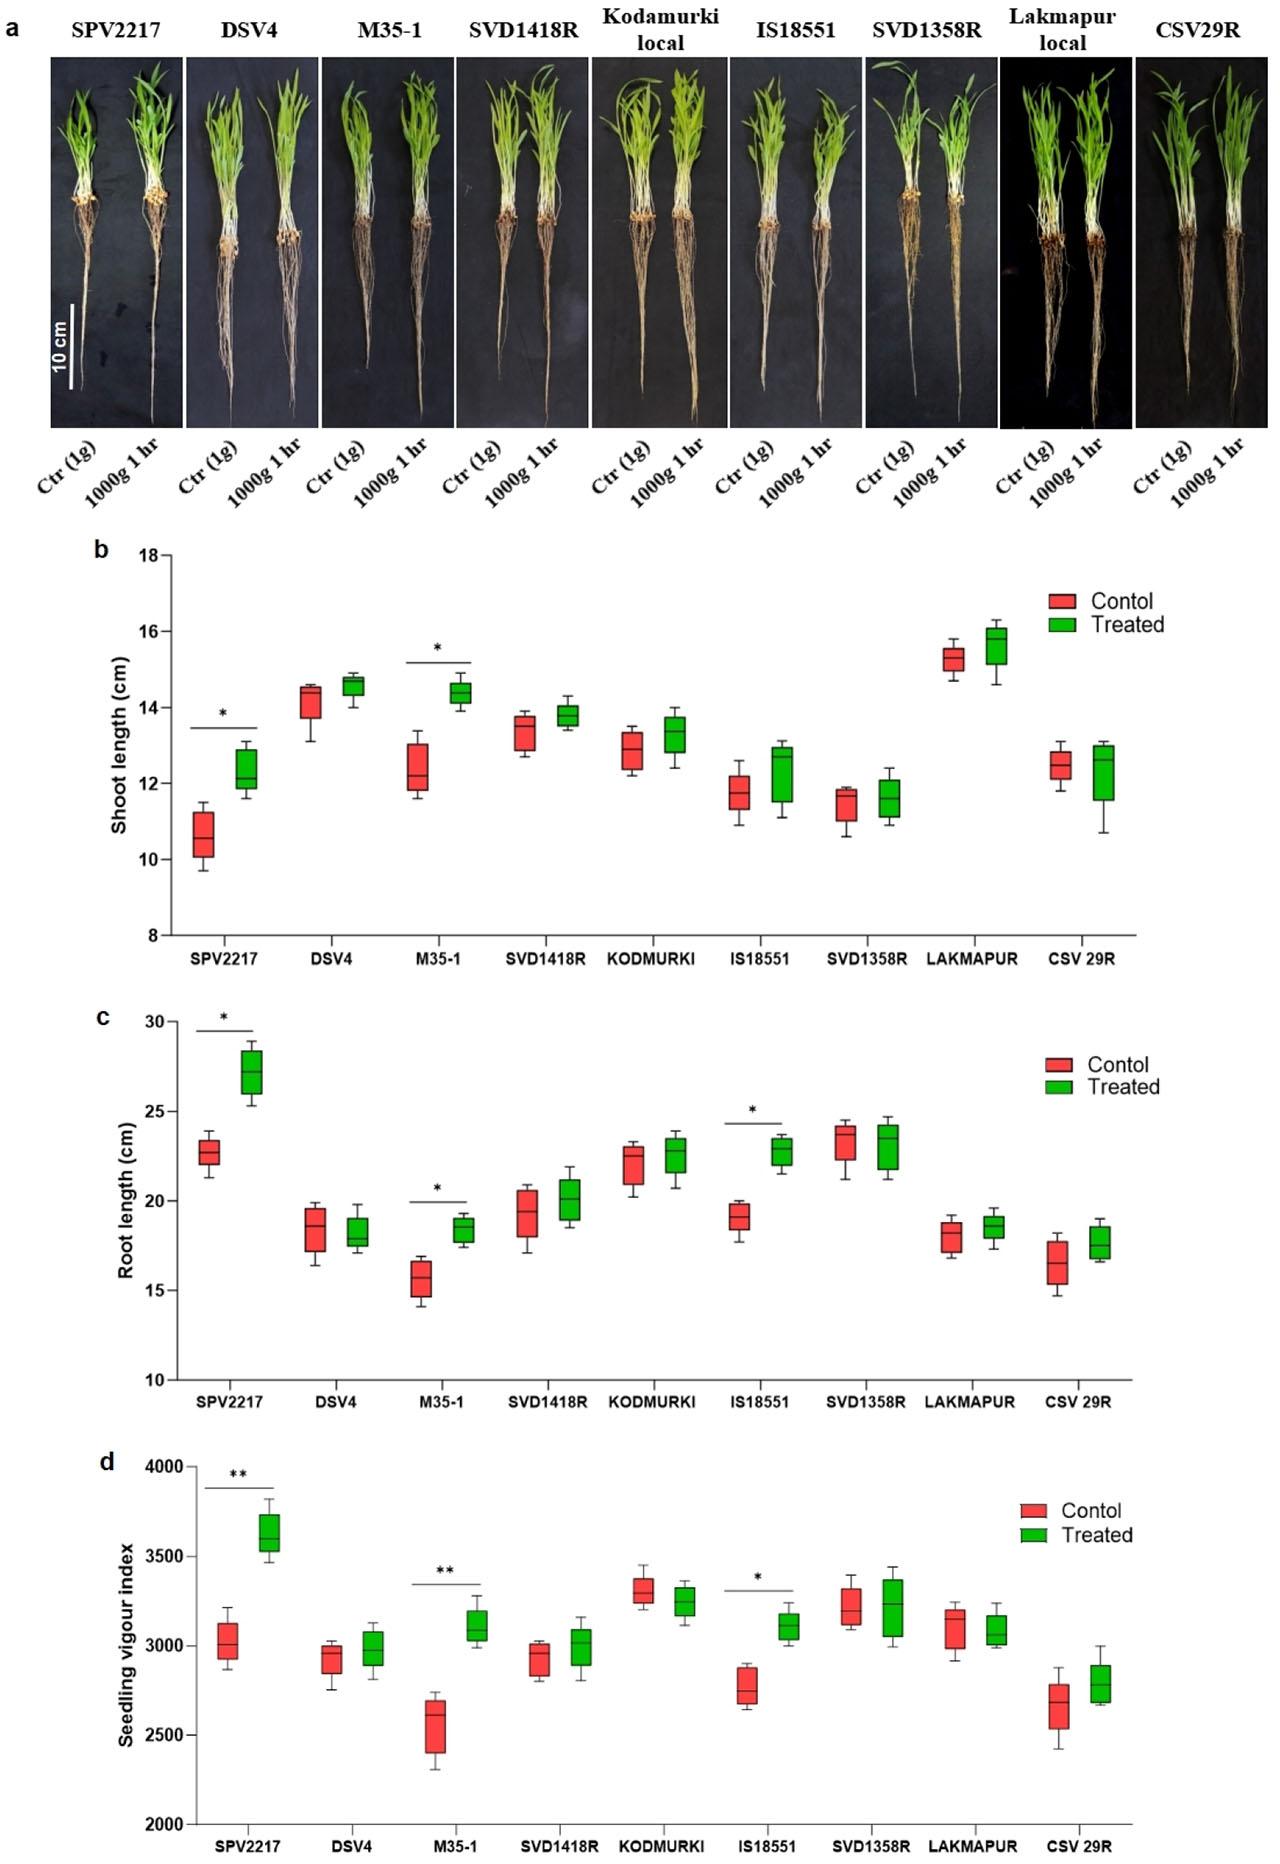
Figure 3.
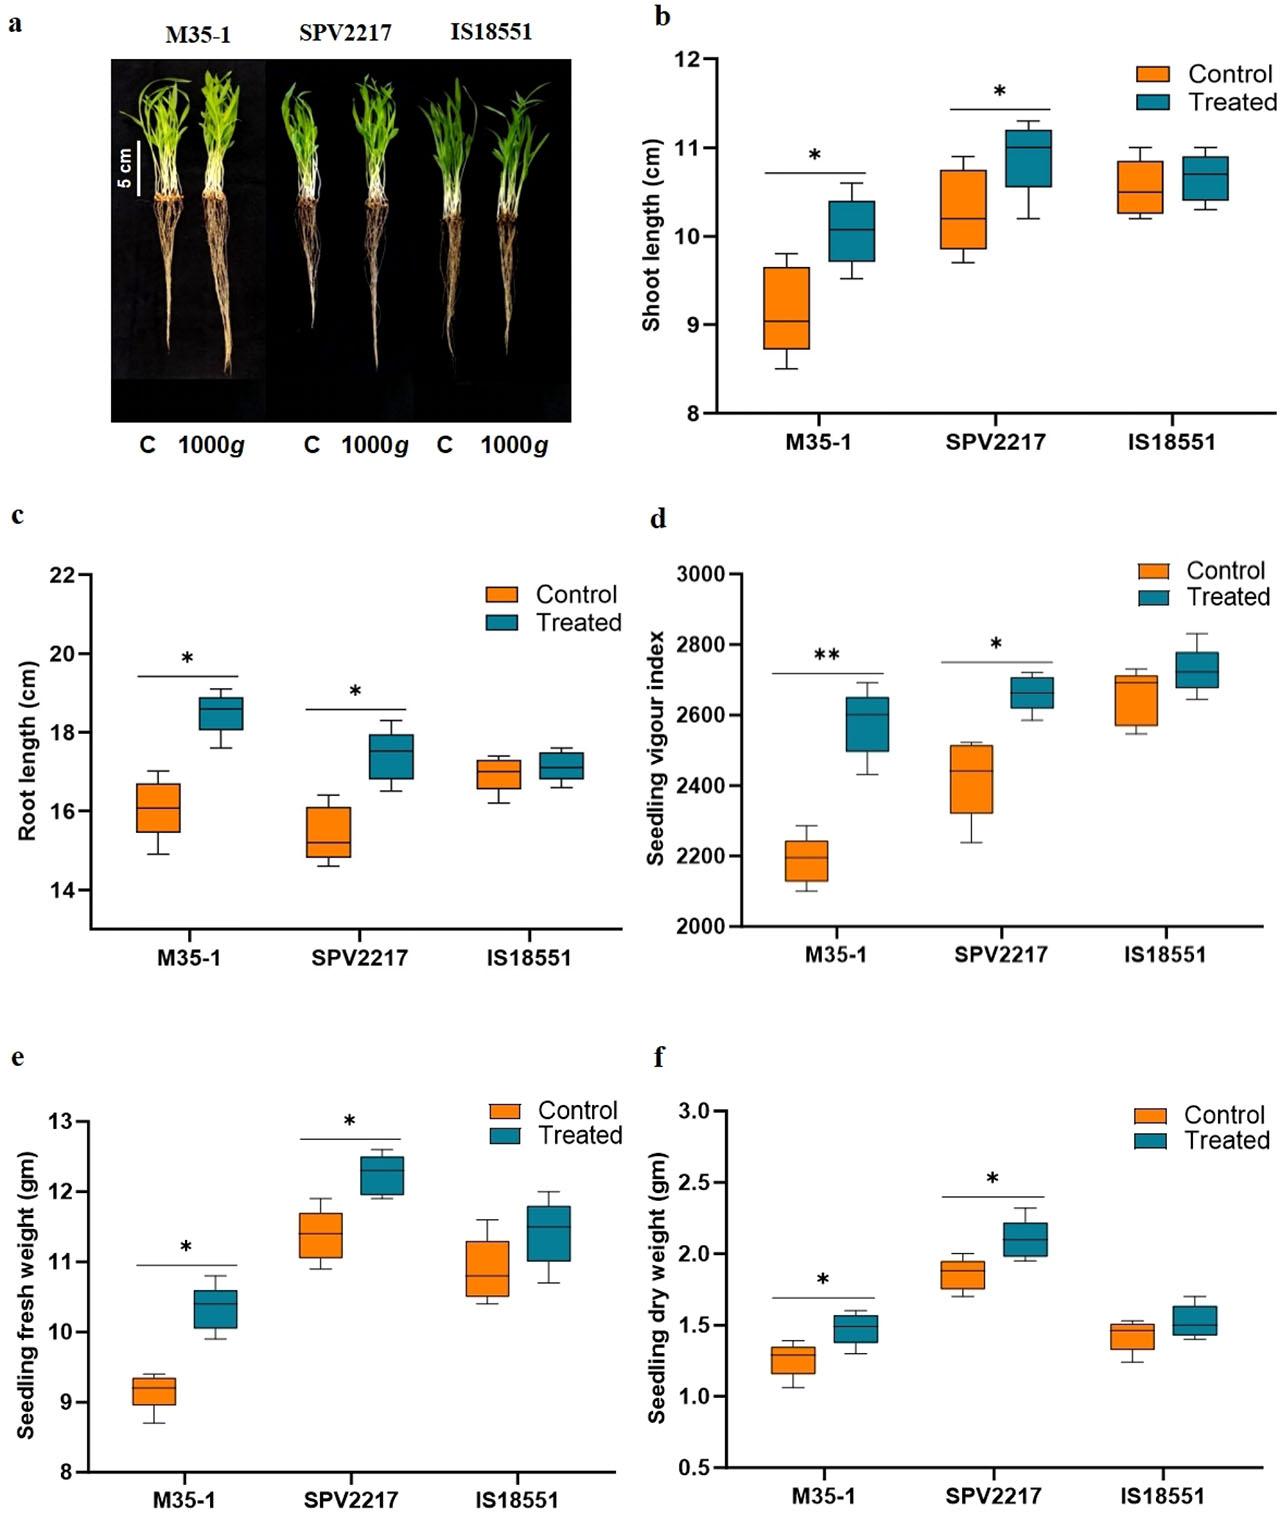
Figure 4.
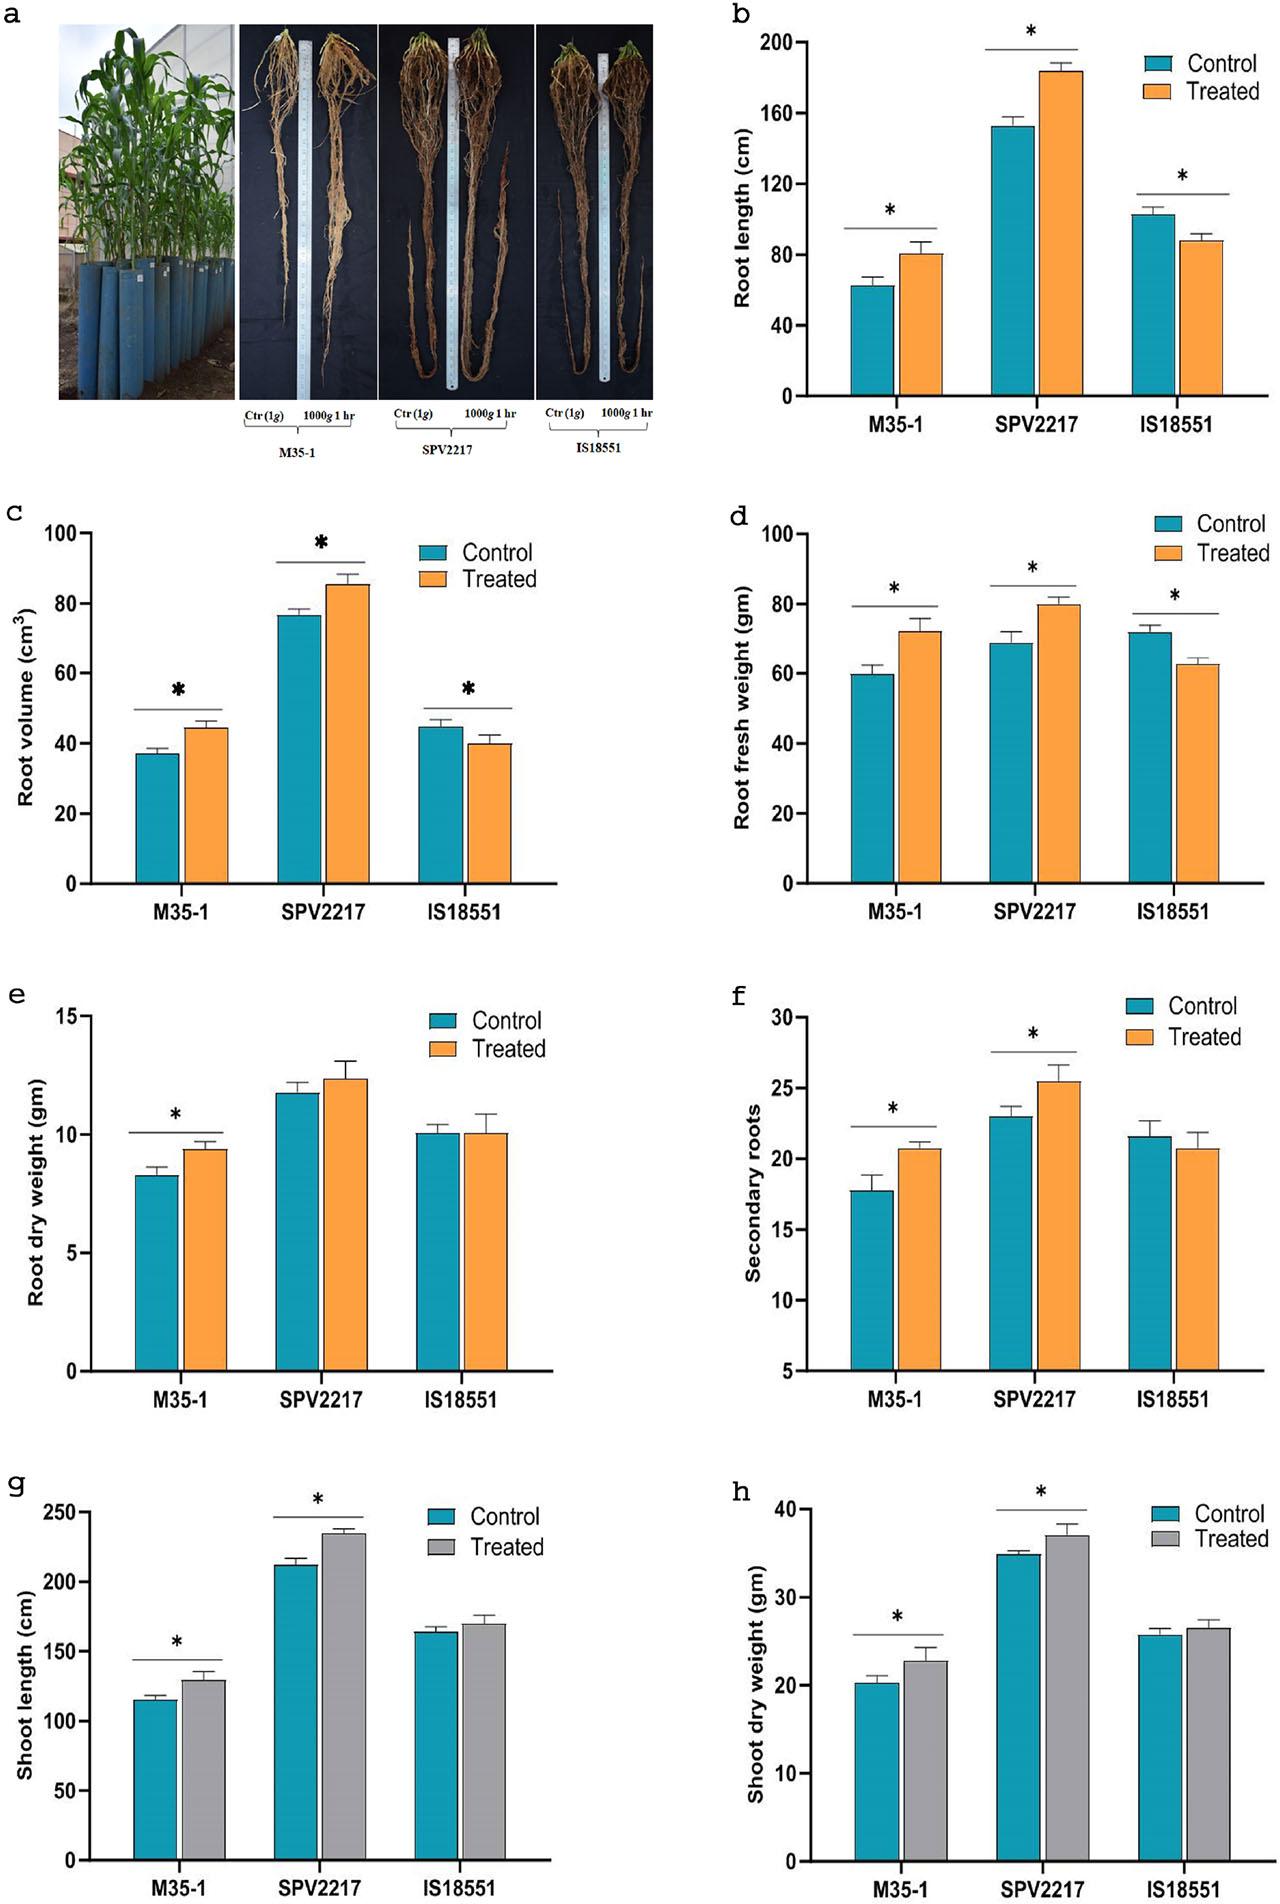
Figure 5.
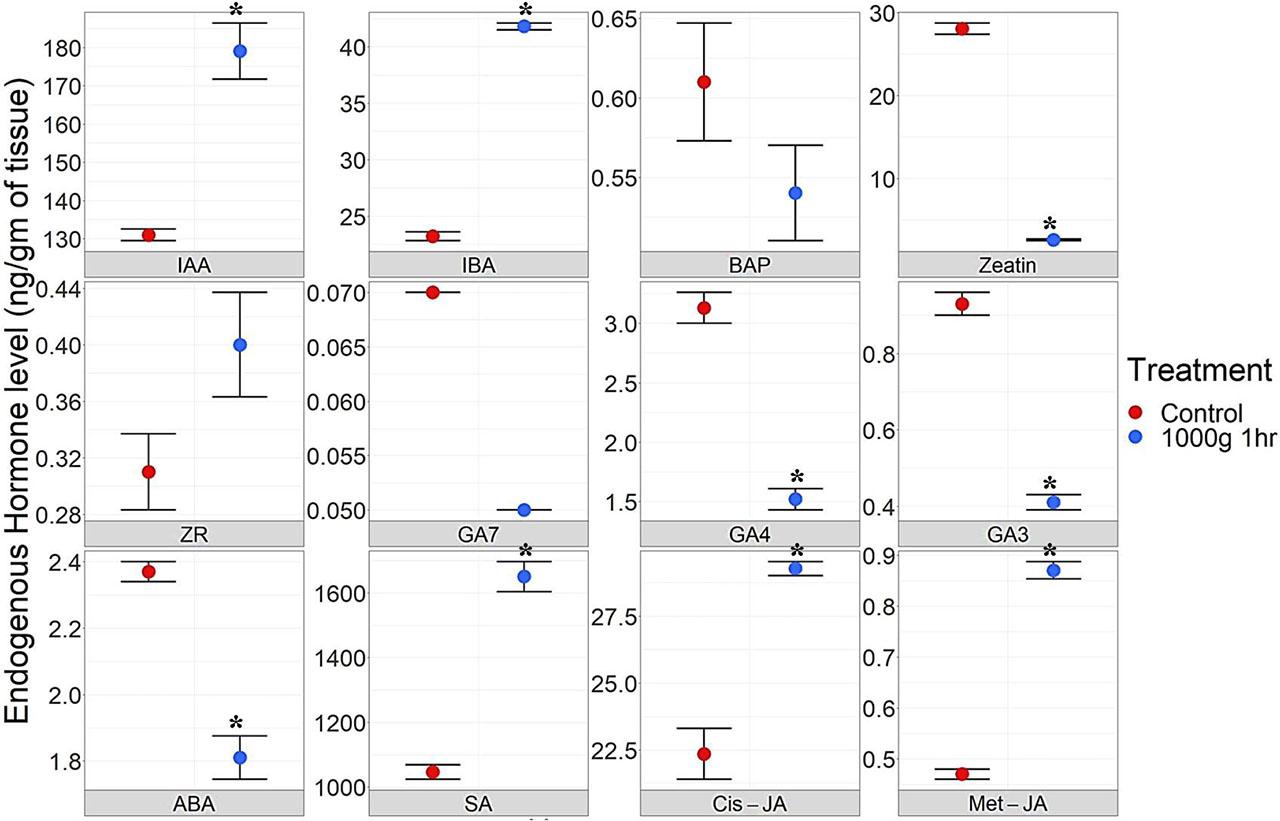
Figure 6.
Supplementary Figure 1.
Response of different sorghum genotypes to hypergravity under laboratory conditions using between-paper-method_ Hypergravity-induced changes in germination, root, length, shoot, and seedling vigor index in different genotypes of sorghum seedlings were recorded on the final count (day 10) of 9 different genotypes of sorghum seedlings_ Resultant data was subjected to an independent sample t-test (four independent experimental groups of 30 seedlings in triplicate (30×3 = 90; 90×4 experiments = 360)) using SPSS – version 20_00_
| Genotypes | Ctr (1g) Mean ± SEM | 1000g 1 hr Mean ± SEM | % change over control | p-value | t-stat. |
|---|---|---|---|---|---|
| Germination (%) | |||||
| SPV2217 | 91.5 ± 2.33 | 92.25 ± 2.18 | 0.82 | 0.835 | 0.313 |
| DSV4 | 89.50 ± 1.45 | 90.50 ± 1.20 | 1.12 | 0.869 | 0.177 |
| M35-1 | 94.50 ± 1.33 | 93.75 ± 1.66 | −0.79 | 0.665 | 0.469 |
| SVD1418R | 89.50 ± 2.72 | 91.50 ± 1.85 | 2.23 | 0.709 | 0.404 |
| KODMURKI LOCAL | 93.50 ± 1.52 | 90.50 ± 3.84 | −3.21 | 0.571 | 0.645 |
| IS18551 | 91.50 ± 1.52 | 90.50 ± 2.33 | −1.09 | 0.713 | 0.397 |
| SVD1358R | 91.25 ± 1.52 | 94.50 ± 1.33 | 3.56 | 0.812 | 0.981 |
| LAKMAPUR LOCAL | 93.75 ± 1.66 | 89.50 ± 2.72 | −4.53 | 0.382 | 0.548 |
| CSV 29R | 91.50 ± 1.85 | 93.50 ± 1.52 | 2.19 | 0.617 | 0.261 |
| Shoot length (cm) | |||||
| SPV2217 | 10.56 ± 0.70 | 12.13 ± 0.83 | 14.92 | 0.046 | 4.51 |
| DSV4 | 14.38 ± 0.43 | 14.69 ± 0.45 | 2.16 | 0.59 | 0.59 |
| M35-1 | 12.38 ± 0.44 | 14.38 ± 0.74 | 16.16 | 0.039 | 5.66 |
| SVD1418R | 13.65 ± 0.38 | 13.78 ± 0.35 | 0.92 | 0.61 | 0.56 |
| KODMURKI LOCAL | 13.10 ± 0.55 | 13.37 ± 0.86 | 2.02 | 0.32 | 1.17 |
| IS18551 | 11.75 ± 0.27 | 12.12 ± 0.21 | 3.13 | 0.19 | 3.33 |
| SVD1358R | 11.67 ± 0.36 | 11.80 ± 0.73 | 1.16 | 0.42 | 0.94 |
| LAKMAPUR LOCAL | 15.33 ± 0.32 | 15.64 ± 0.54 | 2.06 | 0.31 | 3.15 |
| CSV 29R | 12.48 ± 0.78 | 12.62 ± 0.34 | 1.08 | 0.12 | 2.41 |
| Root length (cm) | |||||
| SPV2217 | 22.70 ± 0.80 | 27.58 ± 0.44 | 21.51 | 0.016 | 4.86 |
| DSV4 | 18.34 ± 0.41 | 18.03 ± 0.18 | −1.68 | 0.13 | 2.00 |
| M35-1 | 15.57 ± 0.46 | 18.54 ± 1.21 | 19.11 | 0.018 | 6.93 |
| SVD1418R | 19.15 ± 1.09 | 19.19 ± 1.44 | 0.21 | 0.12 | 2.02 |
| KODMURKI LOCAL | 22.23 ± 0.44 | 22.50 ± 0.66 | 1.20 | 0.41 | 3.65 |
| IS18551 | 18.99 ± 0.43 | 22.41 ± 0.60 | 18.00 | 0.030 | 5.25 |
| SVD1358R | 23.33 ± 0.88 | 23.48 ± 0.47 | 0.68 | 0.12 | 3.40 |
| LAKMAPUR LOCAL | 18.42 ± 0.98 | 18.57 ± 0.86 | 0.81 | 0.97 | 2.74 |
| CSV 29R | 16.51 ± 0.57 | 17.16 ± 1.04 | 3.89 | 0.46 | 3.05 |
| Seedling vigour index (SVI) | |||||
| SPV2217 | 3041.25 ± 39.6 | 3663.78 ± 26.4 | 20.47 | 0.005 | 4.86 |
| DSV4 | 2929.11 ± 60.4 | 2961.63 ± 51.4 | 1.11 | 0.70 | 1.93 |
| M35-1 | 2640.16 ± 36.9 | 3085.71 ± 19.4 | 16.88 | 0.006 | 5.995 |
| SVD1418R | 2935.45 ± 13.1 | 3015.69 ± 18.6 | 2.73 | 0.12 | 5.19 |
| KODMURKI LOCAL | 3303.27 ± 52.4 | 3245.50 ± 53.5 | −1.75 | 0.47 | 1.42 |
| IS18551 | 2812.62 ± 36.3 | 3124.33 ± 25.7 | 11.08 | 0.01 | 4.355 |
| SVD1358R | 3192.92 ± 22.3 | 3333.96 ± 21.6 | 4.42 | 0.09 | 2.61 |
| LAKMAPUR LOCAL | 3163.19 ± 27.6 | 3061.30 ± 20.4 | −3.22 | 0.13 | 3.90 |
| CSV 29R | 2652.75 ± 15.8 | 2785.28 ± 25.7 | 3.75 | 0.16 | 5.28 |
| Total Seedling length (cm) | |||||
| SPV2217 | 33.26 ± 0.56 | 39.72 ± 0.21 | 20.47 | 0.005 | 4.86 |
| DSV4 | 32.72 ± 0.16 | 32.73 ± 0.09 | 1.11 | 0.70 | 1.93 |
| M35-1 | 27.94 ± 0.22 | 32.92 ± 0.14 | 16.88 | 0.006 | 5.995 |
| SVD1418R | 32.80 ± 0.14 | 32.97 ± 0.30 | 2.73 | 0.12 | 5.19 |
| KODMURKI LOCAL | 35.33 ± 0.22 | 35.87 ± 0.25 | −1.75 | 0.47 | 1.42 |
| IS18551 | 30.74 ± 0.39 | 34.53 ± 0.12 | 11.08 | 0.001 | 4.355 |
| SVD1358R | 34.99 ± 0.19 | 35.28 ± 0.28 | 4.42 | 0.09 | 2.61 |
| LAKMAPUR LOCAL | 33.74 ± 0.25 | 34.20 ± 0.17 | −3.22 | 0.13 | 3.90 |
| CSV 29R | 29.00 ± 0.49 | 29.78 ± 0.66 | 3.75 | 0.16 | 5.28 |
Changes in germination, root, and shoot growth characteristics of three selected sorghum genotypes under greenhouse conditions_ Hypergravity-induced changes in germination (%), root length (cm), root volume (cm3), root fresh weight (gm), root dry weight (gm), number of secondary roots of selected genotypes of sorghum in greenhouse conditions recorded at the beginning of the reproductive phase (55th-day) of sorghum grown in a greenhouse_ The resultant data was subjected to an independent sample t-test [N=48] using SPSS – version 20_00_
| Genotypes | Ctr (1g) Mean ± SEM | 1000g 1 hr Mean ± SEM | % change over control | p-value | t-stat. |
|---|---|---|---|---|---|
| Germination (%) | |||||
| M35-1 | 94.5 ± 1.33 | 95.0 ± 1.66 | 0.53 | 0.566 | 0.469 |
| SPV2217 | 93.8 ± 1.52 | 94.0 ± 3.84 | 0.27 | 0.179 | 0.645 |
| IS18551 | 91.5 ± 1.52 | 93.0 ± 2.33 | 1.64 | 0.492 | 0.397 |
| Root length (cm) | |||||
| M35-1 | 64.9 ± 0.59 | 77.5 ± 0.96 | 19.33 | 0.011 | 13.41 |
| SPV2217 | 155.0 ± 1.01 | 180.7 ± 0.98 | 16.62 | 0.015 | 13.88 |
| IS18551 | 103.0 ± 0.85 | 87.1 ± 0.35 | −18.25 | 0.012 | 24.39 |
| Root volume (cm3) | |||||
| M35-1 | 36.6 ± 3.96 | 43.0 ± 2.34 | 17.42 | 0.026 | 2.927 |
| SPV2217 | 76.7 ± 1.10 | 88.0 ± 2.52 | 14.67 | 0.025 | 2.964 |
| IS18551 | 43.6 ± 2.95 | 41.2 ± 1.11 | −5.45 | 0.011 | 9.571 |
| Root fresh weight (gm) | |||||
| M35-1 | 65.4 ± 0.86 | 71.3 ± 0.55 | 18.19 | 0.01 | 11.32 |
| SPV2217 | 69.0 ± 0.58 | 79.4 ± 0.98 | 15.08 | 0.015 | 12.43 |
| IS18551 | 72.2 ± 0.54 | 61.2 ± 0.32 | −7.09 | 0.011 | 9.85 |
| Root dry weight (gm) | |||||
| M35-1 | 8.3 ± 1.35 | 9.3 ± 3.28 | 12.35 | 0.003 | 4.32 |
| SPV2217 | 11.7 ± 2.71 | 12.3 ± 2.87 | 4.91 | 0.202 | 5.17 |
| IS18551 | 10.0 ± 1.49 | 10.1 ± 2.16 | 0.05 | 0.157 | 4.78 |
| Number of secondary roots | |||||
| M35-1 | 15.8 ± 1.58 | 20.8 ± 4.71 | 16.90 | 0.014 | 4.431 |
| SPV2217 | 23.8 ± 1.83 | 25.5 ± 3.93 | 10.87 | 0.017 | 3.274 |
| IS18551 | 23.3 ± 1.65 | 22.5 ± 1.47 | −3.23 | 0.063 | 2.967 |
| Shoot length (cm) | |||||
| M35-1 | 115.3 ± 7.2 | 129.5 ± 7.69 | 12.36 | 0.025 | 4.333 |
| SPV2217 | 212.0 ± 13.5 | 235.0 ± 12.9 | 10.85 | 0.016 | 7.534 |
| IS18551 | 164.0 ± 10.5 | 169.5 ± 17.2 | 3.35 | 0.059 | 9.532 |
| Number of leaves per plant | |||||
| M35-1 | 09 ± 0.40 | 9.3 ± 0.51 | 2.78 | 0.134 | 1.732 |
| SPV2217 | 11 ± 0.40 | 11.3 ± 0.54 | 2.27 | 0.235 | 1.543 |
| IS18551 | 13 ± 0.86 | 13.5 ± 0.12 | 3.85 | 0.323 | 1.786 |
| Shoot fresh weight (gm) | |||||
| M35-1 | 151.6 ± 1.9 | 163.2 ± 1.3 | 7.65 | 0.032 | 4.928 |
| SPV2217 | 217.6 ± 1.7 | 236.4 ± 2.5 | 8.64 | 0.023 | 1.206 |
| IS18551 | 188.6 ± 1.2 | 199.8 ± 3.4 | 5.53 | 0.129 | 2.863 |
| Shoot dry weight (gm) | |||||
| M35-1 | 20.6 ± 0.08 | 22.8 ± 0.25 | 10.44 | 0.02 | 5.23 |
| SPV2217 | 34.9 ± 0.27 | 37.5 ± 0.52 | 7.46 | 0.017 | 7.121 |
| IS18551 | 25.8 ± 0.37 | 26.5 ± 0.51 | 2.81 | 0.204 | 4.439 |
Physio-biochemical screening of selected sorghum genotypes_ Total chlorophyll content was quantified in leaf tissue; EC and TDH activity were quantified in seeds; catalase and SOD enzyme activities were quantified in seedlings_ All biochemical assays were carried out in three replications and four independent experiments were used for an independent variable ‘T’ test analysis using SPSS – version 20_00 (T–tab_ 4_303)
| Genotypes/parameters | Ctr (1g) | 1000g 1 hr. | % change over control | p-value | t-stat. |
|---|---|---|---|---|---|
| Mean ± SEM | Mean ± SEM | ||||
| Total chlorophyll content (mg g−1 of tissue) | |||||
| M35-1 | 2.20 ± 0.19 | 2.76 ± 0.04 | 25.87 | 0.017* | 5.68 |
| SPV2217 | 2.36 ± 0.07 | 2.67 ± 0.09 | 13.13 | 0.038* | 4.80 |
| IS18551 | 2.70 ± 0.11 | 3.05 ± 0.08 | 12.19 | 0.023* | 8.87 |
| Electrical conductivity (dS/m) | |||||
| M35–1 | 0.29 ± 0.003 | 0.28 ± 0.080 | −2.55 | 0.538 NS | 0.70 |
| SPV2217 | 0.36 ± 0.010 | 0.33 ± 0.005 | −10.23 | 0.113 NS | 2.34 |
| IS18551 | 0.23 ± 0.010 | 0.21 ± 0.005 | −10.56 | 0.221 NS | 1.54 |
| Total dehydrogenase (TDH) | |||||
| M35-1 | 0.73 ± 0.02 | 0.89 ± 0.01 | 21.91 | 0.010* | 8.80 |
| SPV2217 | 0.74 ± 0.05 | 0.86 ± 0.03 | 16.87 | 0.030* | 6.19 |
| IS18551 | 0.81 ± 0.08 | 0.92 ± 0.05 | 14.71 | 0.020* | 9.20 |
| Catalase (U/ml of enzyme) of genotype M35-1 | |||||
| Root | 5.867 ± 0.057 | 7.32 ± 0.168 | 24.76 | 0.008* | 8.18 |
| Shoot | 5.65 ± 0.172 | 6.03 ± 0.245 | 6.72 | 0.282NS | 1.26 |
| Superoxide dismutase (SOD) (U/ml of enzyme) of genotype M35-1 | |||||
| Root | 1.41 ± 0.40 | 1.75 ± 0.071 | 24.11 | 0.023* | 4.30 |
| Shoot | 2.08 ± 0.043 | 2.13 ± 0.08 | 2.4 | 0.589 NS | 0.60 |
Hypergravity elicits robust phytohormone dynamics in the root, profiled on the final count (day 10) of sorghum seedlings_ Resultant data was subjected to an independent sample t-test using SPSS – version 20_00_
| Hormones | Phytohormones (ng/gm of tissue) | ||||
|---|---|---|---|---|---|
| Ctr (1g) Mean ± SEM | 1000g 1 hr. Mean ±SEM | % change over control | p-value | t-stat. | |
| Indole Acetic Acid (IAA) | 131 ± 1.54 | 179 ± 7.33 | 36.59 | 0.019 | 6.396 |
| Indole Butyric Acid (IBA) | 23.20 ± 0.39 | 41.81 ± 0.29 | 80.18 | 0.000 | 38.18 |
| Benzyl aminopurine (BAP) | 0.61 ± 0.03 | 0.54 ± 0.03 | −10.30 | 0.271 | 1.278 |
| Zeatin transe isomer | 28.05 ± 0.68 | 2.58 ± 0.09 | −90.81 | 0.001 | 37.12 |
| Trans zeatin Riboside (ZR) | 0.31 ± 0.02 | 0.40 ± 0.03 | 30.66 | 0.084 | 2.603 |
| Gibberellic Acid 7 (GA7) | 0.07 ± 0.00 | 0.05 ± 0.00 | −21.51 | 0.058 | 2.858 |
| Gibberellic Acid 4 (GA4) | 3.13 ± 0.13 | 1.52 ± 0.09 | −51.61 | 0.001 | 10.11 |
| Gibberellic Acid 3 (GA3) | 0.93 ± 0.03 | 0.41 ± 0.02 | −55.75 | 0.000 | 15.30 |
| Abscisic Acid (ABA) | 2.37 ± 0.03 | 1.81 ± 0.06 | −23.40 | 0.005 | 7.506 |
| Salicylic Acid (SA) | 1046 ± 22.06 | 1650 ± 46.16 | 57.73 | 0.002 | 11.80 |
| Cis-Jasmonate (cis-JA) | 22.35 ± 0.95 | 29.27 ±0.26 | 30.92 | 0.014 | 6.992 |
| Methyl-Jasmonate | 0.47 ± 0.01 | 0.87 ± 0.01 | 87.13 | 0.000 | 17.71 |
Changes in germination, root, and shoot growth characteristics of three selected sorghum genotypes under greenhouse conditions_ Hypergravity-induced (1000xg, 1 hr) changes in germination, root length (cm), shoot length (cm), seedling vigour index, seedling fresh weight (gm), seedling dry weight (gm) and phenotype recorded at seedling growth stage (10th-day) of sorghum grown in a greenhouse condition_ The resultant data was subjected to an independent sample t-test [N=96] using SPSS – version 20_00_
| Genotypes | Ctr (1g) Mean ± SEM | 1000g 1 hr Mean ± SEM | % change over control | p-value | t-stat. |
|---|---|---|---|---|---|
| Germination (%) | |||||
| M35-1 | 87.8 ± 2.51 | 89.5 ± 1.15 | 1.99 | 0.145 | 0.361 |
| SPV2217 | 96.5 ± 0.00 | 93.0 ± 2.33 | −3.63 | 0.116 | 0.11 |
| IS18551 | 93.5 ± 0.66 | 94.3 ± 3.00 | 0.80 | 0.139 | 0.108 |
| Root length (cm) | |||||
| M35-1 | 16.1 ± 0.46 | 18.5 ± 1.02 | 15.06 | 0.010 | 6.072 |
| SPV2217 | 15.4 ± 0.82 | 17.5 ± 0.58 | 13.61 | 0.039 | 4.729 |
| IS18551 | 16.7 ± 0.45 | 17.1 ± 0.27 | 2.55 | 0.138 | 1.961 |
| Shoot length (cm) | |||||
| M35-1 | 8.8 ± 0.41 | 10.0 ± 1.35 | 14.57 | 0.043 | 4.868 |
| SPV2217 | 8.5 ± 1.44 | 9.4 ± 0.56 | 10.95 | 0.036 | 4.290 |
| IS18551 | 10.1 ± 0.28 | 10.3 ± 0.95 | 1.49 | 0.079 | 5.307 |
| Seedling vigour index (SVI) | |||||
| M35-1 | 2195.1 ± 24.4 | 2558.8 ± 20.9 | 16.57 | 0.005 | 5.251 |
| SPV2217 | 2422.0 ± 34.1 | 2662.7 ± 24.7 | 9.94 | 0.029 | 2.325 |
| IS18551 | 2635.8 ± 29.9 | 2751.4 ± 33.4 | 4.39 | 0.074 | 1.504 |
| Seedling fresh weight (gm) | |||||
| M35-1 | 9.2 ± 0.25 | 10.4 ± 0.71 | 13.93 | 0.039 | 2.293 |
| SPV2217 | 11.2 ± 0.52 | 12.3 ± 0.70 | 10.54 | 0.035 | 2.56 |
| IS18551 | 10.6 ± 0.18 | 11.1 ± 0.23 | 5.20 | 0.053 | 2.527 |
| Seedling dry weight (gm) | |||||
| M35-1 | 1.29 ± 0.52 | 1.49 ± 0.60 | 15.56 | 0.028 | 0.293 |
| SPV2217 | 1.88 ± 0.30 | 2.10 ± 0.48 | 12.00 | 0.034 | 0.644 |
| IS18551 | 1.41 ± 0.35 | 1.47 ± 0.47 | 4.79 | 0.138 | 0.284 |
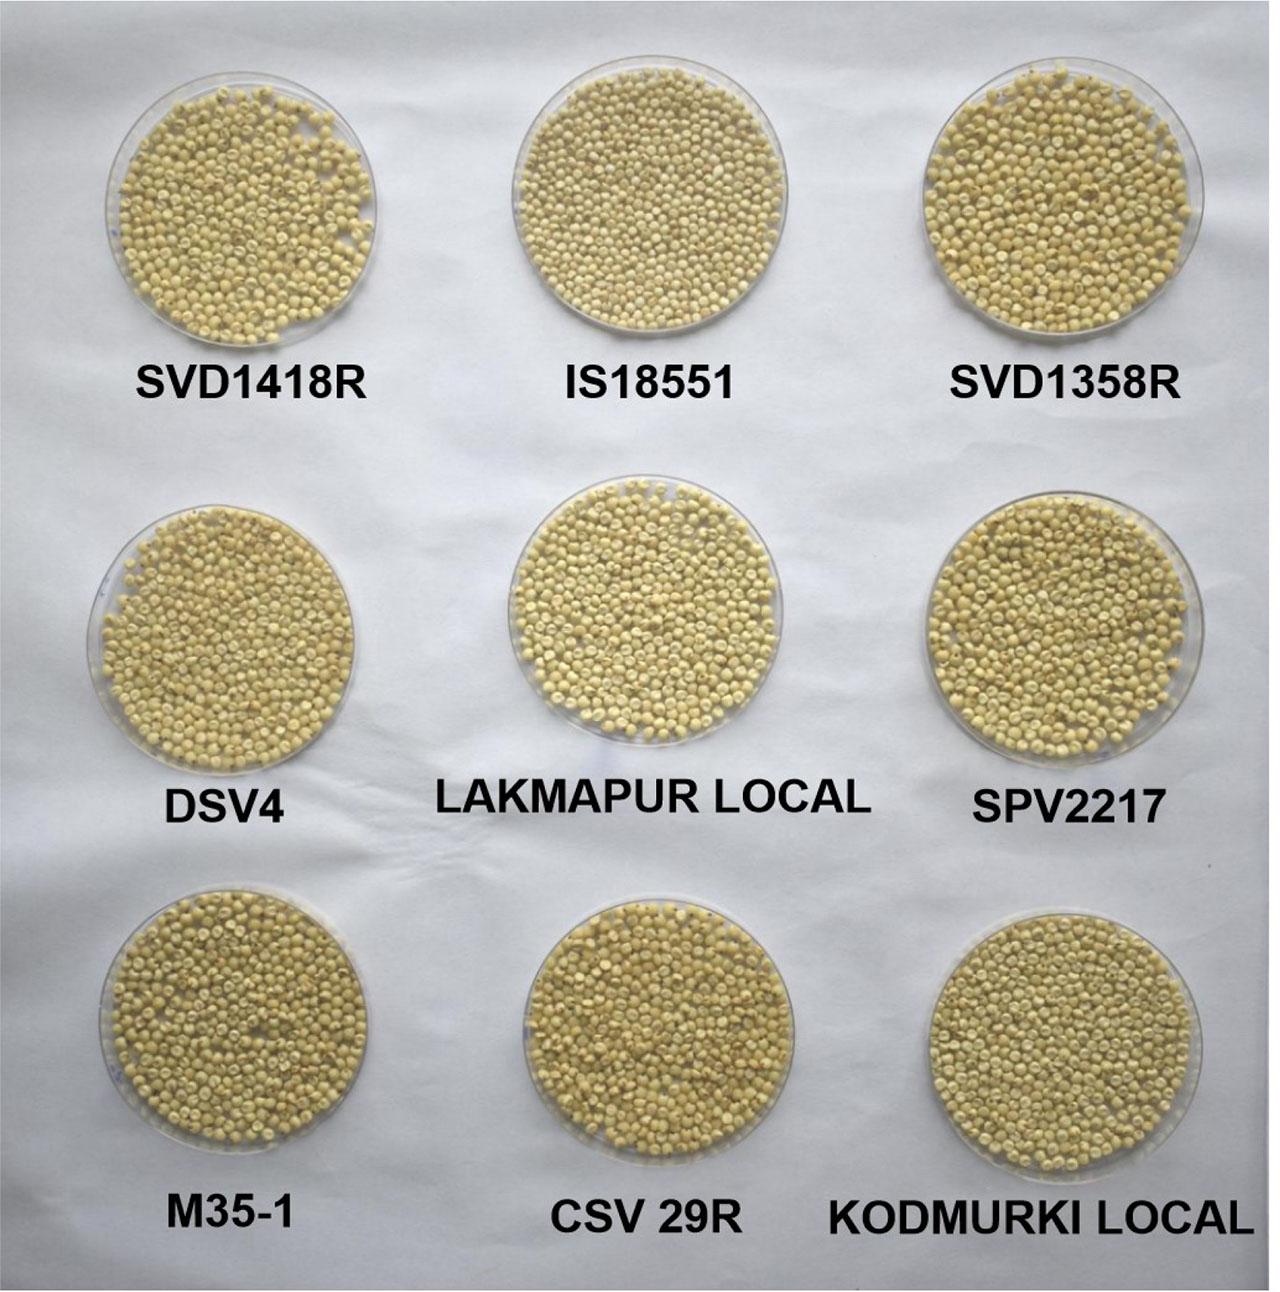
Seed Diameter and 100 Seed Weight Across Different Sorghum Genotypes_
| Sl. No. | Sorghum Genotypes | Seed Diameter (mm) | 100 Seed Weight (g) |
|---|---|---|---|
| 1 | SVD1418R | 1.6 | 3.85 |
| 2 | IS18551 | 1.3 | 2.67 |
| 3 | SVD1358R | 1.4 | 4.34 |
| 4 | DSV4 | 1.5 | 3.55 |
| 5 | LAKMAPUR LOCAL | 1.5 | 3.10 |
| 6 | SPV2217 | 1.6 | 4.15 |
| 7 | M35-1 | 1.6 | 4.16 |
| 8 | CSV 29R | 1.5 | 3.52 |
| 9 | KODMURKI LOCAL | 1.4 | 3.35 |
Varied hypergravity intensities evaluated for root, shoot, and seedling vigor index of sorghum seedlings in laboratory conditions_ In each test group (Control, 20, 40, 80, 100, 250, 500, 1000, 2500 and 5000g), four independent experimental groups of 30 seedlings in triplicate (30×3 = 90; 90×4 experiments = 360) were used for statistical analysis_ Resultant data was subjected to one-way ANOVA using SPSS – version 20_00_
| Hyper g treatment | Mean ± SEM | % change over control | p-value | Cal. F | CD (5 %) | CV (%) |
|---|---|---|---|---|---|---|
| Germination (%) | ||||||
| Ctr (1g) | 90.75±0.85 | - | - | 4.20 | 3.15 | 2.37 |
| 20g 1 hr | 90.75±1.43 | 0.00 | 1.000 | |||
| 40g 1 hr | 90.75±1.25 | 0.00 | 1.000 | |||
| 80g 1 hr | 94.75±0.25 | 4.41 | 0.221 | |||
| 100g 1 hr | 87.75±0.25 | −3.31 | 0.592 | |||
| 250g 1 hr | 89.75±0.25 | −1.10 | 0.999 | |||
| 500g 1 hr | 92.5±0.64 | 1.93 | 0.970 | |||
| 1000g 1 hr | 94.75±1.25 | 4.41 | 0.221 | |||
| 2500g 1 hr | 91.5±1.71 | 0.83 | 1.000 | |||
| 5000g 1 hr | 93.5±1.26 | 3.03 | 0.699 | |||
| Shoot length (cm) | ||||||
| Ctr (1g) | 12.52±0.04 | - | - | 41.92 | 0.43 | 2.26 |
| 20g 1 hr | 12.96±0.08 | 3.51 | 0.491 | |||
| 40g 1 hr | 11.77±0.04 | −5.99 | 0.024 | |||
| 80g 1 hr | 12.99±0.12 | 3.77 | 0.394 | |||
| 100g 1 hr | 13.28±0.04 | 6.07 | 0.211 | |||
| 250g 1 hr | 13.07±0.08 | 4.43 | 0.200 | |||
| 500g 1 hr | 12.47±0.05 | −0.34 | 1.000 | |||
| 1000g 1 hr | 15.32±0.17 | 22.38 | 0.011 | |||
| 2500g 1 hr | 12.27±0.07 | −2.00 | 0.959 | |||
| 5000g 1 hr | 13.29±0.03 | 6.15 | 0.239 | |||
| Root length (cm) | ||||||
| Ctr (1g) | 19.53±0.35 | - | - | 15.67 | 1.08 | 3.61 |
| 20g 1 hr | 21.56±0.37 | 6.58 | 0.230 | |||
| 40g 1 hr | 21.17±0.39 | 8.42 | 0.101 | |||
| 80g 1 hr | 19.71±0.26 | 0.92 | 1.000 | |||
| 100g 1 hr | 20.05±0.44 | 2.70 | 0.992 | |||
| 250g 1 hr | 19.59±0.64 | 0.31 | 1.000 | |||
| 500g 1 hr | 19.03±0.54 | −2.56 | 0.994 | |||
| 1000g 1 hr | 23.97±0.31 | 22.75 | 0.023 | |||
| 2500g 1 hr | 19.61±0.34 | 0.41 | 1.000 | |||
| 5000g 1 hr | 20.95±0.27 | 7.30 | 0.247 | |||
| Seedling vigour index | ||||||
| Ctr (1g) | 2918.0±22.13 | - | - | 22.35 | 138.94 | 3.15 |
| 20g 1 hr | 3043.0±41.23 | 4.28 | 0.171 | |||
| 40g 1 hr | 2914.7±7.57 | −0.11 | 1.000 | |||
| 80g 1 hr | 3099.5±35.74 | 6.22 | 0.063 | |||
| 100g 1 hr | 2850.7±40.23 | −2.30 | 0.973 | |||
| 250g 1 hr | 2980.5±20.43 | 2.14 | 0.974 | |||
| 500g 1 hr | 2963.7±40.38 | 1.57 | 1.000 | |||
| 1000g 1 hr | 3638.7±58.45 | 24.70 | 0.001 | |||
| 2500g 1 hr | 2906.7±37.45 | −0.39 | 1.000 | |||
| 5000g 1 hr | 3117.7±27.98 | 6.85 | 0.059 | |||